Abstract
In recent years, there has been a growing focus on the development of medium-sized drugs based on peptides or nucleic acids owing to their potential therapeutic benefits. As some of these medium-sized drugs exert their therapeutic effects by adopting specific secondary structures, evaluating their conformational states is crucial to ensure the efficacy, quality, and safety of the drug products. It is important to assess the structural integrity of biomolecular therapeutics to guarantee their intended pharmacological activity and maintain the required standards for drug development and manufacturing. One widely utilized technique for quality evaluation is secondary structural analysis using circular dichroism (CD) spectroscopy. Given the higher production and quality control costs associated with medium-sized drugs compared with small-molecule drugs, developing analytical techniques that enable CD analysis with reduced sample volumes is highly desirable. Herein, we focused on a microsampling disk-type cell as a potential solution for reducing the required sample volume. We investigated whether CD spectral analysis using a microsampling disk could provide equivalent spectra compared with the standard cell (sample volume: approx. 300 µL). Our findings demonstrated that the microsampling disk (sample volume: 2–10 µL) could be successfully applied to CD spectral analysis of peptide and nucleic acid drugs, paving the way for more efficient and cost-effective quality evaluation processes.
Introduction
In recent years, there has been a growing interest in the development of medium-sized drugs that have different mechanisms of action to those of conventional small-molecule drugs. Medium-sized drugs based on peptides or nucleic acids can take advantage of their molecular size and ability to recognize a wide range of interfaces on protein surfaces or target nucleic acid sequences.1,2) They are therefore expected to produce new therapeutic effects that cannot be obtained with conventional small-molecule drugs. It is now possible to rapidly screen bioactive peptides and many candidate peptide drugs are expected to be developed as a result.3–5) Nucleic acid drugs are mainly composed of nucleotides and act with high specificity on mRNAs and proteins, which are difficult to target with conventional drugs. Nucleic acid molecules with different mechanisms of action, such as antisense, aptamer, and RNA interference therapies, have also been marketed as nucleic acid drugs.6,7) Nucleic acid drugs are created by modifying the structure of the sugar-phosphate backbone to acquire resistance to nucleic acid-degrading enzymes in vivo.8) In recent years, morpholino nucleic acid-type drugs (morpholino oligomers), which have a different structure to conventional nucleotides, have provided one way to assess quality.9)
While these medium-sized drugs have shown significant therapeutic effects, there is an urgent need to establish methods to properly evaluate their quality and safety. Peptides and nucleic acids need to form appropriate secondary structures to carry out their functions,2,10) and evaluating the secondary structures of medium-sized drugs is one way to assess their quality.
The Japanese Pharmacopoeia (JP) has adopted circular dichroism (CD) spectral analysis as reference information for evaluating the quality of pharmaceuticals. However, medium-sized drugs consisting mainly of peptides and nucleic acids are synthesized using solid-phase methods, which may result in a smaller yield scale and more expensive samples compared with conventional pharmaceuticals consisting mainly of small molecules. Therefore, securing sufficient sample volume for CD measurement of medium-sized pharmaceuticals is expected to be challenging. Additionally, in recent years, there has been a drive to reduce the amount of chemicals and solvents used to ease the environmental burden, and new methods that enable CD measurement with smaller sample volumes are being developed.
The Establishment of the test procedure section within the Guideline for Drafting Monographs for the JP 18th, includes the statement “In stipulating the preparation method for a test sample, make efforts to reduce as far as possible the amount of the sample and the reagents used in the test.”11)
Based on this background, we focused on using a microsampling disk-type cell to reduce the sample volume in CD measurement.12) In microsampling disk measurements, a liquid column is formed by utilizing the surface tension of the sample to secure the optical path length. Conventional standard cells can measure using sample volumes of 200–500 µL (Fig. 1). However, if the equivalence of the CD spectra is lost due to a decrease in sample volume, it may become impossible to evaluate the quality of the pharmaceutical products. In this study, we investigated the conditions for obtaining CD spectra using a microsampling disk and compared the data with those from a standard cell to evaluate the usefulness of the microsampling disk approach.
First, we examined data comparisons for four typical structures of peptide drugs: linear peptide, cyclic peptide, helical peptide, and protein. The approved drugs leuprorelin (linear peptide),13) oxytocin (cyclic peptide),14) semaglutide (helical peptide),15) and insulin (protein)16) were selected as models (Table 1a). Their CD spectra were acquired and compared for various sample volumes and concentrations. As models for nucleic acid drugs, mipomersen (antisense; full-phosphorothioate, 2′-MOE),17) pegaptanib (aptamer; 2′-OMe, 2′-F, 3′-inverted dT),18) givosiran (small interfering RNA (siRNA); partial-phosphorothioate (PS), 2′-OMe, 2′-F),19) and viltolarsen (morpholino antisense oligonucleotide)20) were selected and examined in the same manner as the peptide drugs (Table 1b). In the CD section of the JP, the criteria for CD spectral identity are specified as follows: “When the spectrum of a sample is compared with the reference spectrum of the substance to be confirmed or the spectrum of the reference standard, and both spectra give the same intensity of molar circular dichroism or molar ellipticity at the same wavelength, their identity can be confirmed mutually.”21)
Table 1. The Structural Features of the Selected (a) Peptide and (b) Nucleic Acid Drugs in This Study
| (a) |
|---|
| Number of Amino acid residues | Structural features |
|---|
| Leuprorelin | 9 | Linear peptide |
| Oxytocin | 9 | Cyclic peptide |
| Semaglutide | 31 | Helical peptide |
| Insulin | 51 | Protein |
| (b) |
|---|
| Number of bases | Structural features |
|---|
| Mipomersen | 20 | Full-phosphorothioate, terminal 2′-MOE |
| Pegaptanib | 28 | 2′-OMe, 2′-F, 3′-inverted dT |
| Givosiran | 21 | Double stranded RNA, partial-PS, 2′-OMe, 2′-F |
| Viltolarsen | 21 | Morpholinos |
CD spectra of peptide samples exhibit specific patterns corresponding to secondary structures such as random coils (negative maximum at around 200 nm), α-helices (positive maximum at around 192 nm, negative maxima at around 208 and 222 nm), and β-sheets (positive maximum at around 195 nm, negative maximum at around 216 nm).22) Nucleic acid molecules like DNA and RNA also display characteristic CD spectra that reflect differences in their structures such as A-form duplexes (negative maximum at around 210 nm, positive maximum at around 260 nm) and B-form duplexes (negative maximum at around 245 nm, positive maximum at around 275 nm).23)
Results and Discussion
Each model peptide and nucleic acid was prepared as an aqueous solution, and CD spectra were measured at concentrations in the range 10–400 µM. Since microsampling methods require a liquid column based on the surface tension of the sample, there are concerns relating to using unsuitable solvents, for example organic solvents such as trifluoroethanol (TFE), acetonitrile, MeOH, or EtOH. Therefore, peptides and nucleic acids soluble in aqueous solvents were chosen as model samples. Initially, we measured CD spectra of peptide drugs using 2- or 10-µL samples for microsampling measurements and 300-µL samples for standard cell measurements and investigated the equivalence of the two methods. For both the standard cell and microsampling disk measurements, an increase in voltage at high concentrations (400 µM) meant that standard spectra were not obtained.
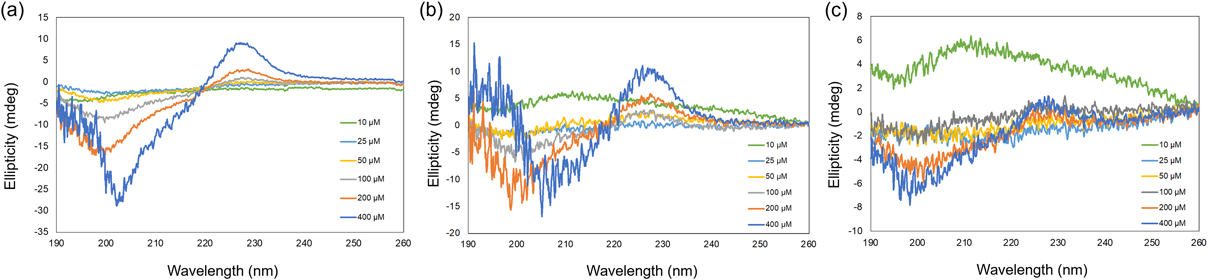
CD spectroscopy was used to study the secondary structures of linear and cyclic peptide drugs including leuprorelin (Fig. 2) and oxytocin (Fig. 3). The CD spectra exhibited unstructured patterns characteristic of random coil conformations for these peptides. However, when using microsampling disks (small sample holders) to significantly reduce the sample volume to 2 µL, disordered CD spectra were obtained, precluding confirmation of spectral equivalence with standard measurement conditions (Fig. 2c). Subsequently, peptide therapeutics known to adopt α-helical structures were investigated, including semaglutide (Fig. 4) and insulin (Fig. 5). Their CD spectra displayed characteristic negative maxima at 208 and 222 nm, strongly indicating the presence of α-helical folding. Notably, under microsampling conditions with moderate peptide concentrations (50–200 µM), comparable spectral intensities to standard measurements were achieved, exhibiting the typical α-helical CD signature. This finding suggests the applicability of microsampling analysis for probing the secondary structures of α-helical peptide drugs. Collectively, these results highlight that peptide drugs forming distinct higher-order structures like α-helices, yield robust CD spectral intensities when measured using microsampling. Moreover, the use of microsampling disks enabled significant sample volume reductions, up to 20-fold compared with conventional methods, while facilitating quality assessment of medium-sized peptide therapeutics. The approach holds promise for streamlining analytical workflows in peptide drug development and characterization.
We hypothesized that obtaining CD spectra of nucleic acid molecules forming secondary structures could elucidate the quality of nucleic acid drugs. Therefore, we measured and compared CD spectra of the double-strand structure formed by each nucleic acid drug and its fully complementary oligonucleotide strand, representing the target sequence in vivo, except for pegaptanib. First, CD spectra were acquired using a standard 300-µL cell. Mipomersen known as a Gapmer ASO with 2′-MOE modifications at the 5′ and 3′ end, exhibited negative maxima at 250 and 210 nm, and a positive maximum around 270 nm (Fig. 6a), indicating a mixed spectrum of A-form DNA (from the ends) and B-form DNA (from the center). Pegaptanib, a single-stranded aptamer, showed negative maxima at 210 and 250 nm, and positive maxima at 220 and 270 nm (Fig. 7a), suggesting an intramolecular stem-loop structure. Givosiran, a double-stranded siRNA, exhibited a typical A-form RNA spectrum with a negative maximum at 210 nm and positive maximum around 260 nm (Fig. 8a). Viltolarsen, a morpholino ASO, displayed a negative maximum around 250 nm and a positive maximum around 280 nm (Fig. 9a), indicating a B-form DNA-like double helix with the complementary strand. Measurements were then performed using a microsampling disk (Figs. 6b–9b), and although signal intensities varied, characteristic spectra were obtained for each nucleic acid drug within the 5–10 µM concentration range. In a microsampling disk, the solution is sandwiched between two quartz disks with a spacer, which can cause minor distortions during assembly, affecting the signal intensity and baseline. This distortion is more noticeable for weak signals. However, increasing the number of integrations can reduce signal intensity variation, and microsampling disks are considered sufficiently applicable for quality assurance by confirming the secondary structure of the target molecule.
Conclusion
This study explored the feasibility of using microsampling disks for CD spectroscopic analysis of medium-sized drugs comprising peptides or nucleic acids. The approach aimed to reduce sample volume requirements, aligning with recent efforts to minimize chemical and solvent usage while streamlining analytical workflows in drug development and manufacturing. For peptide drugs exhibiting distinct secondary structures, such as the α-helical conformations observed in semaglutide and insulin, microsampling disks provided comparable spectral intensities to conventional measurements at moderate concentrations (50–200 µM). The characteristic negative maxima at 208 and 222 nm, indicative of α-helical folding, were robustly captured using microsampling conditions. These findings highlight the applicability of this approach for probing the higher-order structures of α-helical peptide therapeutics, enabling reductions in sample volumes by up to 20-fold compared with standard methods. In contrast, for peptides exhibiting random coil conformations, like leuprorelin and oxytocin, the use of microsampling disks did not ensure spectral equivalence with standard measurements. The disordered CD spectra obtained under microsampling conditions precluded confirmation of structural integrity, suggesting limitations in applying this technique to evaluate unstructured peptides. Notably, CD analysis of nucleic acid drugs using microsampling disks demonstrated promising potential for quality assessment. By measuring hybridized double-stranded structures formed with complementary oligonucleotide strands, representing the intended target sequences in vivo, characteristic CD signatures were obtained within a specific concentration range (5–10 µM). This approach enabled substantial reductions in sample volumes, up to 30-fold compared with conventional methods, while facilitating conformational evaluation of nucleic acid therapeutics. However, it is noteworthy that the microsampling disk assembly, which involves sandwiching the sample between quartz disks with a spacer, may introduce minor distortions that impact signal intensity and baseline stability, particularly for weakly signaling samples. Nonetheless, increasing the number of spectral integrations can mitigate these intensity variations, rendering the technique applicable for quality assurance purposes through confirmation of the secondary structure of the target molecule.
Overall, the findings from this study demonstrate the potential of microsampling disks for CD spectroscopic analysis of medium-sized peptide and nucleic acid drugs, offering a promising avenue for reducing sample and solvent consumption during drug development and manufacturing processes. While certain limitations exist, such as restricted solvent compatibility and applicability to unstructured peptides, the ability to evaluate higher-order conformations with significantly reduced sample volumes presents a compelling opportunity to streamline analytical workflows and enhance sustainability efforts in the pharmaceutical industry.
Experimental
ReagentsThe tested peptides (leuprorelin, oxytocin, semaglutide, and insulin) were purchased from Tokyo Chemical Industry (Tokyo, Japan), Peptide Institute Inc. (Osaka, Japan), MedChemExpress (Monmouth Junction, NJ, U.S.A.), and FUJIFILM Wako Pure Chemical Corporation (Osaka, Japan), respectively. Nucleic acid drugs (mipomersen, pegaptanib, and givosiran) were prepared by automated DNA/RNA synthesis (M-2-MX-E, Nihon Techno Service, Ibaraki, Japan). Solid phase synthesis of oligo DNAs and RNAs was performed using standard phosphoramidite chemistry. For pegaptanib, it was used without the addition of the high molecular weight PEG chain at the 5′ position. For givosiran, only the nucleic acid sequence (sense and antisense strands) portion was used, and the TriGalNAc moiety at the 3′ position of the sense strand was not added. Viltolarsen (Viltepso Injection 250 mg) was purchased from Nippon-Shinyaku (Kyoto, Japan).
CD Spectral AnalysisCD spectra were recorded with a Jasco J-720W spectropolarimeter using a 1.0 mm path length quartz cell (Q-101, AS ONE, Osaka, Japan) and a microsampling disk (MSD-462, JASCO, Tokyo, Japan), which had a 1.0 and 0.2 mm path length for 10 and 2 µL samples, respectively. The CD measurement conditions were: peptide concentration; 10–400 µM, nucleic acid concentration; 1–10 µM, number of scans; 10, scan speed; 50 mm/min. The data are expressed in terms of [θ]; i.e., total ellipticity (mdeg). Distilled water for leuprorelin, 20 mM phosphate buffer (pH = 7.4) for oxytocin and semaglutide, and 10 mM HCl aqueous solution for insulin were used as solvents. Sodium phosphate (10 mM, pH 7.0) containing 100 mM NaCl was used as the solvent for the CD spectral measurements of nucleic acid drugs.
Acknowledgments
This study was supported in part by AMED under Grant Number: 24mk0101220 (to YD).
Conflict of Interest
The authors declare no conflict of interest.
References
- 1) Cheng J., Zhou J., Kong L., Wang H., Zhang Y., Wang X., Liu G., Chu Q., RSC Med. Chem., 14, 2496–2508 (2023).
- 2) Nakamura Y., Biochimie, 145, 22–33 (2018).
- 3) Tsiamantas C., Otero–Ramirez M. E., Suga H., Methods Mol. Biol., 2001, 299–315 (2019).
- 4) Tanada M., Tamiya M., Matsuo A., et al., J. Am. Chem. Soc., 145, 16610–16620 (2023).
- 5) Merz M. L., Habeshian S., Li B., David J. G. L., Nielsen A. L., Ji X., Il Khwildy K., Duany Benitez M. M., Phothirath P., Heinis C., Nat. Chem. Biol., 20, 624–633 (2024).
- 6) Kulkarni J. A., Witzigmann D., Thomson S. B., Chen S., Leavitt B. R., Cullis P. R., Meel R., Nat. Nanotechnol., 16, 630–643 (2021).
- 7) Egli M., Manoharan M., Nucleic Acids Res., 51, 2529–2573 (2023).
- 8) Kawamoto Y., Wu Y., Takahashi Y., Takakura Y., Adv. Drug Deliv. Rev., 199, 114872 (2023).
- 9) Nornes S., Growth C., Camp E., Ey P., Lardelli M., Exp. Cell Res., 289, 124–132 (2003).
- 10) Wang H., Dawber R. S., Zhang P., Walko M., Wilson A. J., Wang X., Chem. Sci. (Camb.), 12, 5977–5993 (2021).
- 11) Ministry of Health, Labour and Welfare. “Japanese Parmacopeia.”: ‹https://www.mhlw.go.jp/stf/seisakunitsuite/bunya/0000066597.html›, cited 16 April, 2024.
- 12) Kondo Y., Biophys. J., 104, 72a (2013).
- 13) Wilson A. C., Meethal S. V., Bowen R. L., Atwood C. S., Expert Opin. Investig. Drugs, 16, 1851–1863 (2007).
- 14) Wiśniewski K., Methods Mol. Biol., 2001, 235–271 (2019).
- 15) Lexchin J., Mintzes B., Drug Ther. Bull., 61, 182–188 (2023).
- 16) Weiss M. A., Vitam. Horm., 80, 33–49 (2009).
- 17) Hair P., Fiona Cameron F., McKeage K., Drugs, 73, 487–493 (2013).
- 18) Food and Drug Administration. “Highlights of Prescribing Information (Macugen).” 3–12 (July 2007): ‹https://pi.bauschhealth.com/globalassets/BHC/PI/Macugen-PI.pdf?ver=2021-05-21-022911-740›, cited 16 April, 2024.
- 19) Scott L. J., Drugs, 80, 335–339 (2020).
- 20) Watanabe N., Nagata T., Satou Y., Masuda S., Saito T., Kitagawa H., Komaki H., Takagaki K., Takeda S., Mol. Ther. Nucleic Acids, 13, 442–449 (2018).
- 21) “Supplement I to The Japanese Pharmacopoeia,” 18th edition, 2022.
- 22) Migliore M., Bonvicini A., Tognetti V., Guilhaudis L., Baaden M., Oulyadi H., Joubert L., Ségalas-Milazzo I., Phys. Chem. Chem. Phys., 22, 1611–1623 (2020).
- 23) Bishop G. R., Chaires J. B., Curr. Protoc. Nucleic Acid Chem., Chapter 7, 7.11.1–7.11.8 (2003).