Abstract
Optimization of the manufacturing process based on scientific evidence is essential for quality control of active pharmaceutical ingredients. Real-time monitoring can ensure the production of stable quality crystals in the crystallization process. Raman spectroscopy is an attractive tool for pharmaceutical quality evaluation and process analytical technology because of its ability to analyze samples non-destructively and rapidly. In this study, we attempted to monitor the crystal polymorphs of carbamazepine (CBZ I and CBZ III) during the dissolution and crystallization processes using low-frequency Raman spectroscopy, which can reflect differences in lattice vibrations originating from polymorphs in the scattering peaks. Furthermore, using multivariate analysis of the obtained spectra, we attempted to develop a model that enables the quantification of each polymorph. A partial least squares was performed to build the prediction model. The prediction model was built using a set of 33 calibration samples, and an external set of 12 validation samples was used to evaluate the model. The model presents a good prediction capacity. The quantitative results for the solid amount of carbamazepine in suspension calculated using the model during the dissolution and crystallization process showed results that correlated very well with the particle view results. It is suggested that low-frequency Raman spectroscopy can be used as a useful process analytical technology tool.
Introduction
Crystallization is a pivotal unit operation in the industrial separation and purification processes of active pharmaceutical ingredients (APIs).1,2) The crystallization process dictates several critical quality attributes (CQAs) of the API, including particle size distribution, crystal shape, polymorphs, and purity.3) Among these attributes, different polymorphs of a compound exhibit significant differences in physicochemical properties such as melting point, solubility, dissolution rate, and chemical reactivity.4) These differences are attributed to variations in molecular packing and intermolecular interactions within the crystal lattice.5) In the pharmaceutical industry, the polymorphic transition of ritonavir, a protease inhibitor marketed as Norvir, underscored the critical need for stringent polymorphic control and monitoring.4,6) Polymorphic transitions can lead to changes in drug solubility and bioavailability, impacting therapeutic outcomes and potentially leading to clinical failures.7) Process analytical technology (PAT) has emerged as a transformative approach in the pharmaceutical industry, revolutionizing drug development and production processes.8) By integrating advanced analytical tools, real-time monitoring, and data-driven decision-making, PAT enhances product quality and process efficiency, leading to significant benefits for pharmaceutical companies.9) The real-time data facilitate continuous process monitoring and enable the dynamic adjustment of process parameters to maintain product quality within predefined specifications. Among the array of PAT tools, spectroscopic methods such as near-IR (NIR), IR, and Raman spectroscopy have gained significant traction for their noninvasive, rapid, and precise analytical capabilities.10–13) Unlike NIR and IR spectroscopy, which often face interference from water and require complex sample preparation,14) Raman spectroscopy can acquire compound-specific spectra with minimal sample handling. This makes it particularly suitable for in situ monitoring applications. In particular, Raman spectra in the low-frequency region are expected to be useful for monitoring the crystal polymorphs of API, which could be difficult to identify in the conventional spectral region because the scattering peaks can reflect the difference in lattice vibration derived from polymorphism.15–18) In this study, the process of polymorphic transition of bulk API was monitored using low-frequency Raman (LF Raman) spectroscopy to identify crystal polymorphs using carbamazepine (CBZ) as a model compound. In addition, we attempted to develop a model that enables quantification of each polymorph during dissolution and crystallization processes of API using multivariate analysis of obtained spectra.
Experimental
Materials
Carbamazepine (>97.0% purity, Tokyo Chemical Industry Co., Ltd., Tokyo, Japan), a stable form (CBZ III), was used as the API. CBZ metastable form (CBZ I) was prepared from CBZ III using the following procedure.19) CBZ III was heated in an oven heated to 170°C for 1 h. The prepared sample was confirmed by comparing the powder X-ray diffraction (PXRD) results with published data (Supplementary Fig. S1). Methanol (>99.8% purity, Kanto Chemical Co., Inc., Tokyo, Japan; Grade: special) was used to prepare CBZ suspensions.
LF Raman Spectroscopy
LF Raman spectroscopy measurements were performed using a THz-Raman probe system comprising a TR-Probe (Coherent Inc., Monrovia, CA, U.S.A.) attached to an ALL-IN-ONE Raman spectrometer (MarqMetrix LLC, Seattle, WA, U.S.A.). Analysis was carried out at room temperature with a wavelength of 808 nm and the laser power set at 300 mW. Sulfur was used as a reference standard to monitor wavenumber accuracy. The exposure time was 1 s for powder and 10 s for suspension. The integration was performed 3 times for both powder and suspension.
In Situ Monitoring of CBZ Dissolution and Crystallization Processes
In situ LF Raman monitoring of the dissolution and crystallization processes of CBZ was attempted using Crystalline (Technobis B.V., Netherlands) by changing the temperature of the suspension. A suspension was prepared by adding 500 mg of CBZ I to 3.5 mL of methanol saturated with CBZ. The temperature was increased from 20 to 60°C at a rate of +2°C/min, held at 60°C for 20 min, and then cooled from 60 to 20°C at a rate of −0.5°C/min. LF Raman measurements were taken every 120 s after the start of the test using an ALL-IN-ONE Raman spectrometer with a THz-Raman probe. Particle view images were acquired every 5 min by Crystalline.
Calibration Model Development and Model Evaluation
The calibration models were developed using a calibration set of 33 samples, and a validation set of 12 samples was prepared independently of the calibration set (Supplementary Table S1).
The Raman spectra of these samples were the input variables, and the undissolved solid amount of CBZ in suspension was the response variable. Partial least squares regression (PLSR) was performed to develop calibration models. PLSR is a standard statistical method used in chemometrics for building quantitative models. It is useful when dealing with high-dimensional data, such as spectroscopic data, where the number of variables is larger than the number of samples. Spectral pre-processing and PLSR analysis were conducted using Solo + MIA software (ver. 8.6.2, Eigenvector Research Inc, Manson, WA, U.S.A.). The prediction performance of the model was evaluated using the following performance metrics: the coefficient of determination (R2), root mean square error of calibration (RMSEC), root mean square error of cross-validation (RMSECV), and root mean square error of prediction (RMSEP). The predicted amount of undissolved CBZ in suspension was compared to the actual amount of undissolved CBZ in suspension. RMSEC was calculated using the predicted values and the sample size of the calibration set, RMSECV was calculated using the predicted values from cross-validation and the sample size of the calibration set, and RMSEP was calculated using the predicted values and the sample size of the validation set. Cross-validation was performed using the Venetian blinds cross-validation method.20) The spectral pre-processing condition was the standard normal variate (SNV).21) Both the input variables and response variables were scaled using mean centering.
Results and Discussion
CBZ I is a metastable form, while CBZ III is a stable form; therefore, CBZ III is typically detected after a standard crystallization process in methanol. To evaluate the monitoring performance of these two polymorphs of CBZ during the dissolution and crystallization processes, an experiment was designed to first completely dissolve a suspension of CBZ I by heating, and then cool it to crystallize CBZ III. Figure 1 shows the LF Raman spectra of CBZ suspension during the heating and cooling processes. As the temperature increased, the peaks unique to CBZ I at around 24, 70, and 109–118cm–1 weakened, and as the temperature decreased, the peaks unique to CBZ III at around 35 and 105cm–1 increased.
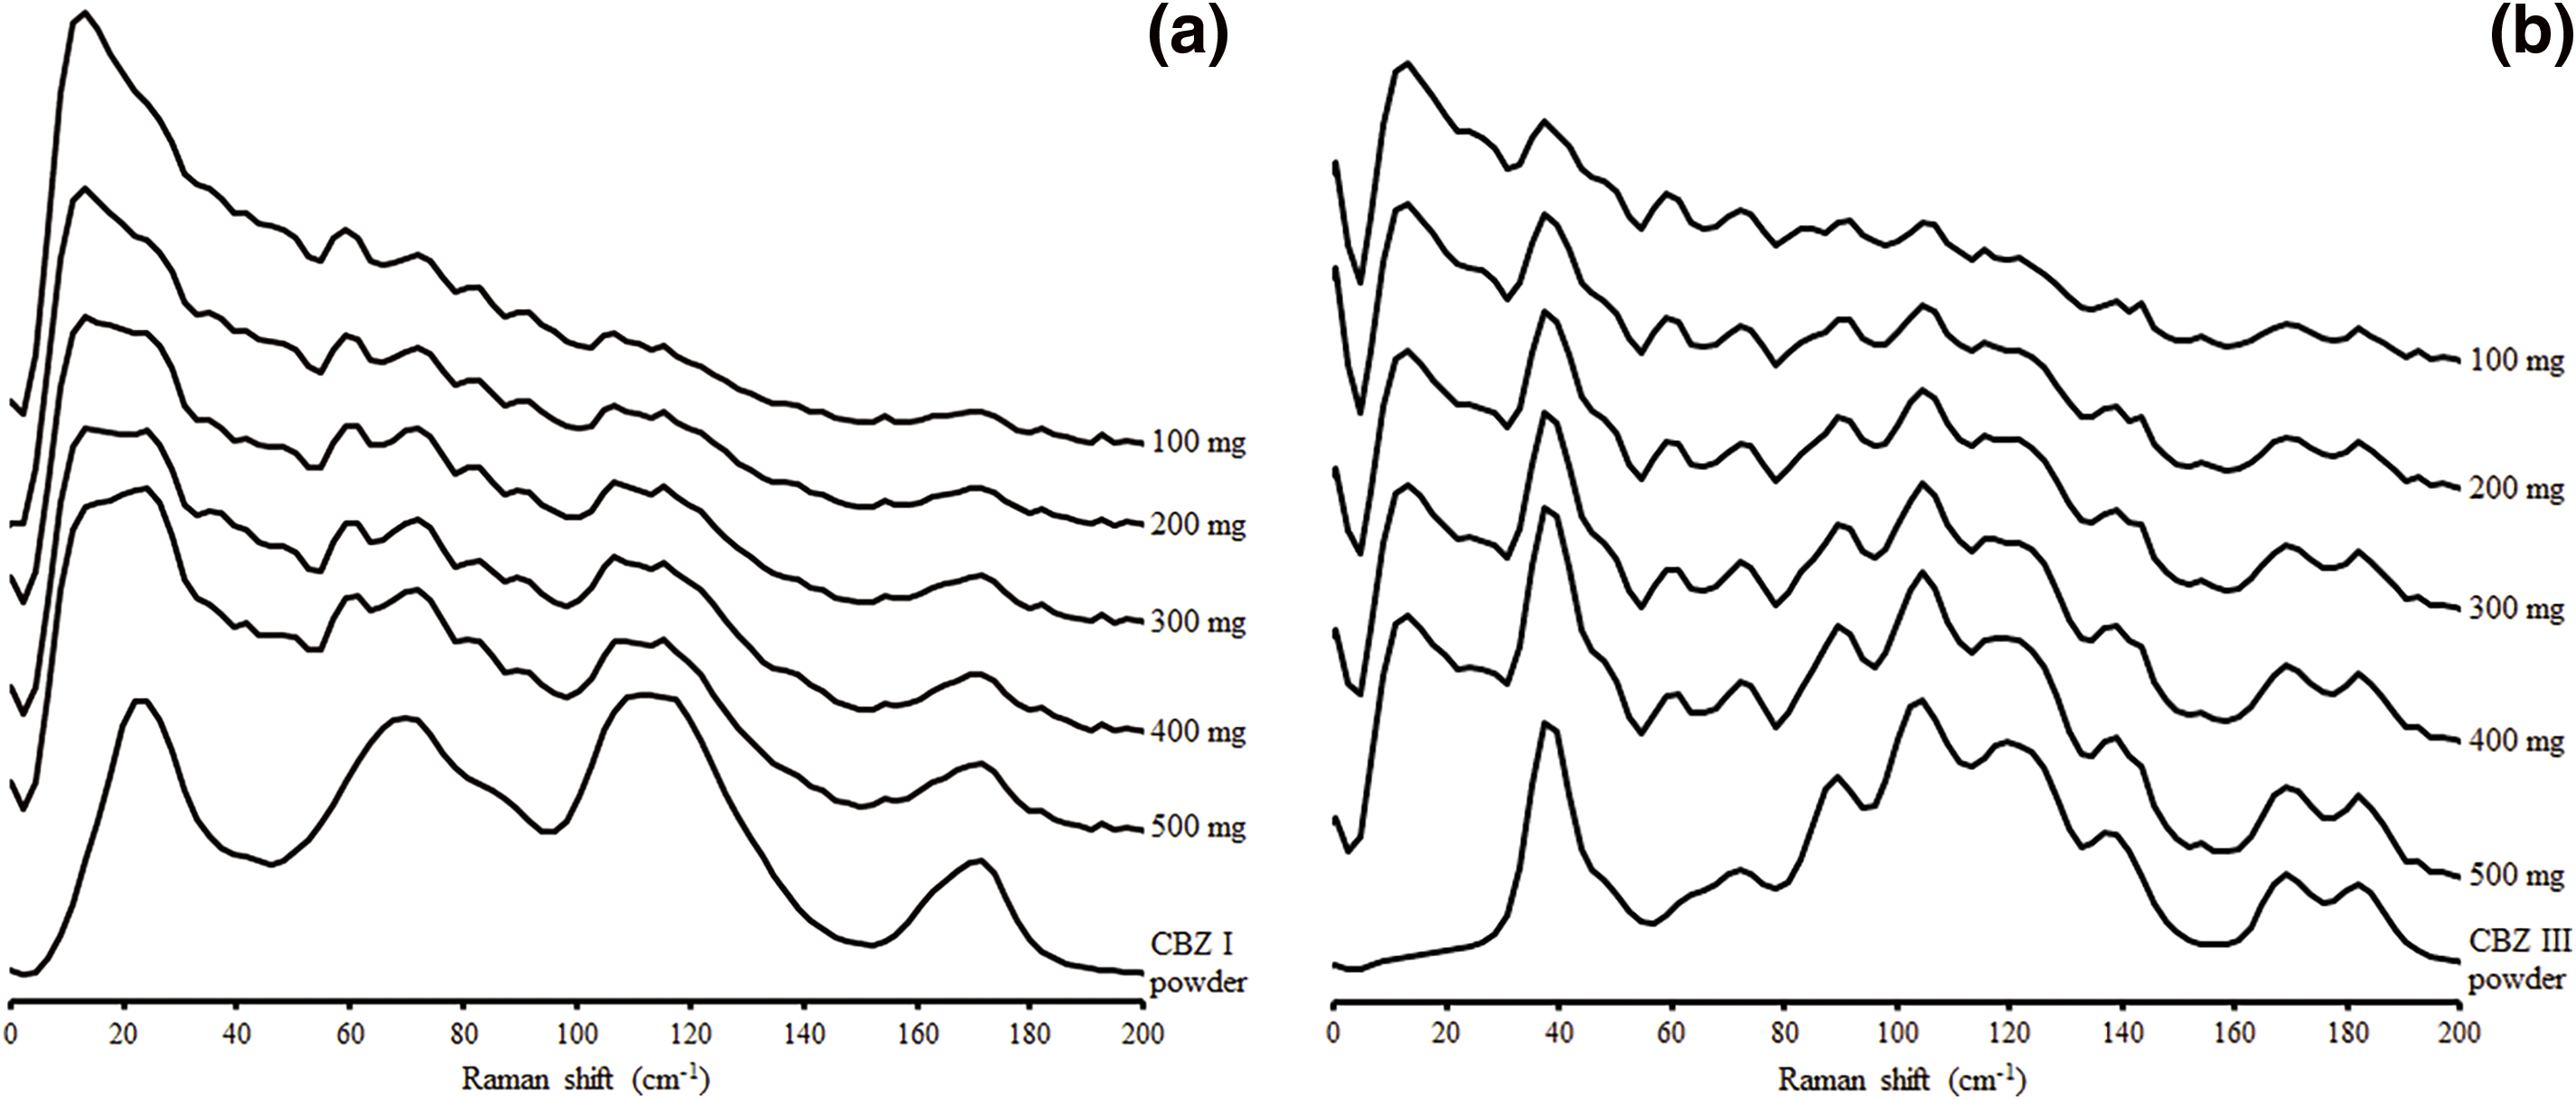
Figure 2 shows the LF Raman spectra of the calibration samples. A concentration-dependent increase in CBZ peak intensity was observed in each sample group. We performed PCA using the LF Raman spectra for the calibration set, and the scores are shown in Supplementary Fig. S2.
A calibration model was developed using the LF Raman spectra with wavenumbers ranging from 0 to 154 cm–1. Through the performance evaluation of the PLSR model using different pre-processing methods for CBZ III (Supplementary Table S2), we concluded that SNV was the pre-processing method that resulted in the lowest RMSECV value. In this study, we selected 3 as the number of PLS factors as discussed in the Supplementary materials (Supplementary Table S3). Figure 3 shows the very good correlation between actual versus predicted values by the regression models. Figure 4 represents the scores of the PLS model for CBZ I and CBZ III, respectively. The contribution of PLS factor 1 of CBZ I was 69.32%, showing peaks at wavenumbers similar to those of the pre-processed spectrum of CBZ I, as shown in Supplementary Fig. S3 (a). Similarly, the contribution of PLS factor 1 of CBZ III was 76.11%, showing peaks at wavenumbers similar to those of the pre-processed spectrum of CBZ III, as shown in Supplementary Fig. S3 (b). Thus, the calibration model developed well correlated with changes in the respective solid amounts of CBZ I and CBZ III in suspension.
The R2, RMSEC, RMSECV, and RMSEP are presented in Table 1. The R2 values are 0.984 for CBZ I and 0.991 for CBZ III. These R2 values are comparable to those previously reported using a conventional Raman spectroscopy for CBZ I to the dihydrate in aqueous suspension (R2 = 0.998), CBZ I to the dihydrate in dry powder (R2 = 0.982) and CBZ III to the dihydrate in dry powder (R2 = 0.952).22) Also, the R2 values reported in CBZ tablets using a conventional Raman spectroscopy are comparable (R2 = 0.965 for CBZ I and R2 = 0.994 for CBZ III).23) The calibration model developed showed RMSEP of 20.1 mg for CBZ I and 15.3 mg for CBZ III, which corresponds to a concentration of 5.74 and 4.37 mg/mL, respectively. The method was considered useful for in-line polymorph analysis, including low concentrations, as it showed good RMSEP with sample concentrations ranging from 0 to 143 mg/mL.
Table 1. Calibration and Analytical Parameters of the PLS Models
| Parameters |
CBZ I solid amount
(mg) |
CBZ III solid amount
(mg) |
| RMSEC |
22.6 |
16.3 |
| RMSECV |
25.7 |
19.2 |
| RMSEP |
20.1 |
15.3 |
| R2 |
0.984 |
0.991 |
RMSEC: root mean square error of calibration; RMSECV: root mean square error of cross-validation; RMSEP: root mean square error of prediction; CBZ: carbamazepine; PLS: partial least square.
Figure 5 shows the quantitative evaluation results during the dissolution and crystallization processes of CBZ suspension using the established calibration model. The results of in situ LF Raman monitoring with the quantitative model showed that CBZ I was completely dissolved at 55°C when the suspension was heated from 20°C at a rate of +2°C/min and that CBZ III began to crystallize at 35°C when the solution was cooled at a rate of –0.5°C/min. The particle view results by the Crystalline correlated very well with the quantitative evaluation results, as shown in Fig. 6. The results using Crystalline visually support that the calibration model developed is capable of quantifying CBZ I and CBZ III amount in suspension.
Conclusion
In this study, we successfully developed a quantitative model that enables the measurement of CBZ I and CBZ III amounts in suspension using LF Raman spectroscopy. By developing the quantitative model and applying it to the crystallization process of API, it is suggested that in situ monitoring of crystal polymorph transition and its quantification are possible, demonstrating that the combination of LF Raman spectroscopy and multivariate analysis is useful as a PAT tool.
Conflict of Interest
The authors declare no conflict of interest.
Supplementary Materials
This article contains supplementary materials.
References
- 1) Chen J., Sarma B., Evans J. M. B., Myerson A. S., Cryst. Growth Des., 11, 887–895 (2011).
- 2) Desiraju G. R., J. Am. Chem. Soc., 135, 9952–9967 (2013).
- 3) Wu H., Dong Z., Li H., Khan M., Org. Process Res. Dev., 19, 89–101 (2015).
- 4) Bauer J., Spanton S., Henry R., Quick J., Dziki W., Porter W., Morris J., Pharm. Res., 18, 859–866 (2001).
- 5) Blagden N., de Matas M., Gavan P. T., York P., Adv. Drug Deliv. Rev., 59, 617–630 (2007).
- 6) Haleblian J., McCrone W., J. Pharm. Sci., 58, 911–929 (1969).
- 7) Censi R., Di Martino P., Molecules, 20, 18759–18776 (2015).
- 8) Simon L. L., Pataki H., Marosi G., et al., Org. Process Res. Dev., 19, 3–62 (2015).
- 9) Shastri A., Dhumal K., Patil A., Sawant D., Hatolkar S., J. ReAttach Ther. Dev. Divers., 6, 1963–1973 (2023).
- 10) Fevotte G., Calas J., Puel F., Hoff C., Int. J. Pharm., 273, 159–169 (2004).
- 11) Grön H., Borissova A., Roberts K., J. Ind. Eng. Chem. Res., 42, 198–206 (2003).
- 12) Liotta V., Sabesan V., Org. Process Res. Dev., 8, 488–494 (2004).
- 13) Févotte G., Chem. Eng. Res. Des., 85, 906–920 (2007).
- 14) Schaefer C., Lecomte C., Clicq D., Merschaert A., Norrant E., Fotiadu F., J. Pharm. Biomed. Anal., 83, 194–201 (2013).
- 15) Chang C.-F., Wang S.-C., Shigeto S., J. Phys. Chem. C Nanomater. Interfaces, 118, 2702–2709 (2014).
- 16) Hisada H., Okayama A., Hoshino T., Carriere J., Koide T., Yamamoto Y., Fukami T., Chem. Pharm. Bull., 68, 155–160 (2020).
- 17) Remoto P. J. G. III, Bērziņš K., Fraser-Miller S. J., Korter T. M., Rades T., Rantanen J., Gordon K. C., Pharmaceutics, 15, 1526 (2023).
- 18) Suzuki N., Fukui K., Otaka K., Suzuki T., Fukami T., Chem. Pharm. Bull., 69, 877–885 (2021).
- 19) O’Brien L. E., Timmins P., Williams A. C., York P., J. Pharm. Biomed. Anal., 36, 335–340 (2004).
- 20) Rácz A., Bajusz D., Héberger K., SAR QSAR Environ. Res., 29, 661–674 (2018).
- 21) Rinnan Å., van den Berg F., Engelsen S. B., Trends Analyt. Chem., 28, 1201–1222 (2009).
- 22) Tian F., Zeitler J. A., Strachan C. J., Saville D. J., Gordon K. C., Rades T., J. Pharm. Biomed. Anal., 40, 271–280 (2006).
- 23) Farias M., Carneiro R., Molecules, 19, 14128–14138 (2014).