Abstract
The purpose of this study was to investigate the effect of the interaction between hydrophilic drugs and acrylic polymers in the adhesive layer of matrix-type patches on skin permeability. Loxoprofen is a nonsteroidal anti-inflammatory drug which has poor permeability. To improve that, patches were prepared using loxoprofen sodium hydrate (LP-Na) as the active pharmaceutical ingredient and acrylic polymers with four different functional groups with different molecular weights. In addition, to enhance the permeability of the patches, we add the lactic acid (LA) as an additive. The crystalline state of the patches was examined by polarizing microscopy and powder X-ray diffraction. The interaction between LP-Na and acrylic polymers was also evaluated using 1H-NMR. The drug release rate and in vitro skin permeation from the patches were evaluated by dissolution apparatus (paddle method) and Franz diffusion cell, respectively. In patches using acrylic polymers with carboxy groups (AO), the skin permeation test suggested that the LP-Na_AO patch system showed 2.5 times better permeability compared with other patches. Interestingly, addition of LA (LP-Na_AO + LA) also improved 1.5 times more diffusion rate than LP-Na_AO patch and other systems. The interaction of LP-Na with acrylic polymers and LA as pH modifier would enhance the permeability of LP from matrix-type adhesive patches.
Introduction
Oral administration is one of the most preferred administration routes because of high patient compliance and ease of administration.1) However, orally administered drugs are absorbed from the gastrointestinal tract, pass through the liver before entering the circulating bloodstream and being transported to the affected area, and undergo first-pass effects metabolized by liver metabolic enzymes. Furthermore, among oral drugs, non-steroidal anti-inflammatory drugs (NSAIDs) have been associated with side effects such as gastrointestinal and renal disorders due to their mechanism of action.2) Therefore, transdermal drug delivery systems (TDDS) are attracting attention as a route of administration that avoids side effects and first-pass effects in the liver.3,4) This route of drug administration improves patient compliance by maintaining a uniform plasma concentration and reducing the frequency of administration.5,6)
Among TDDS, the patches are the most convenient formulation in terms of productivity, cost of manufacturing, and ease of application.7) The Patches are classified into two types: reservoir type and matrix type. In particular, the matrix type is the simplest and most used design, consisting only of the active ingredient, additives, pressure-sensitive adhesive (PSA), backing film, and release liner.8,9) Currently, there are four types of PSA used in TDDS: polyisobutylene, silicone, acrylate, and styrene-isoprene-styrene block copolymer.10) Especially, acrylic polymers are known for their good compatibility with a wide range of drugs and excipients. They also allow for easy adjustment of polymer properties. In addition, they are highly resistant to oxidation and do not require the addition of stabilizers that can cause skin irritation because of saturated hydrocarbon polymers. These have various advantages of adhesive polymers, such as eliminating the need for tackifiers and plasticizers to provide tack and softness.11) However, crystallization of drugs and additives can easily occur in matrix-type patches and is a major product quality issue because it can reduce skin permeability and adhesion to the skin.12,13) The patches are usually produced using a solvent evaporation method. During this process, the drug concentration increases with solvent evaporation and easily reaches supersaturation.14) This condition is thermodynamically unstable, and the drug frequently recrystallizes during storage.15) In order to inhibit recrystallization and increase penetration of drug, some additives are commonly used in patches. In other words, the design of a patch requires consideration of various factors such as the crystal state of the drug in the patch, the action of the drug and additives on the skin, and the physicochemical and chemical interaction between the drug and additives.10,16)
We have revealed the interaction between PSA and felbinac in patches and reported on the formulation design of matrix-type patches with excellent drug release and skin permeability.17) Loxoprofen sodium hydrate (LP-Na) with the similar property to felbinac, is a commercially available drug product and an active pharmaceutical ingredient of salt form with sodium cation. Therefore, LP-Na was used to compare drug skin permeation and intermolecular interaction with PSA. In this study, we revealed the interaction of four acrylic polymers with different functional groups and LP-Na, as well as pharmaceutical properties of the patch, in order to develop a patch using LP-Na, which is a salt-type hydrophilic drug.
Experimental
MaterialsLP-Na hydrate was provided from Hamari Chemicals, Ltd. (Osaka, Japan). Loxoprofen (LP-F) as the free-form was purchased from Tokyo Chemical Industry Co., Ltd. (Tokyo, Japan). Lactic acid (LA) as an additive was purchased from Tokyo Chemical Industry Co., Ltd. These chemical structures are shown in Fig. 1. The anhydrous obtained by heating LP-Na at 120 °C. Four types of acrylic polymers, which conform the specifications of the Japanese Pharmaceutical Excipients 2018, were provided by Daido Chemical Corporation (Osaka, Japan). The AO polymer has carboxyl groups, the AV1 and AV2 polymers have five-membered lactam structures, and the E polymer has ester groups (Table 1). 3 M ScotchpakTM 1022 Release Liner Misc Size and 3 M ScotchpakTM 9732 Spak 2.05 Mil Heat Sealable Polyester Liner were provided by 3 M Japan Limited (Tokyo, Japan) for preparing the release liner and support liner of the patches.
Table 1. Chemical Structures and Physicochemical Properties of the Acrylic Polymers
Ten milligrams per milliliter of LP-Na or LP-F was dissolved in ethanol. This ethanol solution was added to each polymer to achieve 2% (w/w) concentration of LP-Na or LP-F for each polymer to prepare the mixed solution. In a test to evaluate the effect of LA, 1% (w/w) of LA to the polymers was added to the patches containing LP-Na. Table 2 shows the composition of the three patches. Solvent was volatilized from the mixed solution to obtain an appropriate viscosity, and was then spread with a film applicator MULTICATOR 441 (manufactured by ERICHSEN) on a release liner at a thickness of 1.0 mm. After drying at room temperature for 1 d, the solvent was further removed by drying at 40 °C for 20 min, 50 °C for 50 min, 60 °C for 1.5 h, and 70 °C for 3 h. Finally, the patches were prepared by transferring them to a film. The patches were used as the test formulation to evaluate each pharmaceutical properties within one week after preparation.18)
Table 2. Composition of Three Patches Containing Drugs
| Ingredient (% (w/w); to polymer) | Test formulations |
|---|
| LP-Na | LP-Na + LA | LP-F |
|---|
| LP-Na | 2.0 | 2.0 | — |
| LP-F | — | — | 2.0 |
| LA | — | 1.0 | — |
Crystal state in the patches after 1, 7, and 14 d of preparation were observed using a polarizing microscope (Raman Workstation, Kaiser Optical Systems, Inc., MI, U.S.A.) when the patches were stored in a incubator at 25 °C. Observations were conducted at ×10 and ×25 magnifications. The prepared patch was heated using a large specimen cooling and heating stage for microscopy (Japan High Tech Co., Ltd., Fukuoka, Japan) and observed by polarizing microscope as well. The temperature was increased at a rate of 10 °C/min and a holding time of 1 min was ensured.
Powder X-Ray Diffraction (PXRD)The PXRD of the LP-Na was measured using Miniflex 600 (Rigaku Corporation, Tokyo, Japan) to investigate the presence state of the LP-Na in the acrylic polymers. The measurement conditions were X-ray source: Cu Kα (λ = 1.54186 Å), voltage current: 40 kV 15 mA, incident mirror: convergens mirror, scan axis: 2θ, angle range: 5.0–35.0°, scanning speed: 20.0°/min, and speed step: 0.02°.
Determination of the LP-Na Content of the Test FormulationThe patches were punched out in a circle of 12 mm in diameter, placed in a screw tube, and 5 mL of ethyl acetate and methanol solution (1 : 1) was added. The tube was stirred at 600 rpm overnight, and the amount of the LP-Na dissolved in the solution was determined by ultraviolet absorbance (UV mini manufactured by Shimadzu Corporation, Kyoto, Japan) at 265 nm. The total amount of LP-Na in the test formulation used in each study was calculated by the area ratio of the samples used.
Drug Release TestDrug Release Test by Paddle over Disk MethodThis study was conducted by the paddle-over disk method in the 18th edition of the Japanese Pharmacopoeia. A six-disc dissolution tester, DT126 light (ERWEKA GmbH, Langen, Germany) was used as the testing machine. The patches containing 2% (w/w) of the model drug were applied to a 41 mm in diameter paddle-over disc (Toyama Sangyo Co., Ltd., Osaka, Japan) and the support liner were covered with paraffin (Nacalai Tesque, Inc., Kyoto, Japan). The test disc was submerged in the bottom of a vessel, and the amount of model drug released into the dissolution test solution at 100 rpm 32 °C by HPLC. Four hundred milliliters of the Japanese Pharmacopoeia dissolution test solution 2 used as a dissolution test solution. 10 mL of the test solution were collected at 15, 30, 45, 60, 90, and 120 min, and the same amount of dissolution test solution was replenished.
Determination of Model Drug by HPLCThe concentration of LP-Na was measured by Agilent 1100 series (Agilent Technologies Japan, Ltd.). The column was Inertsil®ODS-3 (4.6 mm I.D. × 150 mm, GL Sciences Inc., Tokyo, Japan) and was maintained at 40 °C. Methanol/distilled water/acetic acid/triethylamine (600 : 400 : 1 : 1) was used as the mobile phase for model drugs and used after degassing. Flow rate was set to 0.8 mL/min. The injection volume was 10 µL. The wavelength of the UV detector was 222 nm. The chromatographic data processing program was μ7 (SYSTEM INSTRUMENTS Co., Ltd., Tokyo, Japan).
Data AnalysisLP-Na and LP-F were dissolved in 100 mL of methanol (FUJIFILM Wako Pure Chemical Corporation Corp., Osaka, Japan) to prepare a 1000 µg/mL solution. This solution was further diluted with methanol to prepare standard solutions of 100, 50, 10, 1, and 0.1 µg/mL. These standard solutions were measured under the HPLC conditions described above, and a calibration curve was constructed from the peak areas. The slope was Δy/Δx.
The drug release concentration of the model drug released at each time point (C(DT)t, mg/mL) was calculated from the peak area of the sample solution at each time point (S(DT)t) using the calibration curve equation Eq. (1) for each model drug.
 | (1) |
The cumulative drug release (W(DT)t mg) at each time point was calculated from Eq. (2).
 | (2) |
The dissolution test solution volume and sampling volume were 400 and 10 mL, respectively. The cumulative dissolution test solution rate (Dt, %) at each time point was calculated from Eq. (3).
 | (3) |
EDT is the total model drug content (mg) of each test patch on the paddle-over disk.
In Vitro Skin Permeation TestIn Vitro Skin Permeation by Franz-type Diffusion CellThis study was conducted in accordance with the vertical diffusion cell method in the 18th edition of the Japanese Pharmacopoeia. The hairless mouse skin (Labo Skin Hos: HR-1, Hoshino Laboratory Animals, Inc., Ibaraki, Japan) was set in a Franz-type diffusion cell (effective diffusion area = 1.77 cm2). The patches were punched out into a circle of 12 mm in diameter, and the circular cutouts were attached to the skin of hairless mice to evaluate skin permeation. The temperature of the receptor solution was set to 32 °C. The Japanese Pharmacopoeia dissolution test solution 2 was used as the receptor solution. The receptor solution in the Franz-type diffusion cell was stirred using a stirrer bar at 600 rpm. 0.4 mL of receptor solution was collected at 0.5, 1, 2, 4, 5, 6, 7, 8, and 24 h and the same amount of dissolution test solution was replenished. The concentration of model drug in dissolution test solution was determined by HPLC at the condition of “Determination of Model Drug by HPLC.”
Data AnalysisThe concentration of the model drug permeated through the skin at each time (C(ST)t, mg/mL) was calculated from the peak area of the dissolution solution at each time point (S(ST)t) using the calibration curve Eq. (4) for each model drug.
 | (4) |
The cumulative skin permeation (W(ST)t mg) at each time point was calculated from Eq. (5).
 | (5) |
The receiver and sampling volumes of the Franz-type diffusion cell were 7 and 0.4 mL, respectively. The cumulative skin permeation rate (Dt, %) at each time point was calculated from Eq. (6).
 | (6) |
EST is the total model drug content (µg) of each test patch.
1H-NMR1H-NMR was used to evaluate the molecular interactions between the model drug and the acrylic polymers. 2 mg of model drug and 2, 4, 10, and 20 mg of each polymer were weighted in a screw tube and dissolving them in 1.5 mL of Chloroform-D (Nacalai Tesque, Inc.) and 40 µL of Dimethyl Sulfoxide-D6 (Nacalai Tesque, Inc.). For the LA-added samples, placebos were prepared and used for each polymer with 1% (w/w) LA added relative to the polymer weight. For the LP-F samples, 2 mg of the model drug and 10, 20, and 40 mg of each polymer were weighed in a screw tube and dissolved in 1.5 mL of Chloroform-D for measurement. Interactions were evaluated by comparing the spectral data of the model drug with the model drug/polymer mixture samples and by chemical shift transitions of specific peaks.
Results and Discussion
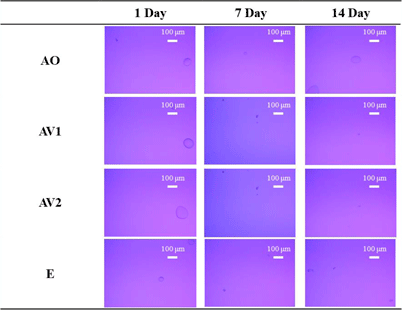
Evaluation of Crystal State in the PatchesTo investigate the effect of drug-substrate interactions in the adhesive layer on the pharmaceutical properties, test patches containing four acrylic polymers with different functional groups and molecular weights as bases, LP-Na and LP-F as model drugs and LA as an additive were prepared respectively. These patches were stored at 25 °C and the crystal status of model drugs in the adhesive layer was observed with a polarizing microscope after 1, 7, and 14 d of preparation. These results are shown in Fig. 2. In LP-Na patch, precipitates were observed in all three polymers except for AO from 1 d after preparation. These precipitates disappeared after 7 d of preparation and did not reappear after 14 d. On the other hand, no precipitates were observed in AO from 1 to 14 d after preparation. In addition, no precipitates were observed in all LA and LP-F patches even after 14 d of preparation (Figs. 3, 4). LP-Na has log P = − 0.19 and LP-F has log P = 1.87.19,20) LP-Na is a compound in which the hydrogen ion of the carboxy group of LP-F is replaced by a sodium ion. It is considered that the hydrophobic interaction of LP-Na with the polymer is lower than LP-F due to its hydrophilicity, and precipitates were observed because of its lower affinity with the polymer. In the AO patch containing LP-Na, the AO polymer with carboxyl group played a role like that of a weakly acidic ion exchange resin, and desalination of LP-Na was considered. LA, an oxyacid and, was also thought to cause desalination and free-form formation of LP-Na. Therefore, it was considered that the affinity of the LP-Na with the acrylic polymer increased due to increasing free form of LP in the patch containing LP-Na with AO polymer and the LA patches, and that crystals were not precipitated.
Figure 5 shows the results of heating the patch containing LP-Na after the precipitates disappeared in the hot stage. In the AO patch, no precipitates were observed from 25 to 210 °C. On the other hand, when the AV1 patch was heated, small granular precipitates were observed from 90 to 130 °C. Above 140 °C, these precipitates became needle-shape and disappeared at around 200 °C, the melting point of LP-Na.19) In order to identify the precipitates observed before and after heating in the AV1 patch, the patches were measured by PXRD. Figure 6 shows the results of the measurement of the patch after the precipitates disappeared and the patch heated at 70 °C for 3 h. In the AO patch, there was no change in the diffraction pattern before and after heating (Fig. 6(a)). On the other hand, a halo pattern was observed before heating, whereas there were diffraction peaks at 5.7, 17.5 and 23.4° at the heated AV1 patch (Fig. 6(b)). These diffraction peaks consisted of LP-Na anhydride. The precipitates observed in AV1 patch after heating were thought to be LP-Na anhydrous. In addition, the precipitates in AV1 patch 1 d after preparation would also be LP-Na anhydride because the process of heating with a hot plate is used to remove the solvent during the preparation of the patch. The precipitates observed after preparation disappeared after 7 d of preparation and did not reappear after 14 d (Fig. 2). The AV1 patch was found to increase in weight after 7 d of storage at 25 °C (data not shown). Moreover, the precipitates of LP-Na anhydrous were observed again upon heating from 90 to 130 °C, suggesting that the polymer itself has a slight hygroscopic property. It was considered that the precipitates of LP-Na disappeared over time because the hydrophilic LP-Na interacts with the water absorbed by the polymer.
Evaluation of Pharmaceutical Properties in PatchesTable 3 shows the determined amount of model drugs in the patches used in each test of pharmaceutical properties. The test patches using AO and AV2 tended to have high drug content, while those using AV1 tended to have low drug content. Although the thickness of the adhesive layer was set to 1.0 mm and spread uniformly during the preparation of the patch, the high viscosity polymers such as AO and AV2 caused slight differences in the thickness of the adhesive layer, which may have resulted in the differences in drug content.
Table 3. The Amount of Model Drug in the Patches
| AO | AV1 | AV2 | E |
|---|
| LP-Na | 470.0 ± 78.4 | 399.7 ± 47.1 | 586.3 ± 52.6 | 513.9 ± 112.5 |
| LP-Na + LA | 315.0 ± 93.3 | 293.6 ± 95.3 | 359.8 ± 88.2 | 480.9 ± 94.8 |
| LP-F | 622.6 ± 35.5 | 332.4 ± 18.0 | 385.9 ± 18.1 | 538.4 ± 90.5 |
µg/cm2, n = 3, mean ± S.D.
The results of the drug release test of each patch are shown in Fig. 7 and Table 4. In the LP-Na patches, the three patches with LP-Na crystals tended to have a lower drug release rate after 120 min compared to AO patch, in which no precipitates were observed in the adhesive layer. Comparing AV1, AV2, and E polymers, the LA patches and LP-F patches and LP-Na patch showed higher drug release rates in that order. Even though the oil-water partition coefficient of LP-Na is smaller than that of LP-F, the release rate of LP-Na from the LP-Na patches was lower than that of LP-F from LP-F patches. In the three polymers except for AO in the LP-Na patches, LP-Na is difficult to dissolve and precipitates as crystals (Fig. 2). In the drug release test, the drug dissolved in the patch is evaluated by the process of transferring the drug from the patches to the dissolution test solution 2.21) It is thought that the drug release rate is lower due to low amounts of dissolved drugs in the AV1, AV2, and E patches.
Table 4. Drug Release Rate of Model Drugs from Patch after 120 min
| AO | AV1 | AV2 | E |
|---|
| LP-Na | 7.06 ± 1.10 | 1.54 ± 0.41 | 0.99 ± 0.15 | 1.35 ± 0.41 |
| LP-Na + LA | 14.69 ± 2.62 | 8.84 ± 1.36 | 5.43 ± 0.96 | 4.50 ± 1.80 |
| LP-F | 2.40 ± 0.54 | 3.00 ± 0.18 | 1.76 ± 0.61 | 1.66 ± 0.65 |
The results of the in vitro skin permeation test of each patch are shown in Fig. 8 and Table 5. In the patches containing LP-Na, the cumulative permeation rate per unit area after 24 h for each patch was higher in the order of AO, E, AV2, and AV1 respectively (Fig. 8(a)). LP-Na dissolved in only AO polymer completely (Fig. 2) suggested that high amount of dissolved LP-Na molecules in the polymer distributed to the skin and the skin permeation was increased.22) The three polymers that showed precipitates of LP-Na had low affinity between LP-Na and the polymers, and the release rate and skin permeability were suggested to be reduced because the dissolved drug amount in the patches was low. In the LA patches, the cumulative permeation rate per unit area after 24 h was higher in the order of AO, AV1, E, and AV2 (Fig. 8(b)). The cumulative permeation rate after 24 h in the LA patches was higher than that of LP-Na patches. This is thought to be due to the combination of LA and LP-Na which increased the free-form of LP-Na, and LA could also act as a penetration enhancer.23) In LP-F patches, the cumulative permeation rate per unit area at 24 h was higher in the order of AO, E, AV1, and AV2 (Fig. 8(c)). The LP-F patches showed higher skin permeability than the LA patches, except for AO. This result suggests that LP-Na did not become free-form completely by 1% (w/w) of LA to the polymer weight. On the other hand, LP-Na became the free-form in AO polymer with carboxylic groups even in the absence of LA. Therefore, it was inferred that the cumulative permeation rate of LP-Na from the LA patch of AO polymer was higher than that without LA. Loxoprofen sodium hydrate (LP-Na) with the similar property to felbinac, is a commercially available drug product and an active pharmaceutical ingredient of salt form with sodium cation. Therefore, LP-Na was used to compare drug skin permeation and intermolecular interaction with PSA.
Table 5. Skin Permeation Rate of Model Drug from Each Patch after 24 h
| AO | AV1 | AV2 | E |
|---|
| LP-Na | 14.90 ± 8.38 | 0.40 ± 0.18 | 0.38 ± 0.11 | 0.85 ± 0.69 |
| LP-Na + LA | 17.25 ± 0.62 | 2.83 ± 1.29 | 1.46 ± 0.35 | 2.37 ± 0.59 |
| LP-F | 8.96 ± 0.44 | 3.31 ± 1.55 | 1.09 ± 0.28 | 5.65 ± 3.25 |
The interaction between the model drug and the polymers was evaluated using 1H-NMR, since the affinity differences between the model drug and the polymers were considered to be involved in the drug release and skin permeability properties. 1H-NMR spectral data using the chemical shift values perturbation method with increasing amounts of polymer to the LP-Na are shown in Fig. 9. The α-carbon protons of LP-Na (3.342, 3.360, 3.379 and 3.394 ppm) showed a low magnetic field shift as the ratio of AO increased (Fig. 9(a)). The chemical shift of the α-carbon in LP-Na after adding 20 mg of AO was the same as that of LP-F alone, suggesting that LP-Na is free-form in the AO patch. This result suggests that the carboxy group of AO polymer provides protons to LP-Na and approaches the free-form of LP. On the other hand, AV1 did not show any change in chemical shift values with increasing amounts (Fig. 9(b)). LP-Na and AV1 did not interact in the patch and the LP-Na is difficult to dissolve in the adhesive layer of the AV1 patch, suggesting the crystal precipitates in the patch.
Next, the change in chemical shift values of the protons on the α-carbon of LP-Na by the addition of polymers containing 1% (w/w) of LA to the polymer are shown in Fig. 10. In AO, a peak shift to a lower magnetic field was observed with increasing polymer content as in the case of no LA. The same change in chemical shift values of LP-Na was observed after adding 20 mg of AO as that of LP-F alone (Fig. 10(a)). A low magnetic field shift was also observed in AV1 with increasing polymer addition (Fig. 10(b)). In addition, the same experiment was performed in AV1 polymer with 5% (w/w) of LA added relative to the polymer weight, and the results showed an even larger shift compared to the 1% (w/w) system (Fig. 10(c)). The chemical shift of the proton on the α-carbon of LP-Na was +0.300 ppm for AO, +0.089 ppm for AV1 of 1% (w/w) LA-added system and +0.299 ppm for AV1 of 5% (w/w) LA-added system when 20 mg of each polymer was added. Whereas no change in chemical shift values was observed when no LA was added in AV1, the addition of LA was assumed to cause a free-form of LP-Na.
The above results suggest that LP-Na exists in two molecular-types in the adhesive layer (Fig. 11(a)). In the presence of AO polymer with carboxylic groups or LA, LP-Na could exist in a molecular state similar to that of LP-F. The drug was released in a salt form that is easily dissolved in the dissolution test solution 2 in the drug release test (Fig. 11(b)) and permeated through the skin in a free-form that is easily distributed to the skin and highly hydrophobic in the in vitro skin permeation test (Fig. 11(c)), suggesting an equilibrium state-like change. Therefore, the LA patches had higher drug release rate and skin permeability than the LP-Na patches, and the drug release rate was higher than that of the LP-F patches.
The interaction between LP-F and each polymer was similarly evaluated by 1H-NMR. The change in chemical shift of the proton on the α-carbon of LP-F with polymer addition is shown in Fig. 12. For all polymers, the proton on the α-carbon (3.717 ppm) of LP-F shifted to a higher magnetic field with increasing polymer amounts. At a polymer amount of 40 mg, the change in chemical shift values of AO and AV1 were −0.007 and −0.025 ppm, respectively. AV1 has N-vinyl-2-pyrrolidone (NVP) in the monomer structure of the polymer, the chemical shift values were found to be about three times larger than that of AO. In a previous study, a high magnetic field shift of protons on α-carbons was observed when phenylacetic acid-based felbinac was used as a model drug and its interaction with polymers was evaluated.17) In this study, the high magnetic field shift of the proton on the α-carbon of LP-F was suggested to be caused by a similar mechanism. First, LP-F would form a dimer by the association of carboxy groups in solution (Fig. 13(a)). However, when LP-F coexists with acrylic polymers, the dimer formation, the stable structure of LP-F, was inferred to be inhibited by the interaction with substituents of each polymer (Figs. 13(b), (c)). Therefore, the change in chemical shift values was small. AO has a carboxylic group as a functional group and would form the same interaction as LP-F dimer formation. On the other hand, NVP in AV1 induced protonation of the carboxy group of the LP-F molecule, which was thought to cause a high shielding effect due to the localization of electrons and the electron cloud of NVP protons approaching the protons on the α-carbon. Therefore, it was inferred that the high magnetic field shift was larger than that of AO.
Conclusion
This study revealed that the crystal state and pharmaceutical properties of the model drugs in the formulation can be controlled by the interaction of a functional group of acrylic polymers with the LP-Na. The presence of the model drugs in the adhesive layer of the patches was suggested to vary depending on the affinity between the model drugs and the acrylic polymers. We found that the model drug could not dissolve in the acrylic polymers due to low affinity between the model drugs and the polymer, suggesting that the drug was difficult to be distributed from the patch to dissolution solution or skin. In LP-Na patch, the use of acrylic polymers and additives that promote desalting and free-forming of LP-Na would be effective to improve drug release and skin permeability. The stronger interaction between the free-form of LP-Na and the polymer, the lower the drug release and skin permeability. These results suggest that the addition of additives such as organic acids could be effective in the formulation design of salt type model drugs, while paying attention to the dissociation response in the formulation.
Acknowledgments
We would like to thank Daido Chemical Corporation for donating acrylic polymers, 3 M Japan Limited for donating Release Liner.
Conflict of Interest
This study was funded by Daido Chemical Corporation.
References
- 1) Xu Y., Shrestha N., Preat V., Beloqui A., J. Control. Release, 322, 486–506 (2020).
- 2) Sharratt C. L., Norman A. J., Hawkey C. J., Medicine (Abingdon), 43, 223–229 (2015).
- 3) Subedi R. K., Oh S. Y., Chun M., Choi H., Arch. Pharm. Res., 33, 339–351 (2010).
- 4) Bajaj S., Whiteman A., Brandner B., BJA Educ., 11, 39–43 (2011).
- 5) Ananda P. W. R., Elim D., Zaman H. S., Muslimin W., Tunggeng M. G. R., Permana A. D., Int. J. Pharm., 609, 121204 (2021).
- 6) Zhang Y., Cun D., Kong X., Fang L., Asian J. Pharm. Sci., 9, 251–259 (2014).
- 7) Parhi R., Padilam S., Bull. Fac. Pharm. Cairo Univ., 56, 26–33 (2018).
- 8) Nishida N., Taniyama K., Sawabe T., Manome Y., Int. J. Pharm., 402, 103–109 (2018).
- 9) Banerjee S., Chattopadhyay P., Ghosh A., Datta P., Veer V., Int. J. Adhes. Adhes., 50, 70–84 (2014).
- 10) Ding D., Liu C., Zhang Y., Xu W., Cai Y., Zhong T., Fang L., Int. J. Pharm., 630, 122416 (2023).
- 11) Hock S. T., Pfister W. R., Pharm. Sci. Technol. Today, 2, 60–69 (1999).
- 12) Miyagawa D., Mamiya A., Ichinose G., J. Theor. Biol., 549, 111211 (2022).
- 13) Ma X., Taw J., Chiang C. M., Int. J. Pharm., 142, 115–119 (1996).
- 14) Oh D. W., Chon J., Na M. J., Kang J. H., Park E. S., Rhee Y. S., Kim J. Y., Shin D. H., Kim D. W., Park C. W., J. Drug Deliv. Sci. Technol., 53, 101193 (2019).
- 15) Pattnaik S., Swain K., Mallick S., Lin Z., Int. J. Pharm., 406, 106–110 (2011).
- 16) Morimoto Y., Kokubo T., Sugibayashi K., J. Control. Release, 18, 113–122 (1992).
- 17) Gato K., Fujii M. Y., Hisada H., Carriere J., Koide T., Fukami T., J. Drug Deliv. Sci. Technol., 58, 101800 (2020).
- 18) Furuishi T., Io T., Fukami T., Suzuki T., Tomono K., Biol. Pharm. Bull., 31, 1439–1443 (2008).
- 19) Kang J., Li X., Liang K., Qi P., Hu X., Li C., Yang R., Wang Q., J. Drug Deliv. Sci. Technol., 88, 104946 (2023).
- 20) Yang D., Liu C., Ding D., Quan P., Fang L., Int. J. Pharm., 602, 120560 (2021).
- 21) Sugino M., Mikami M., Ishihara T., Hosoya O., Juni K., Yakugaku Zasshi, 135, 977–985 (2015).
- 22) Sugibayashi K., Oleoscience, 17, 549–558 (2017).
- 23) Sebastiani P., Nicoli S., Santi P., Int. J. Pharm., 292, 119–126 (2005).