Abstract
In sulfuric acid (H2SO4) aqueous solutions containing manganese (Mn) and titanium (Ti) ions, which are used for the positive electrolyte in redox flow (RF) batteries, the addition of a small quantity of bismuth (Bi) has been found to be very effective in suppressing the MnO2 precipitation in the charging process from Mn2+ to Mn3+. The effect of the addition of Bi on the structural change in these solutions has been analyzed using x-ray absorption fine structure (XAFS) techniques. X-ray absorption near edge structure (XANES) spectra indicated that some Mn4+ ions were generated only when Bi was not added. It was also confirmed that the Mn-O octahedral coordination was maintained at a high state of charge (SOC). On the other hand, no change was observed in the valence of Ti and Bi ions even at high SOCs. Extended x-ray absorption fine structure (EXAFS) measurements combined with fitting analysis clarified that the addition of Bi resulted in the generation of Mn-O-Bi coordination at the SOCs of 70 and 90 %. Bi-O-Mn coordination may suppress the MnO2 precipitation at a high SOC.
1. Introduction
Renewable wind and solar energy is regarded as indispensable in a future low-carbon society. As their electric power supply is not steady, it is necessary to convert the fluctuating output power to chemical energy before connecting them to existing power grids. For this purpose, various kinds of redox flow (RF) batteries have been proposed, to be used as a large capacity secondary batteries.1–6
For instance, redox couples based on vanadium (V) in a sulfuric acid (H2SO4) aqueous solution, in which the voltage difference between half-cell reactions (V2+/V3+ and V4+/V5+) is 1.4 V, are already in the practical stage. Titanium (Ti) and manganese (Mn) are also promising candidates as the active materials in the negative and positive electrolytes, respectively, since the voltage difference between half-cell reactions of Ti3+/Ti4+ and Mn2+/Mn3+ is almost the same as that of the V system.7 A Ti-Mn RF battery is expected to realize lower cost than that of a V system.
However, it is well known that Mn ions in the positive electrolyte are not sufficiently stable, especially when the state of charge (SOC) is relatively high. The increased Mn3+ ions tend to react with H2O molecules, which results in the precipitation of MnO2 (2Mn3+ + 2H2O ↔ Mn2+ + MnO2 + 4H+). In the previous reports, we have demonstrated that adding Ti4+ ions in the positive electrolyte is very useful to reduce MnO2 precipitation and that Ti-SO4 bonds generated in the H2SO4 aqueous solutions promoted the H+ dissociation from HSO4−.8–10 It was considered that increased H+ concentration suppressed MnO2 precipitation.
In the search for additive elements other than Ti, bismuth (Bi) has been found to be very effective in suppressing MnO2 precipitation. Regarding the mechanism, the coordination structures around Mn and/or Ti ions in the electrolyte are thought to be the key factor. In this study, several H2SO4 aqueous solutions with different SOCs containing Mn, Ti and/or Bi were analyzed, using x-ray absorption fine structure (XAFS) techniques. From the x-ray absorption near edge structure (XANES) spectra, the valences of the target ions were presumed. The extended x-ray absorption fine structure (EXAFS) measurements combined with fitting analyses were also carried out to obtain the coordination numbers and bonding distances of each element. From these results, changes in the structure of solutions caused by the addition of Bi are discussed.
2. Experiments
The electrolyte solution samples containing H2SO4 to be measured are listed in Table 1. The concentrations of MnSO4, TiOSO4, and H2SO4 were 1.0, 1.0, and 5.0 mol/dm3, respectively. Only for sample #A, 0.1 mol/dm3 of BiSO4 was added. The formal ionic valences of the cations were Mn2+, Ti4+ and Bi3+. Then, the solutions went through the charging process in a miniature cell, in order to vary the SOC up to 90 %. Here, the SOC is theoretically defined based on the following one-electron reaction: Mn2+ = Mn3+ + e−. In the case of sample #A at any SOC, no MnO2 precipitation was found 24 hours after the charging process. On the other hand, a little MnO2 precipitation was confirmed in sample #B (no Bi added), at an SOC of 90 %. Besides the solution samples, tablets of boron nitride containing small quantities of KMnO4, Bi2O3, BiSO4, and Bi metal were also prepared as references.
Table 1. Electrolyte solution samples containing H
2SO
4 to be measured.
| Sample |
SOC (%) |
MnO2 precipitation after 24 hours |
| #A (with Bi) |
0, 30, 50, 70, 90 |
non |
| #B (no Bi) |
0, 30, 50, 70, 90 |
a little at SOC of 90 % |
The XAFS measurements for Mn and Ti were carried out at BL11 of SAGA Light Source (SAGA-LS) in Kyushu Synchrotron Light Research Center, Japan. Those for Bi were performed at BL16B2 of SPring-8, Japan. Each solution sample was sealed in a polyethylene bag with polycrystalline diamond windows and the optical path length was optimized for the target elements using a spacer, as described in the previous paper.10 The x-ray energies near the absorption edges were 6.55, 4.98, 13.5 keV for Mn K-edge, Ti K-edge, Bi L3-edge, respectively. At the both beamlines, the incident x-ray was monochromated by a Si 111 double crystal and the higher harmonics were cut by rhodium (Rh) coated bend cylindrical mirrors. XAFS spectra were measured in transmission mode at room temperature, with ionization chambers monitoring the incident and transmitted x-ray intensities. The cumulative times were 180 s for Mn and Bi and 300 s for Ti.
The obtained XAFS spectra were normalized and Fourier transformed into radial structure functions (RSFs), using Demeter analysis software.11 In the fitting analysis for the RSFs to calculate coordination numbers and distances, scattering factors by FEFF8 were employed.12
3. Results
3.1 Mn
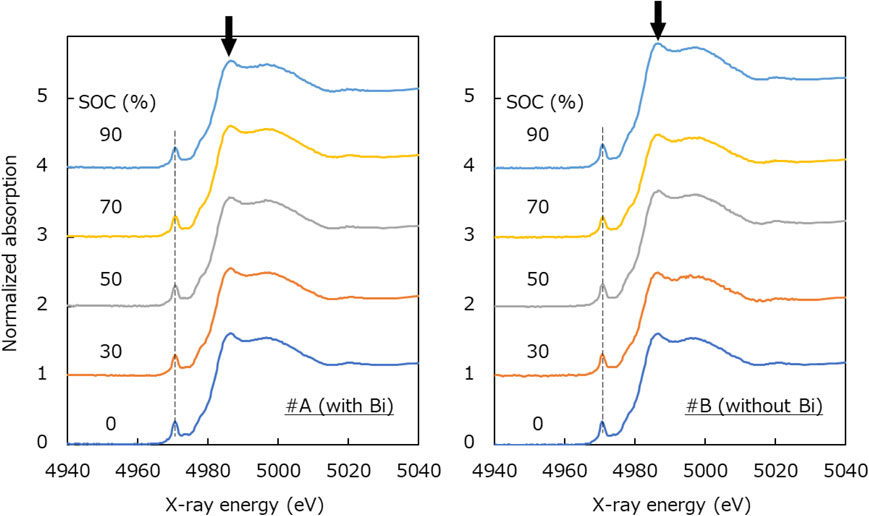
Figure 1 shows the Mn K-edge XANES spectra of the solution samples. As for sample #A, the absorption edge was found to shift toward higher energy at higher SOC. It was also confirmed that two isosbestic points common to all the SOCs existed. Regarding sample #B, almost the same trend was found as #A, though the lower isosbestic point became uncommon at an SOC of 90 %.

In Fig. 2, the XANES spectra of Mn metal, MnO, Mn2O3, and MnO2 standard samples are cited from SPring-8 BL14B2 XAFS database.13 Note that the x-ray energy in the horizontal axis has been corrected with reference to Tušar et al.14 As pointed by arrows in Fig. 2, the peak positions of MnO (Mn2+), Mn2O3 (Mn3+), and MnO2 (Mn4+) were confirmed to be 6553, 6558, and 6562 eV, respectively. Comparing these with the measurement results of sample #A in Fig. 1, the peak positions of SOCs 0 % and 90 % are close to those of Mn2+ and Mn3+, respectively, indicating that the valence of Mn ions changed from Mn2+ to Mn3+ by the charging process. On the other hand, in the case of sample #B, the peak position of SOCs 90 % was found to be similar to that of Mn4+. From these results, the addition of Bi was considered to suppress the generation of Mn4+ at an SOC of 90 %.
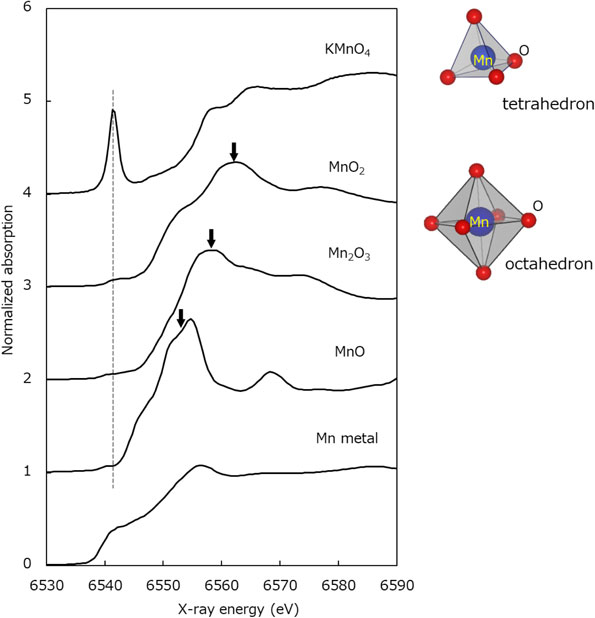
The XANES spectrum of the KMnO4 reference sample obtained in this study is also shown in Fig. 2. The peak at 6541 eV was found to be specifically prominent in KMnO4 compared with other Mn oxides, as indicated by the dashed line. This peak is associated with the electron transition from 1s orbital to 3d, which is forbidden in the case of octahedral symmetry like MnO2. However, it becomes allowable in a tetrahedron configuration, since the discrepancy of the O-Mn-O bonding angle from 90 degrees gets larger and hybrid orbitals between 3p and 3d are generated.15–19 These results demonstrate that the Mn ions in all the solution samples have 6 coordinating oxygen atoms in octahedral symmetry.
The RSFs of Mn obtained from the EXAFS measurements are shown in Fig. 3. As for sample #A at an SOC of 0 %, a large peak was confirmed at around 0.18 nm, which corresponds to the 1st nearest neighbors (NNs) of Mn-O. At SOCs of 70 and 90 %, another peak was observed at around 0.3 nm as the 2nd NNs, which are indicated as Mn-O-X in Fig. 3. These should be derived from a configuration different to that of MnO2 crystal, since no MnO2 precipitation had been found in sample #A, as shown in Table 1. As for sample #B, the 2nd NN peak was confirmed at 0.27 nm only at an SOC of 90 %, which should correspond to the MnO2 precipitation.
3.2 Ti
Figure 4 shows the Ti K-edge XANES spectra of the solution samples. No significant difference was found between the samples with different SOCs, either in samples #A or #B. The pre-edge peak around 4971 eV, which was found in all the solutions, indicated that the Ti ions in the solutions were thought to be in 6 coordination.20,21
The XANES spectra of Ti metal, Ti2O3, TiO2 (anatase) and TiO2 (rutile) standard samples, which were also cited from SPring-8 BL14B2 XAFS database, are shown in Fig. 5.13 Here, the x-ray energy in the horizontal axis has been corrected so that the pre-edge peak position should correspond to the one reported by Farges et al.20 Comparing with Fig. 4, the absorption edges of all the solution samples were close to that of TiO2 (anatase and rutile). From these results, the valence of Ti ions in the solutions was considered to be Ti4+.
The RSFs of Ti obtained by the EXAFS measurements are shown in Fig. 6. In almost all the samples, besides the main peak at 0.18 nm, small peaks were observed at around 0.3 nm. Though these were similar to the 2nd NN peaks observed in the Mn RSFs, it was confirmed that these peaks disappeared by changing the upper limit of the wave number for Fourier transformation. Therefore, these peaks were regarded as ghost to be neglected.
3.3 Bi
The XANES spectra (left) and RSFs (right) obtained from the Bi L3–edge XAFS measurements for sample #A are summarized in Fig. 7. The results of three solid samples with different absorption edges (Bi metal, Bi2O3, BiSO4) were also indicated as reference. In the XANES spectra, very slight differences were found among the different SOCs and the absorption edges were confirmed to be 13440 eV. This is very close to that of BiSO4, indicating the similarity in the coordination structures.
Regarding the RSFs, small peaks of the 2nd NNs were observed at around 0.3 nm, only in the case of SOCs of 70 and 90 %. As described later, the 2nd NN ions were considered to be Mn and the distance between Bi and Mn ranged from 0.34 to 0.37 nm. Thought the coordination number of Mn to Bi was 2.9 at an SOC of 70 %, it was confirmed to have increased up to 4.9 at an SOC of 90 %.
4. Discussion
From the experimental results described above, the structural changes due to the charging process were considered to mainly involve Mn and Bi ions. To investigate the mechanism in detail, fitting analysis was performed for the EXAFS of Mn and Bi.
The first step was the fitting for the EXAFS of Mn, in which the atomic scattering factors obtained by FEFF were used. In this analysis, the Mn ions were assumed to be coordinated by six O ions, since the XANES data demonstrated that the Mn-O octahedron structure was maintained at all SOCs. The obtained Debye-Waller factors were used in the following second step or the simultaneous fitting for Mn and Bi ions while correlating with each other. From these analyses, the distances and coordination numbers were calculated for the 1st and 2nd NNs.
Table 2 summarizes the fitting results. Typical k2χ(k) data in the fitting analyses are shown in the supporting information. Regarding the 1st NN for Mn at the SOC of 0 %, all the coordinating O ions were placed at a distance around 0.22 nm from the Mn ions. At the higher SOCs, however, additional Mn-O bonding were found to increase approximately at 0.19 nm. Though this trend was common to samples #A and #B, the bonding at the shorter distance increased more in #A than in #B.
Table 2. Interatomic distances of 1st and 2nd nearest neighbors obtained from EXAFS analyses. Coordination numbers are indicated in brackets.
| Mn #A (with Bi) |
| SOC (%) |
1st NN |
2nd NN |
| 0 |
O: 0.216 nm (6.0) |
— |
| 30 |
O: 0.201 nm (1.3) |
— |
| O: 0.219 nm (4.7) |
| 50 |
O: 0.190 nm (1.5) |
— |
| O: 0.217 nm (4.5) |
| 70 |
O: 0.192 nm (2.7) |
Mn: 0.309 nm (0.7) |
| O: 0.220 nm (3.3) |
Mn: 0.334 nm (1.3) |
| Bi: 0.340 nm (0.2) |
| 90 |
O: 0.191 nm (3.2) |
Mn: 0.309 nm (1.5) |
| O: 0.222 nm (2.8) |
Mn: 0.332 nm (1.9) |
| Bi: 0.340 nm (0.7) |
| |
| Mn #B (without Bi) |
| SOC (%) |
1st NN |
2nd NN |
| 0 |
O: 0.217 nm (6.0) |
— |
| 30 |
O: 0.190 nm (1.0) |
— |
| O: 0.216 nm (5.0) |
| 50 |
O: 0.188 nm (1.5) |
— |
| O: 0.217 nm (4.5) |
| 70 |
O: 0.188 nm (1.9) |
— |
| O: 0.216 nm (4.1) |
| 90 |
O: 0.188 nm (4.2) |
— |
| O: 0.219 nm (1.8) |
| |
| Bi #A (with Bi) |
| SOC (%) |
1st NN |
2nd NN |
| 0 |
O: 0.235 nm (6.0) |
— |
| 30 |
O: 0.236 nm (6.0) |
— |
| 50 |
O: 0.235 nm (6.0) |
— |
| 70 |
O: 0.234 nm (6.0) |
Mn: 0.344 nm (2.2) |
| Mn: 0.365 nm (0.7) |
| 90 |
O: 0.226 nm (1.5) |
Mn: 0.336 nm (1.9) |
| O: 0.242 nm (4.5) |
Mn: 0.354 nm (3.0) |
On the other hand, the 2nd NNs were found at SOCs of 70 and 90 % in #A and two types of coordination, Mn-O-Mn and Mn-O-Bi, were confirmed. As for the former, two levels of Mn-Mn distance (0.31 and 0.33 nm) were found. In the case of the latter, the Mn-Bi distance was 0.34 nm. In both cases, the coordination numbers became larger as the SOC became higher. The 2nd NN found at an SOCs of 90 % in #B was considered to correspond to the MnO2 precipitation, in which the Mn-Mn distance and coordination number were 0.284 nm and 0.8, respectively.
Figure 8 illustrates the effect of the addition of Bi, which was suggested by the analyses described above. Basically, the Mn ions are in octahedral coordination and Bi ions share one O ion in the octahedron at high SOCs. One Bi ion has 2.9 to 4.9 coordinating Mn ions in average and the Mn-Bi distance was approximately 0.34 nm. Due to the structural change or the generation of Bi-O-Mn coordination in the solution may suppress the growth of MnO2 precipitation at high SOCs.
The Bi addition was also found to suppress the generation of Mn4+ ions at the SOC of 90 %, as indicated in Fig. 1. Though this effect is another possible reason of no MnO2 precipitation at high SOCs, further study is necessary to clarify the mechanism in detail.
5. Conclusion
Structural analyses have been performed for the H2SO4 aqueous solutions containing Mn, Ti, and/or Bi. The addition of a small quantity of Bi was found to be very effective in suppressing the MnO2 precipitation in the changing process from Mn2+ to Mn3+ in the positive electrolyte of a Ti-Mn based RF battery. The XANES measurements demonstrated that the valence of Mn ions changed from Mn2+ to Mn3+ at high SOCs and that some amount of Mn4+ ions were also generated only in the samples without Bi. It was also confirmed that the Mn-O octahedral coordination was maintained at higher SOCs. On the other hand, no change was observed in the valence of Ti and Bi ions at any SOC. In the EXAFS analyses combined with FEFF fitting, the generation of Mn-O-Bi was confirmed at the SOCs of 70 and 90 %, but with no significant change in Ti coordination. The generation of Bi-O-Mn coordination may suppress the MnO2 precipitation at high SOCs.
Acknowledgment
The authors would like to thank Japan Synchrotron Radiation Research Institute (JASRI) for the approval to perform the XAFS experiments at SPring-8 (Proposal No.: 2017A5330). They also wish to thank SAGA-LS for the approval for the XAFS experiments (Proposal No.: 1302160G, 1304032G, 1308081G, 1311136G). XAFS spectra of Mn and Ti standard samples are utilized by SPring-8 BL14B2 XAFS database.13
Data Availability Statement
CRediT Authorship Contribution Statement
Junji Iihara: Formal analysis (Lead)
Kazuya Tokuda: Investigation (Supporting)
Yoshihiro Saito: Writing – original draft (Equal)
Conflict of Interest
The authors declare no conflict of interest in the manuscript.
Footnotes
J. Iihara, K. Tokuda, and Y. Saito: ECSJ Active Members
References
- 1) D. Reynard, S. Maye, P. Peljo, V. Chanda, H. Girault, and S. Gentil, Chem. Eur. J., 26, 7250 (2020).
- 2) S. Park, H. J. Lee, H. Lee, and H. Kim, J. Electrochem. Soc., 165, A3215 (2018).
- 3) S. Park, H. Lee, H. J. Lee, and H. Kim, J. Power Sources, 451, 227746 (2020).
- 4) D. Asakura, E. Hosono, M. Kitamura, K. Horiba, E. Magome, H. Setoyama, E. Kobayashi, H. Yuzawa, T. Ohigashi, T. Sakai, R. Kanega, T. Funaki, Y. Sato, and A. Ohira, Chem. Asian J., 18, e202201047 (2022).
- 5) L. H. Thaller, Proceedings 9th Intersociety Energy Conversion Engineering, 924 (1974). https://ntrs.nasa.gov/citations/19740013575
- 6) T. Shigematsu, SEI TECHNICAL REVIEW, 73, 4 (2011). https://global-sei.com/technology/tr/bn78/pdf/78-15.pdf
- 7) Y. Dong, H. Kaku, H. Miyawaki, R. Tatsumi, K. Moriuchi, and T. Shigematsu, SEI TECHNICAL REVIEW, 84, 35 (2017). https://global-sei.com/technology/tr/bn84/pdf/84-06.pdf
- 8) Y. Dong, H. Kaku, K. Hanafusa, K. Moriuchi, and T. Shigematsu, ECS Trans., 69(18), 59 (2015).
- 9) H. Kaku, Y. R. Dong, K. Hanafusa, K. Moriuchi, and T. Shigematsu, ECS Trans., 72(10), 1 (2016).
- 10) K. Tokuda, J. Iihara, Y. Saito, A. Masuno, and H. Inoue, J. Chem. Phys., 149, 014503 (2018).
- 11) https://bruceravel.github.io/demeter/
- 12) B. Ravel and M. Newville, J. Synchrotron Radiat., 12, 537 (2005).
- 13) https://support.spring8.or.jp/BL/bl14b2/xafs/standardDB/
- 14) N. Tušar, D. Maučec, M. Rangus, I. Arčon, M. Mazaj, M. Cotman, A. Pintar, and V. Kaučič, Adv. Funct. Mater., 22, 820 (2012).
- 15) T. Yamamoto, Adv. X-Ray Chem. Anal., Japan, 38, 45 (2007) [in Japanese], https://repo.lib.tokushima-u.ac.jp/files/public/11/111215/20180313131600202138/axca_38_45.pdf
- 16) S. Martin, Environmental Catalysis (Ed. V. Grassian), CRC Press, Boca Raton, FL, USA, Chap. 4, p. 701 (2005).
- 17) J. Bargar, B. Tebo, and J. Villinski, SLAC-PUB-8438 (2000). https://www.slac.stanford.edu/cgi-bin/getdoc/slac-pub-8438.pdf
- 18) E. Silvester, A. Manceau, and V. Drits, Am. Mineral., 82, 962 (1997).
- 19) F. Farges, Phys. Rev. B, 71, 155109 (2005).
- 20) F. Farges, G. Brown, Jr., and J. Rehr, Phys. Rev. B, 56, 1809 (1997).
- 21) F. Farges, Am. Mineral., 82, 36 (1997).