Abstract
Gestational Diabetes Mellitus (GDM) has brought great harm to maternal and fetus. Up to now, only a few plasma biomarkers for its early diagnosis have been reported; nevertheless, there is no report about identification of urinary biomarkers for prediction of GDM. Thus, it is necessary to correct this deficiency. In our study, urine samples were collected from 889 healthy young gravidae at the early second trimester (15 to 20 weeks), 69 of whom were subsequently diagnosed with GDM at 24 to 28 weeks. iTRAQ (the isobaric tags for relative and absolute quantification) quantitative proteomics was conducted on sixteen GDM (trial group) and an equal number of matched healthy young gravidae (control group). Validation was performed in 40 cases of each group by ELISA. A total of 1,901 proteins were identified in this study, including 119 significantly differential proteins (fold change ≧1.2 or ≦0.83 and p < 0.05). Compared with control group, 83 differential proteins were increased and 36 proteins were decreased in GDM group. The validation for expression of CD59 and IL1RA showed significant difference and the area under the receiver operating characteristic curve was 0.729 and 0.899, respectively (p < 0.05). The two candidate protein biomarkers (CD59 and IL1RA) in urine could be an early, noninvasive diagnostic predictors of young pravidae with GDM, and IL1RA is stronger diagnostic power than CD59.
GESTATIONAL DIABETES MELLITUS (GDM) is a common pregnancy complications, with a global incidence between 0.6% to 15% [1]. Especially, Asian women are ethnically more prone to suffer from glucose intolerance, with a prevalence of 3.05% to 21.4% [2]. Because of the increased epidemic of obesity and delayed reproductive age, the incidence of GDM is substantially increased [3, 4]. Some studies have shown that the incidence of GDM in developing countries has increased by 30% in the last 10 to 20 years [5]. GDM has been found to increase the risk of maternal adverse outcome and perinatal complications, including cesarean section, dystocia, birth injury, pregnancy hypertension (including eclampsia), postpartum type 2 diabetes leading to hypoglycemia, premature delivery, hyperbilirubinemia, and so on [6].
Presently, GDM is diagnosed with a 75 g oral glucose tolerance test at 24 to 28 weeks of gestation [7]. The diagnosis is made around the middle of the pregancy term, it does not give sufficient time to provide interventional therapy to the mother and fetus. Therefore, it is necessary to find some noninvasive biomarkers to predict the risk of GDM. Several studies determined that GDM is associated with a few protein biomarkers, including sex hormone-binding globulin (SHBG), c-reactive protein (CRP), IL-6, leptin and TNF-alpha [8, 9]. These proteins could be the early predictors of GDM [10, 11].
Compared with the blood samples, urine can be collected noninvasively, meanwhile, the protein composition is relatively simple, stable and easier to analyze. In our study, we used urine samples of young gravidae to develope a iTRAQ quantitative proteomic between healthy and GDM subjects. Bioinformatic analysis of these proteins suggested roles in metabolic regulation, inflammation, immune response and other biological processes. In addition, we found some new specific biomarkers that could predict GDM onset. Our work would have a major impact on early prediction and early intervention for GDM.
Materials and Methods
Patient recruitment and urine collection
The study was designed including 889 pregnant women at the early second-trimester stages (15 to 20 weeks of gestation). Recruitment was performed at the Maternity and Child Health hospital of Qinhuangdao from October 2016 to February 2017. All patients and their family members were written informed consent. The study was approved by the Ethics Committee of China Clinical Trial Registry (ChiECRCT-20170021) and registered in China clinical trial registry (Register no. ChiCTR-COC-17011070). Inclusion criteria included: age ≦35 years old, body mass index (BMI) <27 kg/m2, parity ≦1, gravidity ≦2, fasting plasma glucose (FPG) <6.1 mmol/L and glycated hemoglobin (A1C) <6.0% on the frist prenatal visit. All pregnant women subsequently screened for GDM by oral glucose tolerant test (75 g) at 24 to 28 weeks of gestation. According to the diagnostic criteria of the IADPSG, GDM can be diagnosed with any one of the following three items: FPG ≧5.1 mmol/L, 1 h post-load glucose ≧10.0 mmol/L and 2 h post-load glucose ≧8.5 mmol/L. The exclusion criteria included history of Type 2 Diabetes (T2D) and hypertension, Chronic hepatitis, nephritis, thyroid disease (including hyperthyroidism and hypothyroidism), endocrine metabolic disease and autoimmune disease, blood diseases, malignant tumors and other chronic diseases. Patients who smoked, had chemical dependency, multiple pregnant women and fetal congenital anomalies were also excluded. 30 mL of urine was collected during midstream from all subjects at the early second trimester (15 to 20 weeks of gestation) and stored at –80°C. Of the 889 participants, 69 were subsequently diagnosed with GDM by a 75 g glucose load. 16 GDM and an equal number of well-matched normal controls (cholesterol ≦5.4 mmol/L), were finally randomly chosen for LC-MS/MS analysis.
Reagents and chemicals
Chemicals were purchased from Sigma Aldrich (Oakville, ON, Canada). All TMT reagents and buffers were obtained from Thermo Fisher Scientific (USA).
Urine sample preparation for analysis
1 mL urine from each of the 16 subjects was taken out and mixed. The mixture pool was centrifuged at 800 g for 10 min at 4°C. The supernatants from the same histological grade or pathological stage were mixed as a subgroup. Proteins from each subgroup were precipitated using 4 volumes of cold acetone at –20°C for 4 hrs. A modified FASP [12] method was used to digest proteins. Briefly, 300 μg protein from each subgroup was added to a 10 KDa centrifugal filter, reduced by 10 mM DTT for 2.5 hrs at 37°C and alkylated by 50 mM IAA at room temperature in the dark. Proteins were washed sequentially by 8 M urea and 50 mM TEAB. Trypsin in 150 μL 50 mM TEAB was added to the centrifugal filter at 1:50 (M:M) and proteins were digested overnight. Peptides from each sample were TMT-labelled as follows: Sample control was labelled with 126, 127 and 128 and sample GDM was labelled with 129, 130 and 131. The mixture of TMT-labelled peptides was fractionated using Agilent 1200 LC system (USA). Peptides were reconstituted and loaded onto a C18 column and separated using buffer A (20 mM Ammonium acetate in H2O, pH10) and then eluted using 5–35% buffer B (20 mM Ammonium acetate, 90% ACN/ H2O, pH10) for 35 minutes, 35%–90% buffer B for 5 minutes and 90% buffer B for 5 minutes. Elution was monitored by measuring the absorbance at 214 nm, and fractions were collected every 1 min, pooled into 10 fractions and vacuum-dried.
LC-MS/MS Analysis
Each fraction was re-suspended in 20 μL buffer A (0.1% FA/H2O) and Waters nano ACQUITY system (Waters, USA) was used to separate the peptides. 1 μL of peptides was first loaded onto an in-house C18 trap column (150 um, 2 cm, 5 um) for 30 min and then separated using an in-house C18 column (75 um, 15 cm, 3 um). Peptides were eluted at 40 nL/min using 8 to 40% buffer B (98% ACN, 0.1% FA) for 92 min, followed by a 3-min linear gradient using 90% buffer B. This was maintained at 90% buffer B for 10 min and finally to 1% buffer B over 1 min and maintained at 1% buffer B for 14 min.
Peptides were ionized using nanoelectrospray ionization and detected by high resolution tandem mass spectrometry Q Exactive (Thermo, USA). A survey scan from m/z 300–1,800 was used for detection at a resolution of 70 K and AGC of 3e6. Each precursor ion from the scan was isolated using a 2.2 m/z window and dissociated using a NCE 30 with HCD. Product ions were scanned at resolution of 17.5 K and AGC of 1e6. A data dependent procedure that alternated between 1 MS scan followed by 20 MS/MS scans was applied for the 20 most abundant precursor ions and dynamic exclusion time was 20 seconds.
Database search and bioinformatics
Proteome Discoverer 2.1 (Thermo, USA) was used to process the resulting raw MS/MS spectra. All raw files were searched using SEQUEST HT with a human database downloaded from Uniprot. For peptide identification and quantitation, mass tolerance for peptide and fragment was set to 10 ppm and 0.02 Da, and Carbamidomethyl (C), TMT6plex (N-term), TMT6plex (K) were set to fixed modification. Variable modifications were set as follows: Oxidation (M), Deamidated (N,Q), Acetyl (Protein N-terminus). Both peptide level and protein level had a FDR less than 1%, and also normalization on total peptide amount was used to reduce the variation between quantitation channels. For protein abundance ratios, we used fold change ≧1.2 or ≦0.83 as the threshold and a two-tailed p-value <0.05 to identify significantly statistical difference. All proteins with significant changed abundance were analyzed using Gene Ontology (GO) and functional classifications using PANTHER (http://www.pantherdb.org/). GO enrichment analysis was performed to identify GO terms that were significantly enriched for differentially expressed proteins. For pathway analysis, we used KEGG Pathway (http://www.kegg.jp/) and protein interactions were analyzed used STRING (http://string-db.org).
ELISA validation
To validate our results obtained from iTRAQ, ELISA (R&D system, USA and mlbio, China) was performed for 4 proteins with the most robust signals that were differentially regulated (up-regulated IL1RA and ECH1, down-regulated CD59 and APOF). According to inclusion criteria, we randomly selected 40 GDM and 40 matched young gravidae. The match criteria: (1) cholesterol ≦5.4 mmol/L, (2) cholesterol >5.4 mmol/L and difference <0.5 mmol/L, it is necessary to meet condition (1) or condition (2).
Statistical analysis
Statistical analysis was carried out with SPSS 24.0 (SPSS, Chicago, IL, USA). Measurement data were expressed as mean ± standard deviations and compared two groups using Student’s t-test. Enumeration data were expressed as percentages and compared two groups using a Chi-square test or Fisher’s exact test (the expected counts <5). Receiver operating characteristics (ROC) and the area under the curve (AUC) were used to evaluate the predictive value of protein biomarkers for GDM. An AUC value between 0.5 to 0.75 was considered to have predictive value, and the value ≧0.75 was considered to be a good diagnostic index [13]. p-value <0.05 was considered to be significant difference.
Results
Demographics of subjects
Urinary samples from 889 pregnant women were collected. 69 cases had abnormal glucose tolerance, of which 6 cases of urinary abnormality (high red blood cells or white blood cells in the urine) were excluded. The 63 cases file were reviewed on their first prenatal visit, 8 cases were without measurement of blood lipid, 31 cases were pure GDM, and 24 cases were GDM with hyperlipidemia. 820 of the samples tested showed normal glucose tolerance. Based on inclusion criteria, in LC-MS/MS analysis, 16 GDM and 16 matched young gravidae were recruited. Similarly, in ELISA validation, 40 GDM and an equal number of matched young gravidae were recruited. Match criteria is described earlier in this article.
Table 1A shows the general clinical characteristics of patients in LC-MS/MS analysis and Table 1B shows the general clinical characteristics of patients in ELISA validation. In the two tables, the FPG, OGTT 1-hour glucose and 2-hour glucose of the GDM group were higher than those of the control group (p < 0.05) and there was no difference in age, BMI, gravidity, parity, glucose, cholesterol and A1C between GDM group and control group (p > 0.05).
Table 1
General clinical characteristics
| A. General clinical characteristics of LC-MS/MS |
|
Trial |
Control |
p-value |
| Sample size (N) |
16 |
16 |
|
| Maternal age (years) |
29.88 ± 2.96 |
28.94 ± 2.62 |
0.351 |
| Body mass index (kg/m2) |
21.78 ± 2.11 |
21.24 ± 2.67 |
0.537 |
| Gestation (days) |
116.50 ± 5.67 |
117.00 ± 4.00 |
0.775 |
| Parity |
0.31 ± 0.48 |
0.31 ± 0.48 |
1.000 |
| Gravidity |
0.69 ± 0.79 |
0.63 ± 0.81 |
0.827 |
| Fasting plasma glucose (mmol/L) |
4.65 ± 0.31 |
4.54 ± 0.37 |
0.358 |
| Glycated hemoglobin (%) |
5.03 ± 0.25 |
5.04 ± 0.27 |
0.891 |
| Cholesterol (mmol/L) |
4.71 ± 0.51 |
4.57 ± 0.57 |
0.454 |
| Triglyceride (mmol/L) |
1.40 ± 0.37 |
1.26 ± 0.34 |
0.249 |
| 24–28 week Fasting glucose (mmol/L) |
4.65 ± 0.55 |
4.15 ± 0.53 |
0.014* |
| 24–28 week OGTT 1-h glucose (mmol/L) |
9.69 ± 1.20 |
7.08 ± 1.29 |
<0.001** |
| 24–28 week OGTT 2-h glucose (mmol/L) |
9.07 ± 1.21 |
6.35 ± 1.01 |
<0.001** |
| B. General clinical characteristics of ELISA validation |
|
Trial |
Control |
p-value |
| Sample size (N) |
40 |
40 |
|
| Maternal age (years) |
28.60 ± 3.29 |
28.00 ± 2.72 |
0.397 |
| Body mass index (kg/m2) |
21.98 ± 2.61 |
21.93 ± 2.82 |
0.931 |
| Gestation (days) |
116.53 ± 5.33 |
117.88 ± 5.79 |
0.281 |
| Parity |
0.40 ± 0.67 |
0.48 ± 0.78 |
0.647 |
| Gravidity |
0.23 ± 0.42 |
0.25 ± 0.44 |
0.796 |
| Fasting plasma glucose (mmol/L) |
4.72 ± 0.32 |
4.61 ± 0.40 |
0.175 |
| Glycated hemoglobin (%) |
5.04 ± 0.22 |
5.01 ± 0.27 |
0.494 |
| Cholesterol (mmol/L) |
4.74 ± 0.96 |
4.83 ± 0.79 |
0.682 |
| Triglyceride (mmol/L) |
1.38 ± 0.46 |
1.29 ± 0.54 |
0.387 |
| 24–28 week Fasting glucose (mmol/L) |
4.87 ± 0.52 |
4.28 ± 0.43 |
<0.001** |
| 24–28 week OGTT 1-h glucose (mmol/L) |
9.30 ± 1.37 |
6.87 ± 1.41 |
<0.001** |
| 24–28 week OGTT 2-h glucose (mmol/L) |
8.47 ± 1.47 |
6.10 ± 0.92 |
<0.001** |
Fasting plasma glucose, glycated hemoglobin, cholesterol and triglyceride were measured on the frist prenatal visit.
Data are expressed as mean ± SD and compared using Student’s t test for continuous variables.
p for difference between the two groups. * p < 0.05, ** p < 0.01.
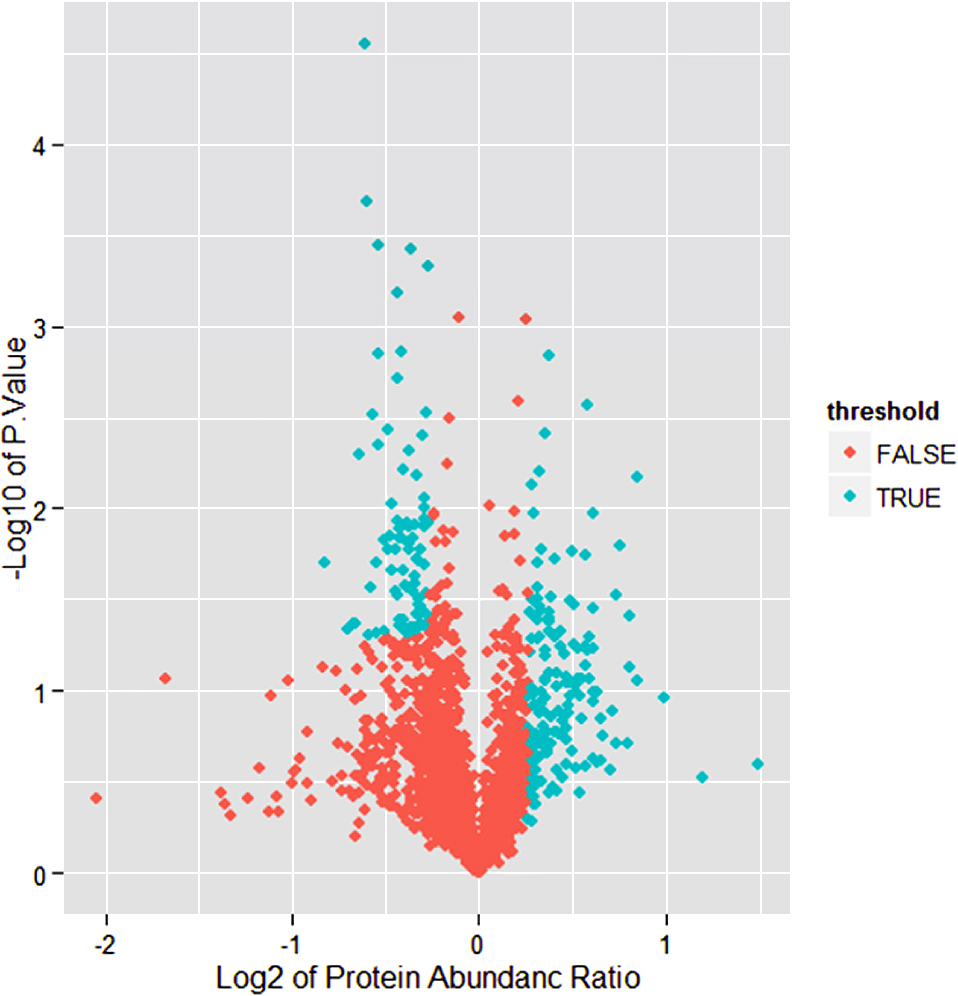
A workflow chart of recruitment in this study is presented in Fig. 1. In this study, 1,901 proteins and 10,549 unique peptides were identified in all groups, and 119 differential expressed proteins were identified from fold change (Average expression of trial/control group) ≧1.2 or ≦0.83 and p < 0.05 (Fig. 2). 36 of which were highly expressed in the control group, and 83 proteins were highly expressed in GDM. Through GO and pathway analysis of these 119 proteins, it was observed that 23 proteins were grouped in the “response to stress”, 7 proteins in cadherin binding, 9 proteins in cell adhesion binding and 15 involved in cellular components. The differential protein expressions were analyzed to determine the cellular component, molecular function, Protein Class and biological processes (Fig. 3). By analysis of the cellular component, we found potential biomarkers in the extracellular region, vesicle, extracellular organelle, extracellular vesicle, extracellular exosome, extracellular space and cell junction. By analysis of molecular function, we found 7 proteins participate in cadherin binding and 9 proteins involved in cell adhesion binding (Fig. 3). These proteins take part in various biological processes related to metabolic pathways (5/55), Toll-like receptor signaling pathway (3/55), biosynthesis of amino acids (3/55), biosynthesis of amino acids (3/55), proteoglycans in cancer (3/55), HTLV-I infection (3/55), PI3K-Akt signaling pathway (3/55), regulation of actin cytoskeleton (3/55) and signaling pathways regulating pluripotency of stem cells (3/55), and so on (Fig. 3).

By ELISA analysis, four differential proteins (CD59, IL1RA, APOF and ECH1) were chosen to validate the LC-MS/MS results, two of which were up-regulated and two of which were down-regulated (Fig. 4). The expression of CD59 in GDM group was significantly lower than those of the control group (p < 0.001) (Fig. 4A, B). The expression of IL1RA was significantly higher in GDM patients than those of the control group (p < 0.001) (Fig. 4C, D). The expression of APOF and ECH1 was consistent with proteomics, but there was no significant difference (Supplementary Fig. 1A and Supplementary Fig. 1B). The result of ELISA provides evidence that using the iTRAQ technology to select proteins was reliable.
Assessment of probability to predict GDM of candidate markers
Fig. 5 show ROC curves which evaluated CD59 and IL1RA as markers for GDM prediction (Fig. 5). IL1RA candidate biomarker performed more accurately with AUC of 0.899 (p < 0.001) compared to CD59 marker (AUC = 0.729, (p < 0.001) (Table 2). Combination of CD59 and IL1RA achieved an AUC of 0.906. There was significantly difference between this curve of CD59 and IL1RA (p = 0.0043) (Table 2). The analysis demonstrated that CD59 and IL1RA in urine could be the potential marker for prediction of GDM, and IL1RA was better than CD59.
Table 2
Area under the curve (AUC)
| Test Result Variable (s) |
Area |
Significance level |
| IL1RA |
0.899 |
<0.001** |
| CD59 |
0.729 |
<0.001** |
| Combination |
0.906 |
<0.001** |
| Comparision |
|
0.0043** |
AUC for IL1RA = 0.899, AUC for CD59 = 0.729, AUC for combination of two markers = 0.906. There was significantly difference between IL1RA and CD59. ** p < 0.01.
Discussion
Gestational diabetes mellitus (GDM) is associated with adverse outcome for mothers and their fetus in the short and long term including premature delivery, caesarean birth, birth injured, preeclampsia, and future developmental risk of type II diabetes mellitus [14]. It is reported that early screening and diagnosis for GDM ameliorate pregnancy complications and perinatal outcomes [15]. But most protocols used plasma and few researches used urine. In this research, we applied a high sensitive and repetitive iTRAQ to profile urine proteomics of GDM and control subjects to find the biomarkers at 15 to 20 weeks of gestation. These candidate biomarkers may be used to detect the early onset of the GDM and prevent this disorder.
Using iTRAQ labeling followed by LC-MS/MS analysis, a total of 119 urinary proteins were significantly different in GDM, of which 83 proteins were up-regulated and 36 proteins were down-regulated. Moreover, by ELISA analysis using more number of cases, our study verificated four differential proteins: CD59, IL1RA, APOF and ECH1, and found that the expressions of the four proteins are the same as those of proteomics. There was statistical difference in CD59 and IL1RA, but there was no statistical difference in APOF and ECH1. The results suggested urinary CD59 and IL1RA proteins may be the early diagnostic or prognostic biomarkers for GDM.
Previously studies have discovered many plasma markers in the first and early second-trimester stages of pregnancy for prediction of GDM [10, 11, 16]. Compared with these studies, our research was non-invasively, stable, relatively simple, and easier to analyze compared to serum.
CD59 is a small, heavily complement regulatory protein of 18–20 kDa attached to cell membranes via a glycosylphosphatidylinositol (GPI) link [17]. As specifically suppressor of membrane attack complex (MAC) formation, CD59 protects “self” cells from complement-mediated impairment [17, 18]. Recently, a novel role of CD59 in the development of diabetes has been reported. Many researchers have discovered that CD59 is reduced, but glycated CD59 (GCD59) is increased in plasma diabetes [19-21]. This is because CD59 is inhibited by hyperglycemia-induced glycation to increase deposition of MAC, a major effector of complement-mediated tissue damage and CD59 is shed from cell membranes by phospholipases generating a soluble form present in blood and urine [22]. Soggiu A, et al. discovered that the expression of CD59 was decreased in type 1 diabetes than control group [23]. A large samples study from pregnant women during 24 to 28 of gestation, found that GCD59 could diagnosis pregnancy-induced glucose intolerance with high sensitivity and specificity and can potentially predict the risk for Large for Gestational Age (LGA) babies [24]. Although the expression of CD59 were consistent with previous reports, there have been no reports about urinary CD59 for the prediction of GDM. The differences were that our prospective study focused on the early second-trimester stages to explore new urinary biomarkers for GDM based on a well-designed quantitative proteomics methods.
In addition, an interesting protein named IL1RA was firstly identified up-regulated in GDM urine. Previous studies have focused on the role of IL1RA in plasma, and the results of IL1RA was not consistent. Herder C et al. demonstrated that glucose at 2 hour and insulin sensitivity were associated with the changes of IL1RA, which is a naturally occurring inhibitor of IL-1 action [25]. Its overexpression protects pancreatic islets from the deleterious effects of IL-1 beta on beta cell replication, apoptosis and function [26]. However, some researchers found IL1RA showed particularly high expression levels in BXSB (glomerulonephritis model) mice [27]. Therefore, we speculate IL1RA increasely discharge by renal, resulting in the decreased blood level, but pathogenesis of IL1RA was needed to further research.
We have identified candidate biomarkers that could become predictors of GDM. Such biomarkers may help the early diagnosis and treatment of GDM. But our study is limited by the small number of patients and the lack of older and obesity. Therefore, the following study will be conducted to apply this technique with larger sample and population for measure the threshold of these markers in predictive diagnosis of GDM.
In Conclusion, we present the new urinary biomarkers to identify patients in early second-trimester stages of young gravidae who will develop GDM based on iTRAQ quantitative proteomics. We find that up-regulated IL1RA and down-regulated CD59 early in gestation (15 to 20 weeks) could be the strongest predictors for the later development of young gravidae with GDM, hence suggesting that the early diagnosis and intervention in order to minimize maternal and fetal risk.
Conflict of Interest
The authors have no conflicts of interest.
Supporting Information
Supplementary Fig. 1A. The expression of ECH1 was consistent with proteomics, but there was no significant difference.
Supplementary Fig. 1B. The expression of APOF was consistent with proteomics, but there was no significant difference.
Reference
- 1 Chiefari E, Arcidiacono B, Foti D, Brunetti A (2017) Gestational diabetes mellitus: an updated overview. J Endocrinol Invest 40: 899–909.
- 2 Yuen L, Wong VW (2015) Gestational diabetes mellitus: challenges for different ethnic groups. World J Diabetes 6: 1024–1032.
- 3 Marchi J, Berg M, Dencker A, Olander EK, Begley C (2015) Risks associated with obesity in pregnancy, for the mother and baby: a systematic review of reviews. Obes Rev 16: 621–638.
- 4 Kubo A, Ferrara A, Brown SD, Ehrlich SF, Tsai AL, et al. (2017) Perceived psychosocial stress and gestational weight gain among women with gestational diabetes. PLoS One 12: e0174290.
- 5 Zhu Y, Zhang C (2016) Prevalence of gestational diabetes and risk of progression to type 2 diabetes: a global perspective. Curr Diab Rep 16: 7.
- 6 Farrar D, Duley L, Dowswell T, Lawlor DA (2017) Different strategies for diagnosing gestational diabetes to improve maternal and infant health. Cochrane Database Syst Rev 8: CD007122.
- 7 Hao M, Lin L (2017) Fasting plasma glucose and body mass index during the first trimester of pregnancy as predictors of gestational diabetes mellitus in a Chinese population. Endocr J 64: 561–569.
- 8 Fasshauer M, Bluher M, Stumvoll M (2014) Adipokines in gestational diabetes. Lancet Diabetes Endocrinol 2: 488–499.
- 9 Powe CE (2017) Early pregnancy biochemical predictors of gestational diabetes mellitus. Curr Diab Rep 17: 12.
- 10 Singh A, Subramani E, Datta Ray C, Rapole S, Chaudhury K (2015) Proteomic-driven biomarker discovery in gestational diabetes mellitus: a review. J Proteomics 127: 44–49.
- 11 Zhao C, Wang F, Wang P, Ding H, Huang X, et al. (2015) Early second-trimester plasma protein profiling using multiplexed isobaric tandem mass tag (TMT) labeling predicts gestational diabetes mellitus. Acta Diabetol 52: 1103–1112.
- 12 Wisniewski JR, Zougman A, Nagaraj N, Mann M (2009) Universal sample preparation method for proteome analysis. Nat Methods 6: 359–362.
- 13 Nhi DM, Huy NT, Ohyama K, Kimura D, Lan NT, et al. (2016) A proteomic approach identifies candidate early biomarkers to predict severe dengue in children. PLoS Negl Trop Dis 10: e0004435.
- 14 Ashwal E, Hod M (2015) Gestational diabetes mellitus: where are we now? Clin Chim Acta 451: 14–20.
- 15 Tieu J, McPhee AJ, Crowther CA, Middleton P, Shepherd E (2017) Screening for gestational diabetes mellitus based on different risk profiles and settings for improving maternal and infant health. Cochrane Database Syst Rev 8: CD007222.
- 16 Kim SM, Park JS, Norwitz ER, Lee SM, Kim BJ, et al. (2012) Identification of proteomic biomarkers in maternal plasma in the early second trimester that predict the subsequent development of gestational diabetes. Reprod Sci 19: 202–209.
- 17 Davies A, Lachmann PJ (1993) Membrane defence against complement lysis: the structure and biological properties of CD59. Immunol Res 12: 258–275.
- 18 Blom AM (2017) The role of complement inhibitors beyond controlling inflammation. J Intern Med 282: 116–128.
- 19 Ghosh P, Vaidya A, Sahoo R, Goldfine A, Herring N, et al. (2014) Glycation of the complement regulatory protein CD59 is a novel biomarker for glucose handling in humans. J Clin Endocrinol Metab 99: E999–E1006.
- 20 Zhang J, Gerhardinger C, Lorenzi M (2002) Early complement activation and decreased levels of glycosylphosphatidylinositol-anchored complement inhibitors in human and experimental diabetic retinopathy. Diabetes 51: 3499–3504.
- 21 Gonzalez-Calero L, Martin-Lorenzo M, de la Cuesta F, Maroto AS, Baldan-Martin M, et al. (2016) Urinary alpha-1 antitrypsin and CD59 glycoprotein predict albuminuria development in hypertensive patients under chronic renin-angiotensin system suppression. Cardiovasc Diabetol 15: 8.
- 22 Ghosh P, Sahoo R, Vaidya A, Cantel S, Kavishwar A, et al. (2013) A specific and sensitive assay for blood levels of glycated CD59: a novel biomarker for diabetes. Am J Hematol 88: 670–676.
- 23 Soggiu A, Piras C, Bonizzi L, Hussein HA, Pisanu S, et al. (2012) A discovery-phase urine proteomics investigation in type 1 diabetes. Acta Diabetol 49: 453–464.
- 24 Ghosh P, Luque-Fernandez MA, Vaidya A, Ma D, Sahoo R, et al. (2017) Plasma glycated CD59, a novel biomarker for detection of pregnancy-induced glucose intolerance. Diabetes Care 40: 981–984.
- 25 Herder C, Faerch K, Carstensen-Kirberg M, Lowe GD, Haapakoski R, et al. (2016) Biomarkers of subclinical inflammation and increases in glycaemia, insulin resistance and beta-cell function in non-diabetic individuals: the Whitehall II study. Eur J Endocrinol 175: 367–377.
- 26 Tellez N, Montolio M, Estil-les E, Escoriza J, Soler J, et al. (2007) Adenoviral overproduction of interleukin-1 receptor antagonist increases beta cell replication and mass in syngeneically transplanted islets, and improves metabolic outcome. Diabetologia 50: 602–611.
- 27 Kimura J, Ichii O, Otsuka S, Kanazawa T, Namiki Y, et al. (2011) Quantitative and qualitative urinary cellular patterns correlate with progression of murine glomerulonephritis. PLoS One 6: e16472.