ORIGINAL
Levothyroxine in the treatment of overt or subclinical hypothyroidism: a systematic review and meta-analysis
2020 Volume 67 Issue 7 Pages 719-732

Details
2020 Volume 67 Issue 7 Pages 719-732
The goal of this study was to review relevant randomized controlled trials in order to determine the clinical efficacy of levothyroxine in the treatment of overt or subclinical hypothyroidism. Using appropriate keywords, we identified relevant studies using PubMed, the Cochrane library, and Embase. Key pertinent sources in the literature were also reviewed, and all articles published through December 2019 were considered for inclusion. For each study, we assessed odds ratios (ORs), mean difference (MD), and 95% confidence interval (95%CI) to assess and synthesize outcomes. We included 25 studies with totally 1,735 patients in the meta-analysis. In the patients with hypothyroidism, compared with L-T4, L-T4 plus L-T3 significantly decreased TSH levels and increased FT3 levels. Compared with placebo, L-T4 significantly increased FT4 levels and decreased TSH levels. In patients with subclinical hypothyroidism, compared with placebo, L-T4 significantly decreased SBP, TSH, T3 and TC and increased FT3 and FT4.
THYROID HORMONE is an important hormone involved in human lipid synthesis and energy metabolism. Hypothyroidism can be caused by lesions in the hypothalamic-pituitary-thyroid axis, leading to insufficient thyroid hormone secretion. It can be divided into primary hypothyroidism, central hypothyroidism, and thyrotrophin or thyroid hormone insensitivity syndrome according to the site of the lesion, with primary hypothyroidism having the highest incidence. The prevalence of hypothyroidism is related to TSH diagnostic cut-off point, age, sex, race and other factors. Hypothyroidism is particularly common in women and the elderly and is characterized by inadequate action of thyroid hormones in the target tissue. The prevalence of hypothyroidism is about 5%–10%, and the prevalence of subclinical hypothyroidism is higher than that of clinical hypothyroidism. The National Health and Nutrition Survey (NHANES III) of people aged >12 years in the general population showed that using 4.5 mIU/L as the TSH normal limit, the prevalence of subclinical hypothyroidism was 4.3%, and clinical hypothyroidism prevalence was 0.3% [1-3]. Since thyroid hormone is an important hormone regulating human energy metabolism, hypothyroidism can lead to insufficient energy supply and decreased basic metabolism in patients, resulting in chills, decreased cardiac output and other clinical manifestations. At the same time, studies have shown that thyroid hormone can autonomously regulate the whole human lipid metabolic process and absorb serum free fatty acids and promote lipid decomposition, and hypothyroidism patients due to lack of thyroid hormone combined with hyperlipidemia. At present, preparations of thyroxine include levothyroxine, triiodothyronine and its compound preparations, and thyroid tablets of animal origin, etc [4-6].
The aim of this study was to perform a meta-analysis of all available literature to obtain updated evidence to explore the clinical efficacy of levothyroxine in the treatment of overt or subclinical hypothyroidism, and to provide a basis for the selection of clinical treatment.
To identify studies on treatment of overt or subclinical hypothyroidism, we reviewed the Cochrane library, PubMed, and Embase databases for relevant articles published through December 2019. We also reviewed the references of all identified articles to identify additional studies. Search terms were as follows: levothyroxine, levothyroxine sodium, sodium levothyroxine tablet, L-thyroxine, hypothyroidism, hypothyrea, thyroid hypofunction, primary hypothyroidism, subclinical hypothyroidism, random, randomized controlled trials, and RCT. These terms were used in combination with “AND” or “OR”. This literature review was performed independently by two investigators, with a third resolving any disputes as needed.
Following the PICOS (Participants, Interventions, Comparisons, Outcomes and Study design) principle, the key search terms included (P) adult patients with hypothyroidism; (I) in the treatment group, patients were treated by levothyroxine or combined with other drug; (C/O) the outcomes including the related clinical indexes; (S) RTC.
Study selection criteriaIncluded studies met the following criteria: (1) randomized controlled trials; (2) the subjects were adults with hypothyroidism; (3) treatment included levothyroxine or levothyroxine combined with other drugs in the treatment group; (4) studies were published in English or Chinese.
Studies were excluded for meeting the following criteria: (1) duplicate articles or results; (2) obvious data errors; (3) case reports, case-control studies, theoretical research, conference reports, systematic reviews, meta-analyses, and other forms of research or comment not designed in a randomized controlled manner; (4) irrelevant outcomes.
Two investigators independently determined whether studies met the inclusion criteria, with a third resolving any disputes as needed.
Data extraction and quality assessmentFor each eligible study, two categories of information were extracted: basic information and primary study outcomes. Basic information relevant to this meta-analysis included: author names, year of publication, Jadad score, the detail of disease, test method, interventions, sample size, age and gender. Primary outcomes relevant to this analysis included thyroid stimulating hormone (TSH), systolic blood pressure (SBP), diastolic blood pressure (DBP), total cholesterol (TC), triglycerides (TG), high density lipoprotein (HDL), low density lipoprotein (LDL), body mass index (BMI), triiodothyronine (T3), free triiodothyronine (FT3), and free thyroxine (FT4). Study quality was determined on the basis of Jadad scores, which were determined based on how well each study satisfied the following criteria: studies included a specific statement regarding randomization; the method used to randomize patients was appropriate; the study was conducted in a double-blinded manner; the approach to double-blinding was described appropriately; information on any patients that withdrew from or dropped out of the study was provided. A Jadad score <3 indicated a study of low-quality, and thus was associated with a substantial risk of bias. Data was extracted independently by two investigators, with a third resolving any disputes as needed.
Statistical analysisSTATA v10.0 (TX, USA) was used for all analyses. Heterogeneity in study results was assessed using chi-squared and I2 tests and appropriate analysis models (fixed-effects or random-effects) were determined. A chi-squared p ≤ 0.05 and an I2 > 50% indicated high heterogeneity and the random-effects model was used. A chi-squared p > 0.05 and an I2 ≤ 50% indicated acceptable heterogeneity and the fixed-effects model was instead used. Continuous variables were given as mean ± standard deviations and were compared on the basis of mean difference (MD), while categorical data were given as percentages and compared based on relative risk (RR)/odds ratios (ORs). All the indexes were analyzed by MD.
We reviewed a total of 1,106 articles that were identified by our initial keyword search, of which 1,015 were excluded following title/abstract review. The full text of the remaining 91 articles was assessed, excluding 63 additional articles that did not meet the study inclusion criteria. Reasons for exclusion of these studies were: non-randomized studies (31), lack of clinical outcomes of interest (27), duplicate studies (5) and no qualified patients (3). We ultimately identified a total of 25 studies [7-34] that met the inclusion criteria for this meta-analysis, including 1,735 patients. The study selection process is outlined in Fig. 1.
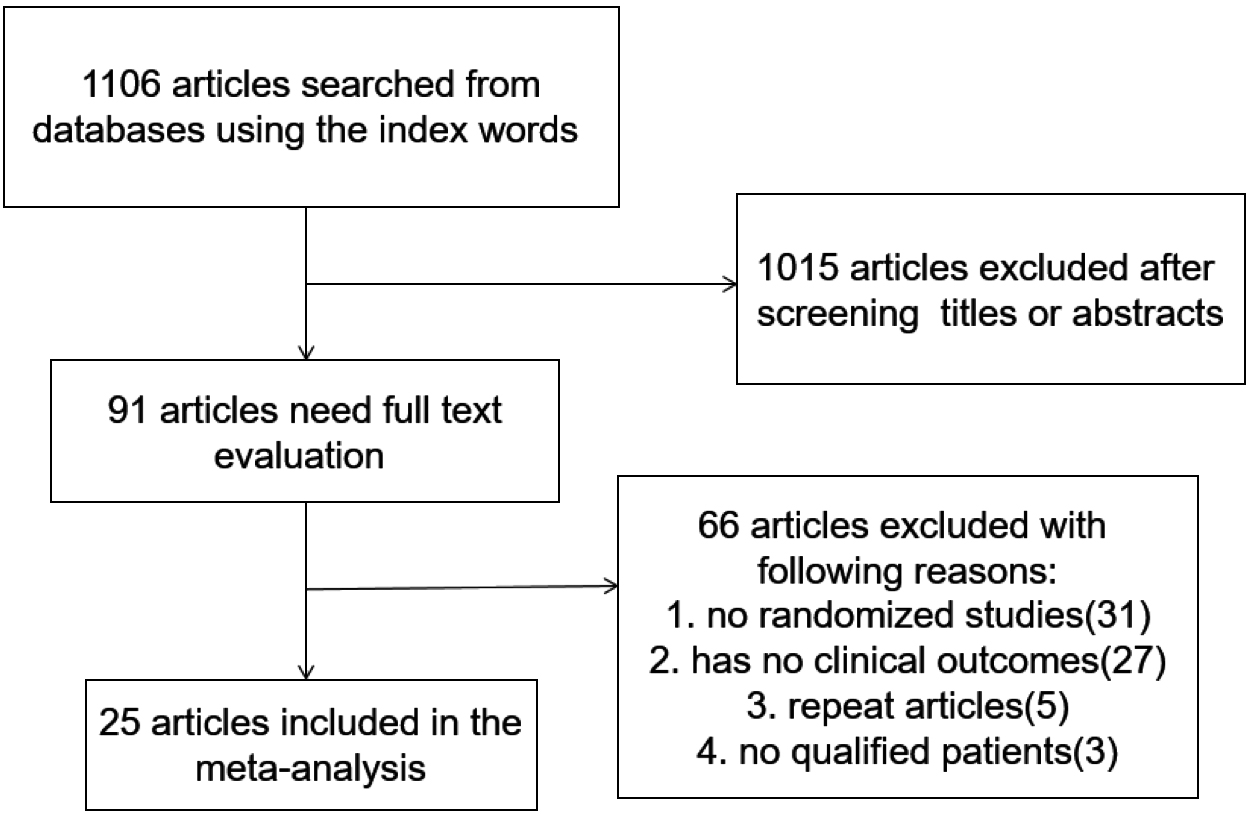
Literature search and selection strategy.
Table 1 summarizes the basic information of each study, including author names, year of publication, detail of disease, test method (TSH, FT4, FT3 and T3), interventions, sample, age and the Jadad score. The main Jodad score was 4.04, which indicated that the included studies were of high quality.
| Study | Jadad score | Disease | Test Method of TSH, FT4, FT3 and T3 | Intervention | No. of patients | Age | Gender | ||||
|---|---|---|---|---|---|---|---|---|---|---|---|
| T | C | T | C | T | C | T | C | ||||
| Robert Krysiak 2018 | 2 | young women with hypothyroidism | chemiluminescence using acridinium ester technology (ADVIA Centaur XP Immunoassay System, Siemens Healthcare Diagnostics, Munich, Germany) | L-T4 plus L-T3: 75–100 μg/daily levothyroxine was replaced by a preparation containing both levothyroxine and liothyronine in a weight proportion of 5:1 | L-T4 75–100 μg/daily | 17 | 20 | 31 | 30 | 17F | 20F |
| Yong Chen 2018 | 4 | early‑stage diabetic nephropathy patients with subclinical hypothyroidism | Plasma FT3, FT4, and TSH were determined by radioimmunoassay (normal range: FT3, 1.71–3.71 pg/mL; FT4, 0.70 FT3, 1.71L; TSH, 0.3–4.94 μIU/mL) (Linco Research, St. Charles, MO, USA). | L-T4 12.5 μg/day and gradually increased according to clinical symptoms and laboratory results. | placebo | 43 | 41 | 51 | 56 | 15M | 14M |
| Juliana Kaminski 2016 | 5 | Adults with primary hypothyroidism | — | LT4/LT3 therapy (75/15 μg/day) | L-T4 125 or 150 μg/day | 15 | 17 | 46.1 | 39.5 | 15F | 15F |
| Meng Zhao 2016 | 5 | Mild Subclinical Hypothyroidism | radioimmunoassay (Linco Research, St. Charles, MO, USA) | L-T4 12.5–125 μg once daily | placebo | 210 | 159 | 54.98 | 55.44 | 57M | 42M |
| Peng Liu 2015 | 5 | patients with early type 2 diabetic nephropathy and subclinical hypothyroidism | TSH by IRMA, T4 by RIA | L-T4, started from a low dose of 12.5 μg/d, and gradually increased according to clinical symptoms and laboratory test results | placebo | 60 | 59 | 49 | 49 | 13M | 14M |
| Laily Najafi 2015 | 5 | patients with subclinical hypothyroidism | ADVIA Centaur® immunoassay system, Siemens Healthcare Diagnostics | L-T4 100 ug daily | placebo | 30 | 30 | 32.47 | 36.07 | 25F | 26F |
| Chantal J. N. Verkleij 2013 a | 3 | hypothyroidism and hyperthyroxinaemia | ADVIA Centaur® immunoassay system, Siemens Healthcare Diagnostics | L-T4 0.3 mg per day | placebo | 16 | 20 | 30 | 52 | 9M | 7M |
| Chantal J. N. Verkleij 2013 b | 3 | hypothyroidism and hyperthyroxinaemia | immunochemiluminescence (Immulite 2000; DPC, Diagnostic Products Corporation, USA). | L-T4 0.45 mg per day | placebo | 12 | 20 | 29 | 52 | 6M | 7M |
| Monica Dias Cabral 2011 | 2 | female patients with mild subclinical hypothyroidism | immunochemiluminescence method (“Immulite”, Diagnostic Products Corporation, Los Angeles, USA) | L-T4 0.75 mg/kg/day | placebo | 14 | 18 | 43.36 | 47.59 | 14F | 18F |
| Valentine V. Fadeyev 2010 | 3 | primary hypothyroidism | Commercially available high-capacity, random access immunoassay kits were used to measure FT4, FT3, and TSH levels (Chiron Diagnostics Co., Walpole, MA, USA) | 25 μg L-T4 and 12.5 μg of L-T3 | L-T4 1.6 μg/kg | 16 | 20 | 40 | 43 | — | — |
| Toshiki Nagasaki 2009 | 4 | female subclinical hypothyroid | Serum FT3 and FT4 concentrations were measured by specific RIA (Techno-Genetics Recordati, Milan, Italy). Serum TSH levels were determined by an ultrasensitive immunoradiometric assay (IRMA) method (Cis Diagnostici, Tronzano Vercellese, Italy). | L-T4 12.5 μg–37.5 μg | placebo | 48 | 47 | 64.4 | 66 | — | — |
| Hakan Cinemre 2008 | 5 | Iron-Deficient Subclinical Hypothyroid Patients | Serum TSH concentration (reference range 0.1 to 4.0 mIU/L) was measured by a sensitive immunometric assay (Delfia; Wallac, Turku, Finland). Free T4 (8.0 to 23.0 pmol/L) and total T3 (1.2 to 3.1 nmol/L) were determined by microparticle enzyme immunoassays IMx (Abbott, Baar, Switzerland). | L-T4 75 μg/d plus oral iron 240 mg/d | oral iron 240 mg/d | 25 | 25 | 35 | 38 | 22M | 22M |
| Salman Razvi 2007 | 5 | Subclinical Hypothyroidism | enzyme immunoassay kits (Abbott Laboratories, Abbott Park, rl | L-T4 100 mu | placebo | 50 | 50 | 53.5 | 54.2 | 10M | 8M |
| F. MONZANI 2004 | 4 | Subclinical Hypothyroidism | TSH concentrations (using a third generation TSH assay, Axsym II, Abbott Laboratories, Chicago, IL), and free T4, free T3 (using fluorescent immunoassays, Axsym, Abbot Laboratories) | L-T4 70 says, Ax | placebo | 23 | 22 | — | — | — | — |
| Christian Meier 2004 | 5 | subclinical hypothyroidism | Serum TSH concentration (reference range 0.3/4.0 mU/L) was measured by an immunometric assay (Delfia, Wallac, Turku, Finland). Free T4 (reference range 8.0/23.0 pmol/L) and total T3 (reference range 1.2/3.1 nmol/L) were determined by microparticle enzyme immunoassays IMx (Abbott, Diagnostic Division, Chicago, IL). tHcy (reference range 5/15 mmol/L) was measured with the IMx fully automated fluorescence polarization immunoassay (Abbott). | L-T4 85.5 fluorescence | placebo | 33 | 33 | 57.1 | 57.1 | — | — |
| Patrick W. Clyde 2003 | 5 | primary hypothyroidism | Serum FT3 and FT4 concentrations were measured by specific RIA (Techno-Genetics Recordati, Milan, Italy). Serum TSH levels were determined by an ultrasensitive immunoradiometric assay (IRMA) method (Cis Diagnostici, Tronzano Vercellese, Italy) | L-T4 50 (Cis Diagnostici, twice daily | L-T4 25 us L-T3 agnostic | 22 | 22 | 43.1 | 45.2 | 19F | 17F |
| A. M. SAWKA 2003 | 4 | Patients with Hypothyroidism | The serum TSH concentration (reference range, 0.1 centration (reference range, no Vemmunometric assay (Delfia, Wallac, Inc., Turku, Finland). Free T4 (8.0 emmullese, Italy) ott)., rland) (1.2, Turku, Finland) were determined by microparticle enzyme immunoassays (IMx, Abbott Laboratories, Inc., Chicago, IL). | L-T4 25 bott Laboratories | L-T4 50 us | 20 | 20 | 45 | 49.5 | 3M | 1M |
| Mirjam Christ-Crain 2003 | 4 | hypothyroidism | Serum FT3 and FT4 levels were measured by specific RIA (Techno-Genetics Recordati, Milan, Italy). TSH was determined with an ultrasensitive immunoradiometric assay method (Cis Diagnostici, Tronzano Vercellese, Italy). | L-T4 | placebo | 31 | 32 | — | — | — | — |
| NADIA CARACCIO 2002 | 4 | Subclinical Hypothyroidism | TSH and FT4 were measured by immunoradiometric assay using a TSH-CTK-3 kit (DiaSorin Saluggia, Italy) and an FT4-CTK kit (DiaSorin). | L-T4 67.5T4 w | placebo | 24 | 25 | — | — | — | — |
| CHRISTIAN MEIER 2001 | 4 | Subclinical Hypothyroidism | third-generation electrochemiluminescence immunoassay (Gmbh, D-68298, roche diagnostics, mannheim Germany) | L-T4 85.5 eration electrochemiluminesce | placebo | 33 | 33 | 57.1 | 57.1 | — | — |
| FABIO MONZANI 2001 | 4 | Subclinical Hypothyroidism | TSH by immunochemiluminometric assay (LIAISON TSH, BYK GULDEN ITALIA, MILAN, ITALY), FT3 AND FT4 BY RADIOIMMUNOASSAY (LIAISON T4 AND T3, BYK GULDEN ITALIA) | L-T4 0.05 mg daily | placebo | 10 | 10 | 34.3 | 29.2 | 9F | 9F |
| Chung-Hoon Kim 2010 | 3 | subclinical hypothyroidism | immunochemiluminescent procedures (DPC: diagnostic products corporation/immulite 2000) | L-T4 50 hemi | placebo | 32 | 32 | 36 | 36.1 | — | — |
| Ashraf Hany Abdel Rahman 2009 | 2 | subclinical hypothyroidism | immunochemiluminescent assays (immulite 2000, diagnostic products crop., Los Angeles, California) | L-T4 50–100 mcg daily | placebo | 35 | 35 | 31.2 | 30 | — | — |
| Maijd Valizadeh 2009 | 5 | primary hypothyroidism | chemiluminescence using acridinium ester technology (ADVIA Centaur XP Immunoassay System, Siemens Healthcare Diagnostics, Munich, Germany) | L-T4 50 uminescence using acridiniu | L-T4 100 s | 30 | 30 | 39.2 | 38.8 | 24F | 24F |
| P. F. S. Teixeira 2008 | 5 | Subclinical Hypothyroidism | Plasma FT3, FT4, and TSH were determined by radioimmunoassay (normal range: FT3, 1.71–3.71 pg/mL; FT4, 0.70 FT3, 1.71 L; TSH, 0.3–4.94 μIU/mL) (Linco Research, St. Charles, MO, USA). | L-T4 25–75 St | placebo | 18 | 20 | 52.5 | 46.6 | — | — |
| Héctor F. Escobar-Morreale 2005 | 5 | Primary Hypothyroidism | TSH was determined in duplicates by Immulite® 2000 chemiluminescence TSH third-generation kit (Diagnostic Products Corporation, CA, USA; reference values [RV] 0.4–4.0 mUI/L; sensitivity 0.002 mUI/L; intra-assay coefficient of variation [CV], 3.8–12.5%; and inter-assay CV, 4.6–12.5%). Free T4 was measured in duplicates by Immulite® 2000 chemiluminescence enzymelinked immunosorbent assay kit (Diagnostic Products Corporation, CA, USA; RV, 0.8–1.9 ng/dL; sensitivity, 0.15 ng/dL; intra-assay CV, 4.4%–7.5%; and inter-assay CV, 4.8%–9.0%). Total T3 was measured in duplicates by Immulite® 2000 chemiluminescence enzymelinked immunosorbent assay kit (Diagnostic Products Corporation, CA, USA; RV, 82–179 ng/dL; sensitivity, 19 ng/dL; intra-assay CV, 4.4%–12%; and inter-assay CV, 5.3%–15%). | L-T4 75 μg plus L-T3 5 μg | L-T4 100 μg | 14 | 14 | — | — | — | — |
For the kinds of disease, we divided the included studies into hypothyroidism and subclinical hypothyroidism, then divided into subgroup analysis by intervention: levothyroxine plus liothyronine vs. levothyroxine (L-T4 plus L-T3 vs. L-T4), L-T4 vs. placebo, L-T4 plus oral iron vs. oral iron.
TSHTwenty-three studies with 1,627 patients reported results on TSH.
In patients with hypothyroidism, the value of TSH was significantly decreased in the L-T4 plus L-T3 than L-T4 (WMD: 0.38, 95%CI: 0.13–0.62), L-T4 plus oral iron than oral iron (WMD: 4.40, 95%CI: 2.79–6.01), L-T4 than placebo (WMD: 3.30, 95%CI: 1.18–5.42). In patients with subclinical hypothyroidism, L-T4 significantly reduced TSH than placebo (WMD: 4.99, 95%CI: 4.29–5.69).
The results are presented in Fig. 2A and Fig. 3A.
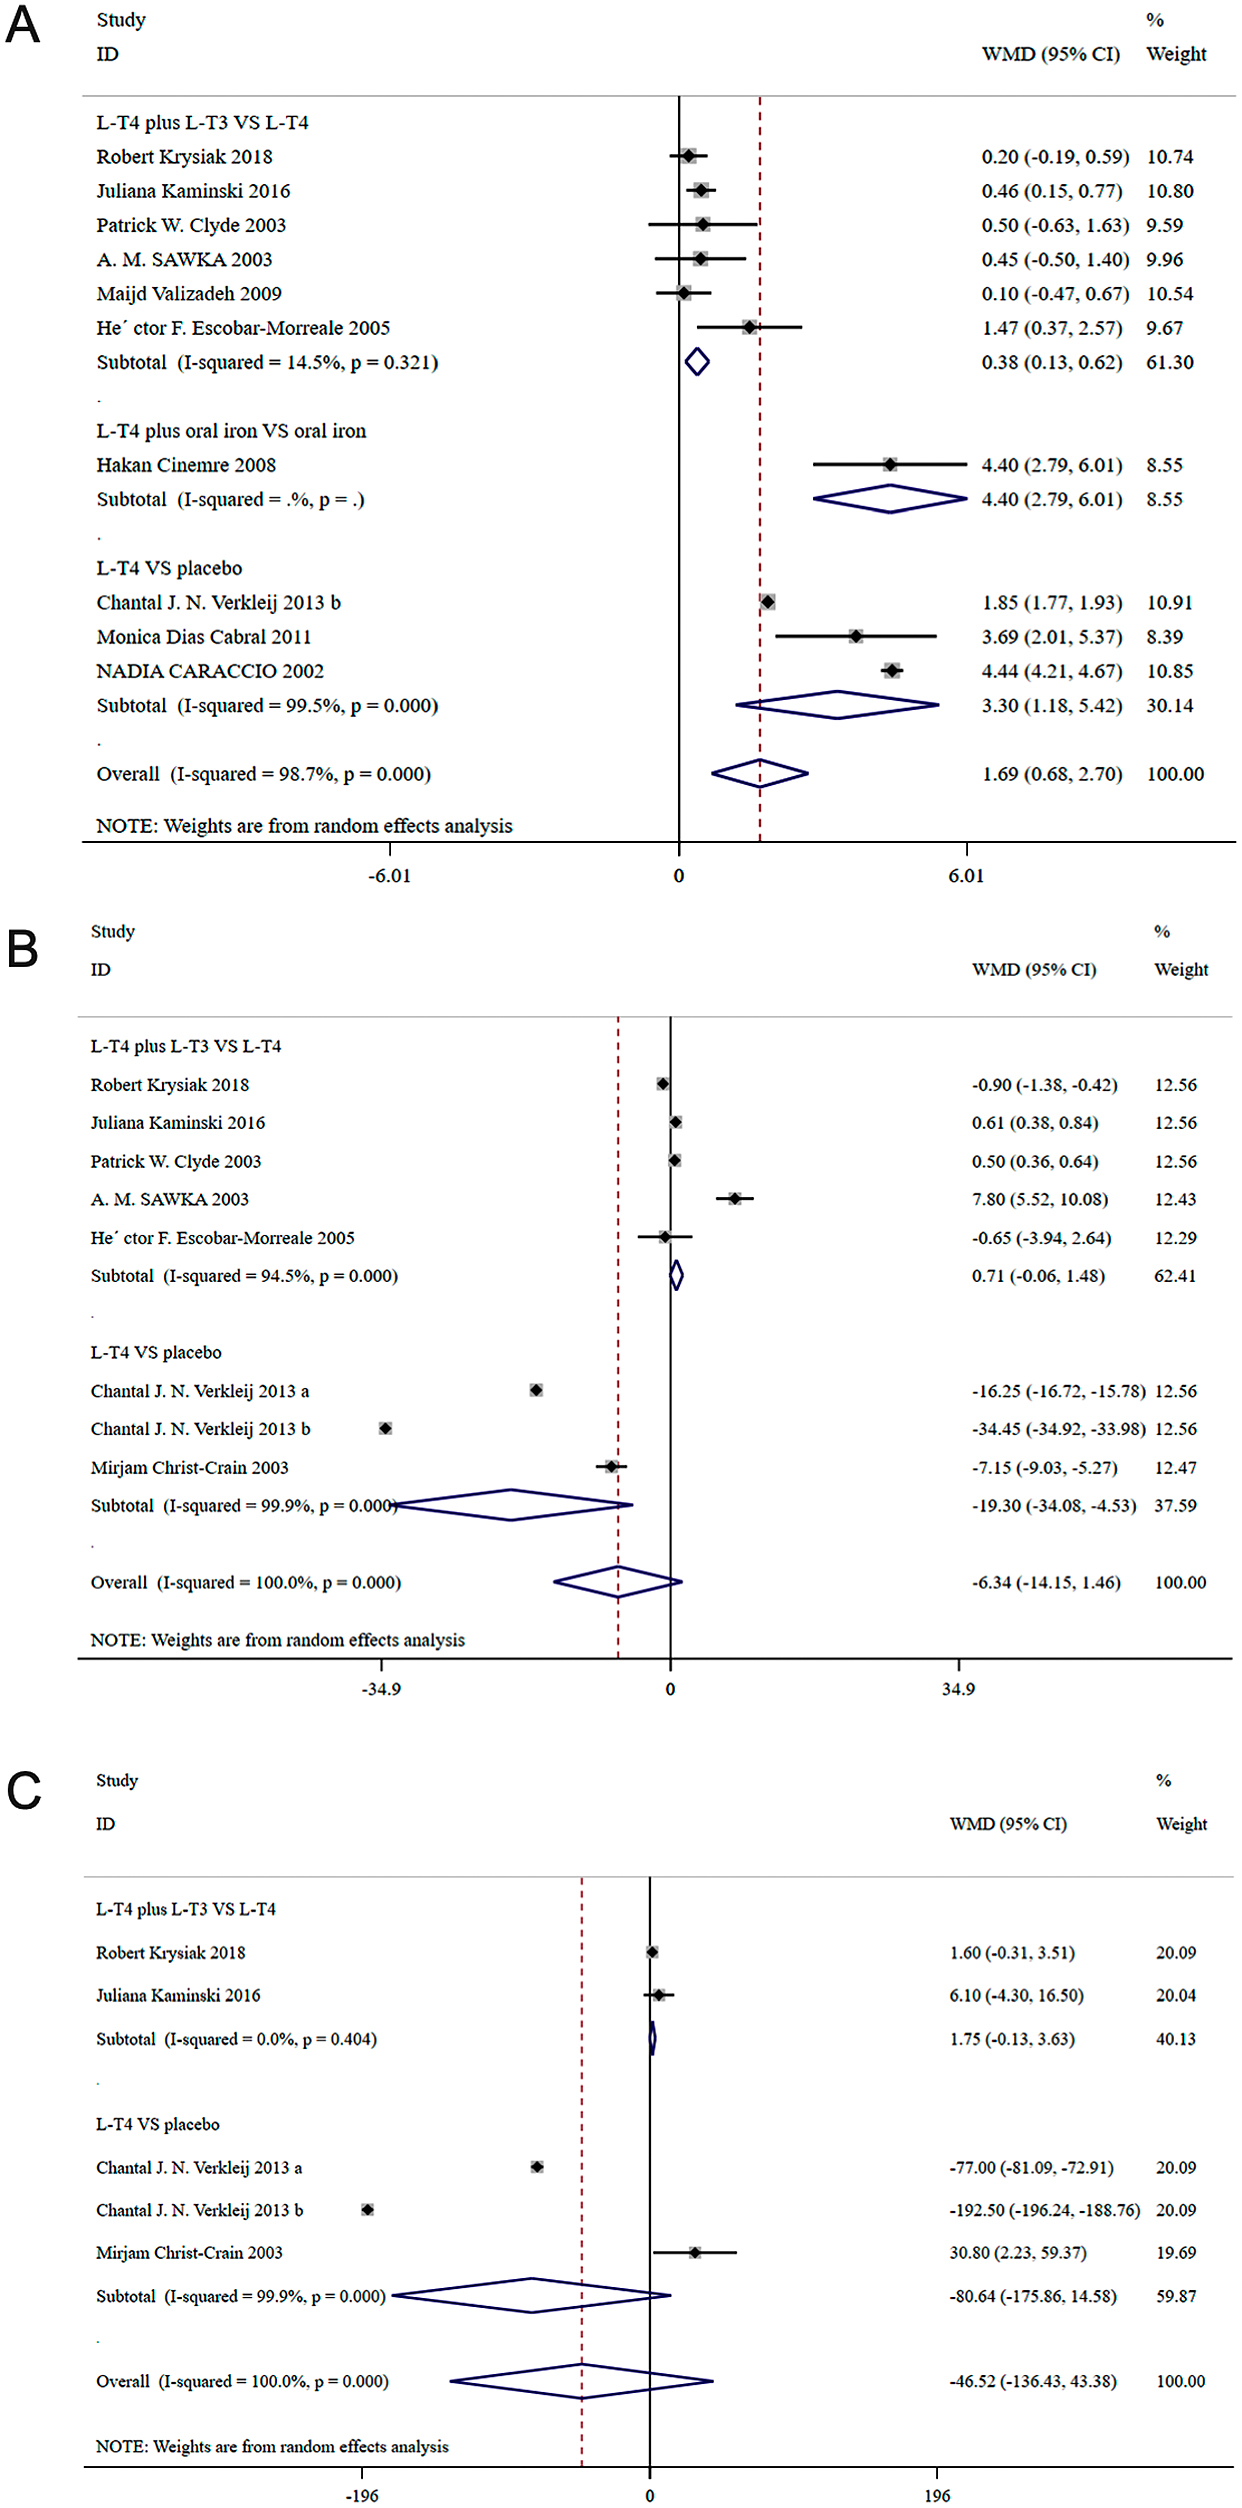
A, Forest plot for TSH; B, Forest plot for FT4; C, Forest plot for T3; in patients with hypothyroidism.

A, Forest plot for TSH; B, Forest plot for FT4; C, Forest plot for FT3; in patients with subclinical hypothyroidism.
Eight studies with 824 patients reported results on SBP and DBP. In the patients with hypothyroidism, there was no significant difference in SBP (WMD:–0.419, 95%CI: –6.371–5.534) and DBP (WMD: 2.075, 95%CI: –2.375–6.524) between the L-T4 plus L-T3 group and the L-T4 group. In patients with subclinical hypothyroidism, there was no significant difference in DBP (WMD: 0.867, 95%CI: –1.073–2.808) between the L-T4 group and the placebo group. Compared with placebo, L-T4 significantly decreased SBP (WMD: 2.540, 95%CI: 1.332–3.748).
The results are presented in Table 2 and Table 3.
| Index | N (case/control) | Interventions | WMD (95%CI) | p* | I2 | p# | p value | |
|---|---|---|---|---|---|---|---|---|
| Begg’s | Egger’s | |||||||
| SBP | 37/39 | L-T4 plus L-T3 vs. L-T4 | –0.419 (–6.371, 5.534) | 0.676 | 0.0% | 0.890 | 1.000 | — |
| DBP | 37/39 | L-T4 plus L-T3 vs. L-T4 | 2.075 (–2.375, 6.524) | 0.247 | 25.3% | 0.361 | 1.000 | — |
| FT3 | 34/34 | L-T4 plus L-T3 vs. L-T4 | –1.700 (–2.337, –1.063) | 0.344 | 0.0% | 0.000 | 1.000 | — |
| TC | 97/103 | L-T4 plus L-T3 vs. L-T4 | 20.142 (–21.426, 61.709) | 0.000 | 96.8% | 0.342 | 0.806 | 0.021 |
| TG | 67/69 | L-T4 plus L-T3 vs. L-T4 | –3.078 (–26.499, 20.344) | 0.825 | 0.0% | 0.797 | 1.000 | 0.612 |
| HDL | 67/69 | L-T4 plus L-T3 vs. L-T4 | 1.003 (–1.643, 3.648) | 0.963 | 0.0% | 0.457 | 1.000 | 0.903 |
| LDL | 82/86 | L-T4 plus L-T3 vs. L-T4 | 16.090 (–14.189, 46.369) | 0.000 | 94.7% | 0.298 | 1.000 | 0.163 |
| BMI | 32/37 | L-T4 plus L-T3 vs. L-T4 | 2.109 (–0.030, 4.248) | 0.769 | 0.0% | 0.053 | 1.000 | — |
* p value of Heterogeneity chi-squared
# p value of Pooled statistic
| Index | N (case/control) | Interventions | WMD (95%CI) | p* | I2 | p# | p value | |
|---|---|---|---|---|---|---|---|---|
| Begg’s | Egger’s | |||||||
| SBP | 401/347 | L-T4 vs. placebo | 2.540 (1.332, 3.748) | 0.199 | 31.5% | 0.000 | 1.000 | 0.866 |
| DBP | 401/347 | L-T4 vs. placebo | 0.867 (–1.073, 2.808) | 0.008 | 67.9% | 0.381 | 0.060 | 0.010 |
| T3 | 66/66 | L-T4 vs. placebo | 38.500 (23.408, 53.592) | 0.004 | 87.9% | 0.000 | 1.000 | — |
| TC | 313/315 | L-T4 vs. placebo | 5.688 (0.433, 10.944) | 0.000 | 79.5% | 0.034 | 0.917 | 0.077 |
| TG | 313/315 | L-T4 vs. placebo | –3.165 (–8.397, 2.067) | 0.000 | 74.5% | 0.236 | 0.602 | 0.348 |
| HDL | 313/315 | L-T4 vs. placebo | –0.017 (–0.076, 0.042) | 0.423 | 1.3% | 0.575 | 0.251 | 0.010 |
| LDL | 313/315 | L-T4 vs. placebo | 5.077 (–0.769, 10.922) | 0.000 | 87.1% | 0.089 | 0.602 | 0.163 |
| BMI | 165/163 | L-T4 vs. placebo | 0.091 (–0.087, 0.268) | 0.945 | 0.0% | 0.317 | 0.086 | 0.207 |
* p value of Heterogeneity chi-squared
# p value of Pooled statistic
Seven studies with 376 patients reported results on T3. In patients with hypothyroidism, there was no significant difference in T3 between the L-T4 plus L-T3 group and the L-T4 group (WMD: 1.75, 95%CI: –0.13–3.63), and between the L-T4 group and the placebo group (WMD: –80.64, 95%CI: –175.86–14.58). In patients with subclinical hypothyroidism, the value of T3 was significantly decreased in the L-T4 group vs. the placebo group (WMD: 38.500, 95%CI: 23.408–53.592).
Eleven studies with 1,019 patients reported results on FT3. In patients with hypothyroidism, the value of FT3 was significantly increased in the L-T4 plus L-T3 group vs. the L-T4 group (WMD: –1.700, 95%CI: –2.337– –1.063). In patients with subclinical hypothyroidism, the value of FT3 was significantly increased in the L-4 group vs. the placebo group (WMD: –0.46, 95%CI: –0.65– –0.27).
Twenty-two studies with 1,601 patients reported results on FT4. In patients with hypothyroidism, there was no significant difference in FT4 (WMD: 0.71, 95%CI: –0.06–1.48) between the L-T4 plus L-T3 group and the L-T4 group; compared with placebo, L-T4 significantly increased FT4 (WMD: –19.30, 95%CI: –34.08– –4.53). In patients with subclinical hypothyroidism, compared with placebo, L-T4 significantly increased FT4 (WMD: –2.49, 95%CI: –3.42– –1.56). Compared with oral iron, L-T4 plus oral iron significantly decreased FT4 (WMD: 1.59, 95%CI: 0.40–2.78).
The results are presented in Fig. 2B–C, Fig. 3B–C, Table 2 and Table 3.
TC and TGFourteen studies with 828 patients reported results on TC. Twelve studies with 764 patients reported results on TG. In patients with hypothyroidism, there was no significant difference in TC (WMD: 20.142, 95%CI: –21.426–61.709) and TG (WMD: –3.078, 95%CI: –26.499–20.344) between the L-T4 plus L-T3 group and the L-T4 group. In patients with subclinical hypothyroidism, there was no significant difference in TG (WMD: –3.165, 95%CI: –8.397–2.067) between the L-T4 group and the placebo group. Compared with placebo, L-T4 significantly decreased TC (WMD: 5.688, 95%CI: 0.433–10.944).
The results are presented in Table 2 and Table 3.
HDL and LDLTwelve studies with 764 patients reported results on HDL and LDL. In patients with hypothyroidism, there was no significant difference in HDL (WMD: 1.003, 95%CI: –1.643–3.648) and LDL (WMD: 16.090, 95%CI: –14.189–46.369) between the L-T4 plus L-T3 group and the L-T4 group. In patients with subclinical hypothyroidism, there was no significant difference in HDL (WMD: –0.017, 95%CI: –0.076–0.042) and LDL (WMD: 5.077, 95%CI: –0.769–10.922) between the L-T4 group and the placebo group.
The results are presented in Table 2 and Table 3.
BMISeven studies with 397 patients reported results on BMI. In patients with hypothyroidism, there was no significant difference in BMI (WMD: 2.109, 95%CI: –0.030–4.248) between the L-T4 plus L-T3 group and the L-T4 group. In the patients with subclinical hypothyroidism, there was no significant difference in BMI (WMD: 0.091, 95%CI: –0.087–0.268) between the L-T4 group vs. the placebo group.
The results are presented in Table 2 and Table 3.
Quality and bias assessmentAn assessment of study quality and risk of bias was performed using multiple complementary methods including funnel plots, Begg’s and Mazumdar’s rank test, and Egger’s test. There was clear symmetry in the log WMD funnel plot for TSH in studies on patients with hypothyroidism, suggesting a low publication bias risk (Fig. 4). The results of Begg’s and Mazumdar’s rank test (Z = 1.61, p = 0.107) and Egger’s test (p = 0.781) all suggested that there was not any significant risk of bias among the study results. There was clear symmetry in the log WMD funnel plot for FT4 in studies on patients with subclinical hypothyroidism, suggesting a low publication bias risk (Fig. 5). The results of Begg’s and Mazumdar’s rank test (Z = 1.39, p = 0.166) and Egger’s test (p = 0.164) all suggested that there was not any significant risk of bias among the study results.
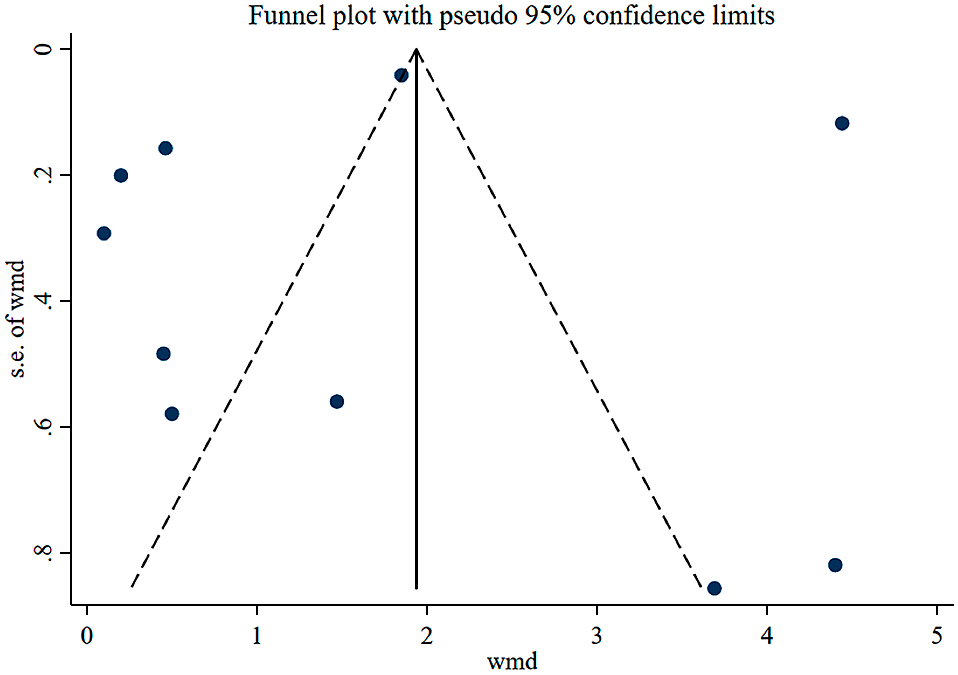
Funnel plot analysis of the included studies of patients with hypothyroidism.
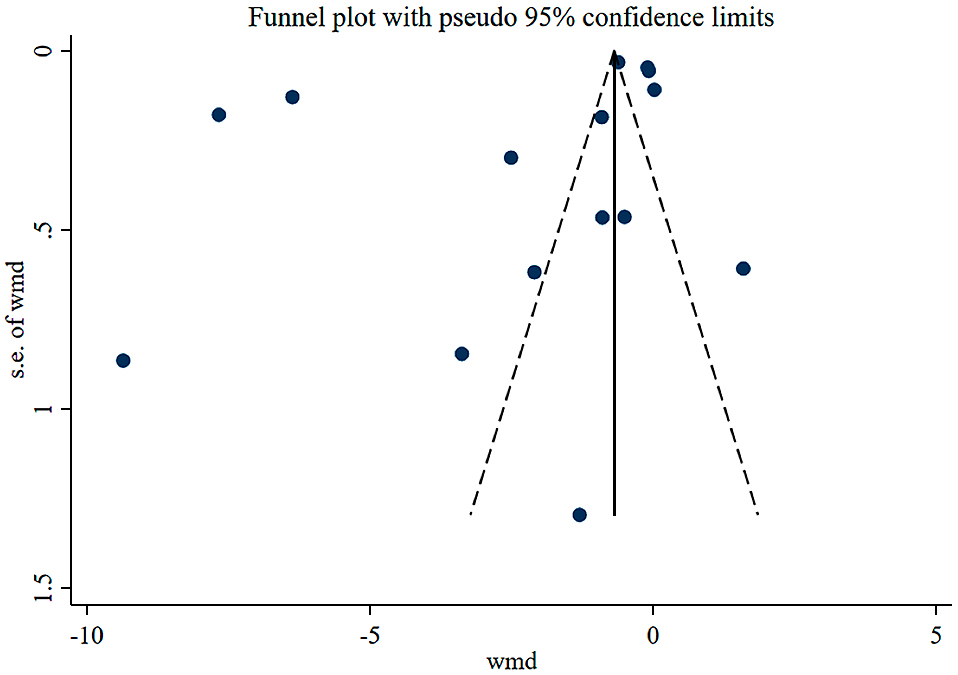
Funnel plot analysis of the included studies of patients with subclinical hypothyroidism.
Hypothyroidism is a systemic hypometabolic syndrome caused by a decrease in thyroid hormone synthesis and secretion or a lack of biological effects. The incidence of the disease is 3%–7%, mostly in women, and is positively correlated with age. Hypothyroidism is a systemic metabolic syndrome caused by a decrease in thyroid hormone synthesis and secretion or a decrease in tissue function, which is mainly divided into clinical and subclinical hypothyroidism. The prevalence of hypothyroidism is related to TSH diagnostic cut-off point value, age, gender, race and other factors, among which the prevalence of subclinical hypothyroidism is higher than that of clinical hypothyroidism. TSH, FT4 and TT4 are the first line parameters for diagnosis of clinical hypothyroidism. The diagnostic criteria for subclinical hypothyroidism are usually TSH levels higher than the reference range combined with normal FT4 levels. Hyperlipidemia is a common complication of hypothyroidism and can increase the risk of cardiovascular and cerebrovascular diseases. Therefore, it is of great significance to improve the long-term prognosis of patients with hypothyroidism. The relationship between hypothyroidism and abnormal lipid metabolism is not clear, and many studies suggest that the mechanism is mainly related to TSH elevation and decline in FT3 and FT4. Basic studies have confirmed that TSH is involved in lipid metabolism, and TSH elevations in hypothyroidism are closely related to abnormal lipid metabolism. Thyroid hormone is involved in regulating blood lipid synthesis, promote cholesterol metabolism and mobilization process and its metabolite excretion. Hypothyroidism causes elevations in TC and TG. The number and activity of LDL receptors in hepatocytes are positively correlated with thyroid function. Hypothyroidism can lead to impaired receptor-dependent LDL lowering pathways, causing LDL levels to rise. Decreased lipase activity in hypothyroidism may be the direct cause of elevated TC, TG and LDL levels.
L-T4 is the main alternative drug for the treatment of hypothyroidism. Long-term experience has proved that L-T4 has the advantages of reliable efficacy, few adverse reactions, good compliance, good intestinal absorption, long serum half-life and low treatment cost. Patients with hypothyroidism are deficient in endogenous thyroid hormones. The normal thyroid gland secretes about 85 g T4 every day. About 80% of T3 (about 26 g) is converted from peripheral T4, and only 20% (about 6.5 g) is directly secreted by the thyroid. Currently, it is generally believed that although T4 is the main hormone secreted by the thyroid, the thyroid hormone mainly binds to its nuclear receptor by T3 in the peripheral tissues. The rationale for the treatment of hypothyroidism with L-T4 is the conversion of exogenous thyroxine (T4) from peripheral tissues to the active metabolite T3. The gastrointestinal absorption rate of L-T4 tablets can reach 70%–80%. L-T4 tablets have a half-life of about 7 days, and stable serum T4 and T3 levels can be obtained by administration once daily. The dose of L-T4 needs to be individualized, depending on the patient’s condition, age, and weight. L-T4 treatment must undergo transformation from T4 to T3, and the theoretical advantage of L-T3 treatment is that it can avoid this process and directly enable active hormones to play their role. However, the drawback of L-T3 monotherapy is the absence of the substrate T4, and the level of T3 in circulation and tissue is completely dependent on exogenous hormone replacement therapy. The dose and duration of L-T3 should be strictly adhered to. Over-dose or under-dose of L-T3 can increase the risk of heart and bone side effects.
In a previous similar meta-analysis, Li X et al. [35] included 12 trials and found that levothyroxine treatment has clear benefits on TC and LDL-C in subclinical hypothyroidism patients, including those with mild subclinical hypothyroidism. Yamamoto et al. [36] concluded that there was no evidence of beneficial effects of levothyroxine therapy on obstetrical, neonatal, childhood IQ or neurodevelopmental outcomes. Current trial evidence does not support the treatment of subclinical hypothyroidism diagnosed in pregnancy.
In our study, in patients with hypothyroidism: compared with L-T4, L-T4 plus L-T3 would significantly decrease the value of TSH (WMD: 0.38, 95%CI: 0.13–0.62) and increased the value of FT3 (WMD: –1.700, 95%CI: –2.337– –1.063). There was no significant difference in SBP (WMD: –0.419, 95%CI: –6.371–5.534), DBP (WMD: 2.075, 95%CI: –2.375–6.524), T3 (WMD: 1.75, 95%CI: –0.13–3.63), FT4 (WMD: 0.71, 95%CI: –0.06–1.48), TC (WMD: 20.142, 95%CI: –21.426–61.709), TG (WMD: –3.078, 95%CI: –26.499–20.344), HDL (WMD: 1.003, 95%CI: –1.643–3.648), LDL (WMD: 16.090, 95%CI: –14.189–46.369) and BMI (WMD: 2.109, 95%CI: –0.030–4.248) between the L-T4 plus L-T3 group and the L-T4 group. The value of TSH was significantly decreased in the L-T4 plus oral iron group versus the oral iron group (WMD: 4.40, 95%CI: 2.79–6.01). There was no significant difference in T3 in the L-T4 group versus the placebo group (WMD: –80.64, 95%CI: –175.86–14.58). Compared with placebo, L-T4 significantly increased FT4 (WMD: –19.30, 95%CI: –34.08– –4.53) and decreased TSH (WMD: 3.30, 95%CI: 1.18–5.42).
In patients with subclinical hypothyroidism: compared with placebo, L-T4 significantly decreased SBP (WMD: 2.540, 95%CI: 1.332–3.748), TSH (WMD: 4.99, 95%CI: 4.29–5.69), T3 (WMD: 38.500, 95%CI: 23.408–53.592) and TC (WMD: 5.688, 95%CI: 0.433–10.944) and increased FT3 (WMD: –0.46, 95%CI: –0.65– –0.27), FT4 (WMD: –2.49, 95%CI: –3.42– –1.56). There was no significant difference in DBP (WMD: 0.867, 95%CI: –1.073–2.808), TG (WMD: –3.165, 95%CI: –8.397–2.067), BMI (WMD: 0.091, 95%CI: –0.087–0.268), HDL (WMD: –0.017, 95%CI: –0.076–0.042) and LDL (WMD: 5.077, 95%CI: –0.769–10.922) between the L-T4 group and the placebo group. Compared with oral iron, L-T4 plus oral iron significantly decreased FT4 (WMD: 1.59, 95%CI: 0.40–2.78).
However, there are certain limitations to the present analysis, which are as follows: (1) the number of studies included in the subgroup analysis is limited. (2) individual studies were varied in exclusion/inclusion criteria. (3) we only included RCT. (4) the severity of hypothyroidism varied among the studies. (5) the kits used to measure TSH, FT4 and FT3 were different among the studies. Kits by different manufacturers had significant effects on the results of TSH, FT4 and FT3. For the limited number of included studies, we have already carried out subgroup analysis by diseases and interventions. If we continued subgroup analysis by kits, there would be fewer studies in the subgroup, so the results would have no more clinical significance. (6) The doses of L-T4 and L-T3 were varied among the studies. In most included studies, the doses of L-T4 and L-T3 started from a low dose, and gradually increased according to clinical symptoms and laboratory test results, so it’s not a fixed dose that may have different effects on the thyroid hormones. (7) Pooled data were analyzed, as individual patient data was not available, precluding more in-depth analyses.