Abstract
Glucagon dysfunction as well as insulin dysfunction is associated with the pathogenesis of type 2 diabetes (T2DM). However, it is still unclear whether the measurement of plasma glucagon levels is useful in understanding the pathophysiology of T2DM. We recently reported that sandwich ELISA provides more accurate plasma glucagon values than conventional RIA in healthy subjects. Here we used sandwich ELISA as well as RIA to assess plasma glucagon levels, comparing them in T2DM patients and healthy subjects during oral glucose (OGTT) or meal tolerance tests (MTT). We confirmed that sandwich ELISA was able to detect more significant difference between healthy subjects and T2DM patients in the fasting levels and the response dynamics of plasma glucagon than RIA. We also found significant differences in the following glucagon parameters: (1) fasting glucagon, (2) the area under the curve (AUC) of glucagon in OGTT, and (3) the change in glucagon between 0 and 30 min (ΔGlucagon0–0.5h) in OGTT or MTT. Among these, the most apparent difference was ΔGlucagon0–0.5h in MTT. When we divided T2DM patients into two groups whose ΔGlucagon0–0.5h in MTT was either below or above the maximum value in healthy subjects, the group with higher ΔGlucagon0–0.5h showed more significant impairment of glucose tolerance. These results suggest that the assessment of plasma glucagon levels by sandwich ELISA might enhance our understanding of the pathophysiology of T2DM.
FOR THE PAST TWO DECADES, insulin resistance has been considered the primary factor responsible for the development of type 2 diabetes mellitus (T2DM). However, insulin resistance leads to T2DM only when accompanied by pancreatic islet cell dysfunction. Of these cells, β-cells have received much more attention than α-cells in diabetes research. However, α-cells produce glucagon, which promotes hepatic gluconeogenesis and glycogenolysis, leading to increased basal hepatic glucose production. Glucagon reportedly plays a major role in hyperglycemia development in T2DM [1-3], suggesting a need for further studies of α-cells.
Because of the accumulating in vivo evidence suggesting beneficial effects of glucagon suppression in diabetic animals [4-8], glucagon has recently attracted attention as a new target in the treatment of diabetes patients. Indeed, several glucagon receptor antagonists have been reported to lower blood glucose and HbA1c levels effectively in T2DM patients [9, 10], although these agents have been discontinued due to undesirable side effects, such as increased blood pressure and body weight and fatty liver [11, 12].
One of the hindrances to glucagon (α-cell) research has been the inaccuracy of glucagon measurements in plasma. Radioimmunoassay (RIA) using an antibody specific for the glucagon C-terminus has been used as a glucagon-specific assay, but it lacks sensitivity and specificity for measuring glucagon in plasma. Therefore, a sandwich ELISA that uses two antibodies for improved specificity was required and developed [13]. Although the accuracy of many commercial glucagon assay kits remains problematic [14], more accurate sandwich ELISA kits were developed by Mercodia and are commercially available [15]. It is difficult to interpret the existing literature, as it is based on the results of incompletely characterized assays that have suboptimal sensitivity and specificity [16].
We recently developed a quantitative method for measuring plasma glucagon, using liquid chromatography (LC)-high-resolution mass spectrometry (HRMS) [17]. This measurement system enables accurate measurement of plasma glucagon as well as evaluation of the reliability of existing glucagon assays. In a comparative analysis of plasma glucagon measured by sandwich ELISA and LC-HRMS, values determined by the two methods were highly correlated during OGTT and MTT in healthy subjects [17] and during MTT in T2DM patients [18]. Therefore, we consider sandwich ELISA sufficiently reliable to use it to evaluate plasma glucagon levels in T2DM patients as well as in healthy subjects. Sandwich ELISA is a multiwell plate assay that can measure multiple samples at the same time and is therefore expected to be an effective method for measuring clinical samples.
We have reported that T2DM patients have higher plasma glucagon levels than healthy subjects by using a glucagon sandwich ELISA [19]. In the present study, we performed OGTT and MTT in healthy individuals and T2DM patients, and evaluated changes in plasma glucagon levels by using sandwich ELISA and RIA in order to reconfirm the difference between these glucagon measurement systems and investigate whether glucagon measurement could clarify the pathophysiology of T2DM.
Materials and Methods
Participants
Samples were taken from 19 healthy subjects with approval from the Ethical Review Committee of Maebashi Norte Hospital. The samples from T2DM patients were taken from 29 subjects with approval from the Ethical Review Committees of Juntendo University Hospital (10 subjects), Hyogo College of Medicine Hospital (2 subjects), and Maebashi Norte Hospital (17 subjects). The inclusion and exclusion criteria for the healthy subjects and diabetes patients are described in the supplemental information. The present study was also approved by the Ethical Review Committee of Gunma University (registration number 1529) and registered with the University Hospital Medical Information Network Center (UMIN 000027852).
Oral glucose tolerance test (OGTT) and meal tolerance test (MTT)
Healthy subjects and T2DM patients from whom consent had been obtained were enrolled after undergoing a pre-enrollment test and subjected to glucose loading (Trelan-G75 225 mL × 1 bottle containing 75 g of glucose; Yoshindo Inc., Japan) and meal loading (Sanet-SA 200 mL × 2 packs, containing 22.0 g of protein, 8.8 g of fat, and 64.0 g of carbohydrate; Nutri Co. Yokkaichi, Japan). OGTT and MTT were performed on different dates with the same participants after overnight fasting. Blood samples were collected before and 0.5, 1, 2, and 3 h after loading.
Sample collection
Blood samples were collected using evacuated tubes (BD P800, Becton Dickinson, Tokyo, Japan). For measurement of blood glucose levels, blood sampling tubes containing sodium fluoride were used. Plasma was separated by centrifuging for 20 min at 3,000 rpm at 4°C, dispensed into plastic tubes to avoid freeze-thaw cycles, and stored at –20°C or below.
Regents
Plasma glucagon was measured using sandwich ELISA (Mercodia AB, Uppsala, Sweden) and conventional RIA kits (DIAsource ImmunoAssays, Louvain-la-Neuve, Belgium, and Merck Millipore, Burlington, MA, USA, hereafter RIA1 and RIA2, respectively). Plasma GLP-1 and GIP were measured by using a GLP-1 Active form (high sensitivity) Assay Kit and Human GIP Active form Assay Kit (both from Immuno-Biological Laboratories, Fujioka, Japan). Plasma insulin was measured using a chemiluminescent enzyme immunoassay (Lumipulse Presto insulin, Fujirebio, Japan). Blood glucose was measured using the hexokinase UV method (CicaLiquid Glu J, Kanto Chemical, Japan). Other biochemical parameters for diagnoses of liver and kidney function, lipid metabolism, and HbA1c levels were measured at the individual facilities.
Calculations
HOMA-IR [20], as the index of insulin sensitivity, and HOMA-β [20] and the insulinogenic index [21], as indices of pancreatic β-cell function, were calculated using the results from OGTT. The areas under the curve of blood glucose (AUCBG), plasma glucagon (AUCGlucagon), insulin (AUCInsulin) and GLP-1 (AUCGLP-1) during OGTT or MTT were calculated using the trapezoidal method [22]. The changes in blood glucose, plasma glucagon, insulin and GLP-1 levels from fasting to 30 minutes after loading (ΔBG0–0.5h, ΔGlucagon0–0.5h, ΔInsulin0–0.5h and ΔGLP-10–0.5h, respectively) in OGTT and MTT were calculated and used for analysis.
Statistical analysis
Data are expressed as the mean ± SD, except for data with unequal variance on clinical characteristics of the participants, which are expressed as the medians with the first and third quartile. Differences between groups were assessed by using Student’s or Welch’s t-test. Relationships between parameters were assessed using Pearson’s correlation coefficient. A p-value of less than 0.05 was considered significant. Statistical analyses were performed using IBM SPSS Statistics version 25 software.
Results
Clinical characteristics of the participants
There was no significant difference in sex ratio or age between the 19 healthy subjects and 29 T2DM patients analyzed in this study (Table 1).
Table 1
Clinical characteristics of the participants
|
Healthy subjects |
T2DM patients |
p-value |
| N |
19 |
29 |
|
| Female |
10 |
13 |
0.769 |
| Age (yr) |
49 (46, 57) |
53.3 ± 8.7 |
0.303 |
| HbA1c (%) |
5.3 ± 0.2 |
6.4 (6.2, 6.9) |
<0.001*** |
| HOMA-IR |
0.84 (0.54, 1.15) |
2.42 (1.66, 4.65) |
0.016* |
| HOMA-β |
48.5 ± 20 |
71.4 ± 52.7 |
0.079 |
| Insulinogenic index |
0.93 (0.51, 1.64) |
0.40 (0.22, 0.61) |
0.095 |
| Body mass index |
22.5 ± 2.5 |
27.6 ± 4.7 |
<0.001*** |
| AST (U/L) |
21.4 ± 3.8 |
22 (19.5, 42.5) |
0.048* |
| ALT (U/L) |
16.8 ± 4 |
26 (20, 48) |
0.005** |
| γ-GTP (U/L) |
19 (14, 25) |
33 (22, 89) |
0.017* |
| Total cholesterol (mg/dL) |
210.1 ± 30.4 |
204 (191, 216) |
0.327 |
| HDL (mg/dL) |
72.5 ± 15.7 |
55.3 ± 14.6 |
<0.001*** |
| LDL (mg/dL) |
116.1 ± 25 |
116 ± 22.5 |
0.989 |
| Triglyceride (mg/dL) |
87.4 ± 33.3 |
127 (93, 180.5) |
0.017* |
| Blood urea nitrogen (mg/dL) |
12.9 (11.7, 15.0) |
12.5 ± 2.6 |
0.261 |
| Creatinine (mg/dL) |
0.7 ± 0.2 |
0.7 ± 0.2 |
0.689 |
Data are expressed as the mean ± SD or median (first quartile, third quartile). * p < 0.05, ** p < 0.01, *** p < 0.001.
T2DM patients in this study had no history of medication for diabetes and were considered to be in the early stage of diabetes. Therefore, although HbA1c and the insulin resistance index, HOMA-IR, were significantly higher in the T2DM patients, there was no significant difference in pancreatic β-cell function index, HOMA-β, or insulinogenic index compared with the healthy subjects (Table 1). Significant differences between the two groups were observed in body mass index, AST, ALT, γ-GTP, HDL, and triglycerides (Table 1).
Plasma glucagon levels measured by sandwich ELISA were significantly higher in T2DM patients than in healthy subjects during OGTT
During OGTT, blood glucose levels in T2DM subjects were significantly higher than in healthy subjects at all time points (Fig. 1A). Fasting plasma insulin levels were higher in T2DM patients than in healthy subjects (Fig. 1B). Insulin response to glucose showed a peak at 30 min in healthy subjects, while it was sustained at higher levels and longer in T2DM patients (Fig. 1B). Plasma glucagon levels measured by sandwich ELISA decreased after glucose loading and then returned to the initial level in healthy subjects (Fig. 1C). By contrast, plasma glucagon levels in T2DM patients were significantly higher at the fasted point and showed a delayed decrease after glucose loading compared with the healthy subjects (Fig. 1C). Although RIA1 measurement also showed significantly higher glucagon levels in T2DM patients than in healthy subjects, no clear change was observed during OGTT in both healthy subjects and T2DM patients (Fig. 1D). Moreover, RIA2 measurement did not show any difference in plasma glucagon levels between healthy subjects and T2DM patients (Fig. 1E). Regarding plasma GLP-1 and GIP levels, a slight but significant difference was observed between the two groups at some point during OGTT (Fig. 1F, 1G).

As in OGTT, blood glucose and plasma insulin levels were higher in T2DM patients than in healthy subjects during MTT (Fig. 2A, 2B). Plasma glucagon levels measured by sandwich ELISA gradually increased after meal loading in healthy subjects. By contrast, plasma glucagon levels in T2DM patients spikily increased 30 min after meal load and then decreased to the same level as in healthy subjects (Fig. 2C). RIA1 measurement showed consistently higher plasma glucagon levels (Fig. 2D), whereas RIA2 showed lower glucagon levels in T2DM patients than in healthy subjects (Fig. 2E). Consistent with the results in OGTT (Fig. 1D, 1E), RIA1 and RIA2 showed completely different patterns in plasma glucagon from sandwich ELISA. Very small differences in GLP-1 and GIP were seen between the two groups during MTT (Fig. 2F, 2G).

We previously reported that sandwich ELISA showed much higher correlation with LC-HRMS in glucagon measurements than RIA [17]. This study also confirmed these important results, namely that sandwich ELISA provides more reliable glucagon measurement than RIA. Therefore, in the further analysis of glucagon in this study we used sandwich ELISA.
Glucagon-related parameters significantly correlated with blood glucose and HbA1c levels in T2DM patients
Are glucagon levels during OGTT or MTT related to the disorder of glucose homeostasis in T2DM patients? To address this question, we performed a correlation analysis of glucagon with glucose-related parameters.
Significant differences between healthy and T2DM subjects were observed in the following glucagon-related parameters: (1) fasting glucagon in OGTT and MTT, (2) AUCGlucagon in OGTT, and (3) ΔGlucagon0–0.5h in OGTT and MTT (Fig. 1C and 2C, Supplementary Fig. 1). Therefore, we investigated the correlations of these parameters with blood glucose-related parameters, including fasting blood glucose, ΔBG0–0.5h, AUCBG, and HbA1c.
ΔGlucagon0–0.5h in MTT showed significant correlations with all blood glucose-related parameters (Tables 2 and 3, Supplementary Figs. 2 and 3). Fasting glucagon also showed significant correlation with fasting blood glucose, ΔBG0–0.5h and AUCBG, but not with HbA1c. ΔGlucagon0–0.5h in GTT was also significantly correlated with fasted blood glucose and HbA1c, but not with ΔBG0–0.5h and AUCBG. AUCGlucagon in OGTT showed significant correlation with fasting blood glucose, AUCBG and HbA1c but not with ΔBG0–0.5h, while AUCGlucagon in MTT had no significant correlation with glucose-related parameters. Each correlation mapping is shown in Supplementary Figs. 2 and 3. These results suggested that dysregulation of the glucagon response might be associated with the disorder of blood glucose regulation in T2DM.
Table 2
Correlations between glucagon-related parameters and blood glucose-related parameters during OGTT
|
|
Fasting BG |
ΔBG0–0.5h |
AUCBG |
HbA1c |
| Fasting glucagon |
r |
0.250 |
0.280 |
0.391 |
0.275 |
|
p |
0.086 |
0.054 |
0.006** |
0.058 |
| AUCGlucagon |
r |
0.383 |
0.263 |
0.392 |
0.331 |
|
p |
0.007** |
0.071 |
0.006** |
0.022* |
| ΔGlucagon0–0.5h |
r |
0.459 |
0.154 |
0.258 |
0.309 |
|
p |
0.001** |
0.295 |
0.076 |
0.033* |
r, Correlation coefficient; p, p-value. * p < 0.05, ** p < 0.01.
Table 3
Correlations between glucagon-related parameters and blood glucose-related parameters during MTT
|
|
Fasting BG |
ΔBG0–0.5h |
AUCBG |
HbA1c |
| Fasting glucagon |
r |
0.311 |
0.361 |
0.364 |
0.216 |
|
p |
0.031* |
0.012* |
0.011* |
0.140 |
| AUCGlucagon |
r |
0.189 |
0.170 |
0.189 |
0.065 |
|
p |
0.199 |
0.243 |
0.199 |
0.662 |
| ΔGlucagon0–0.5h |
r |
0.547 |
0.473 |
0.531 |
0.450 |
|
p |
<0.001*** |
<0.001*** |
<0.001*** |
0.001** |
r, Correlation coefficient; p, p-value. * p < 0.05, ** p < 0.01, *** p < 0.001.
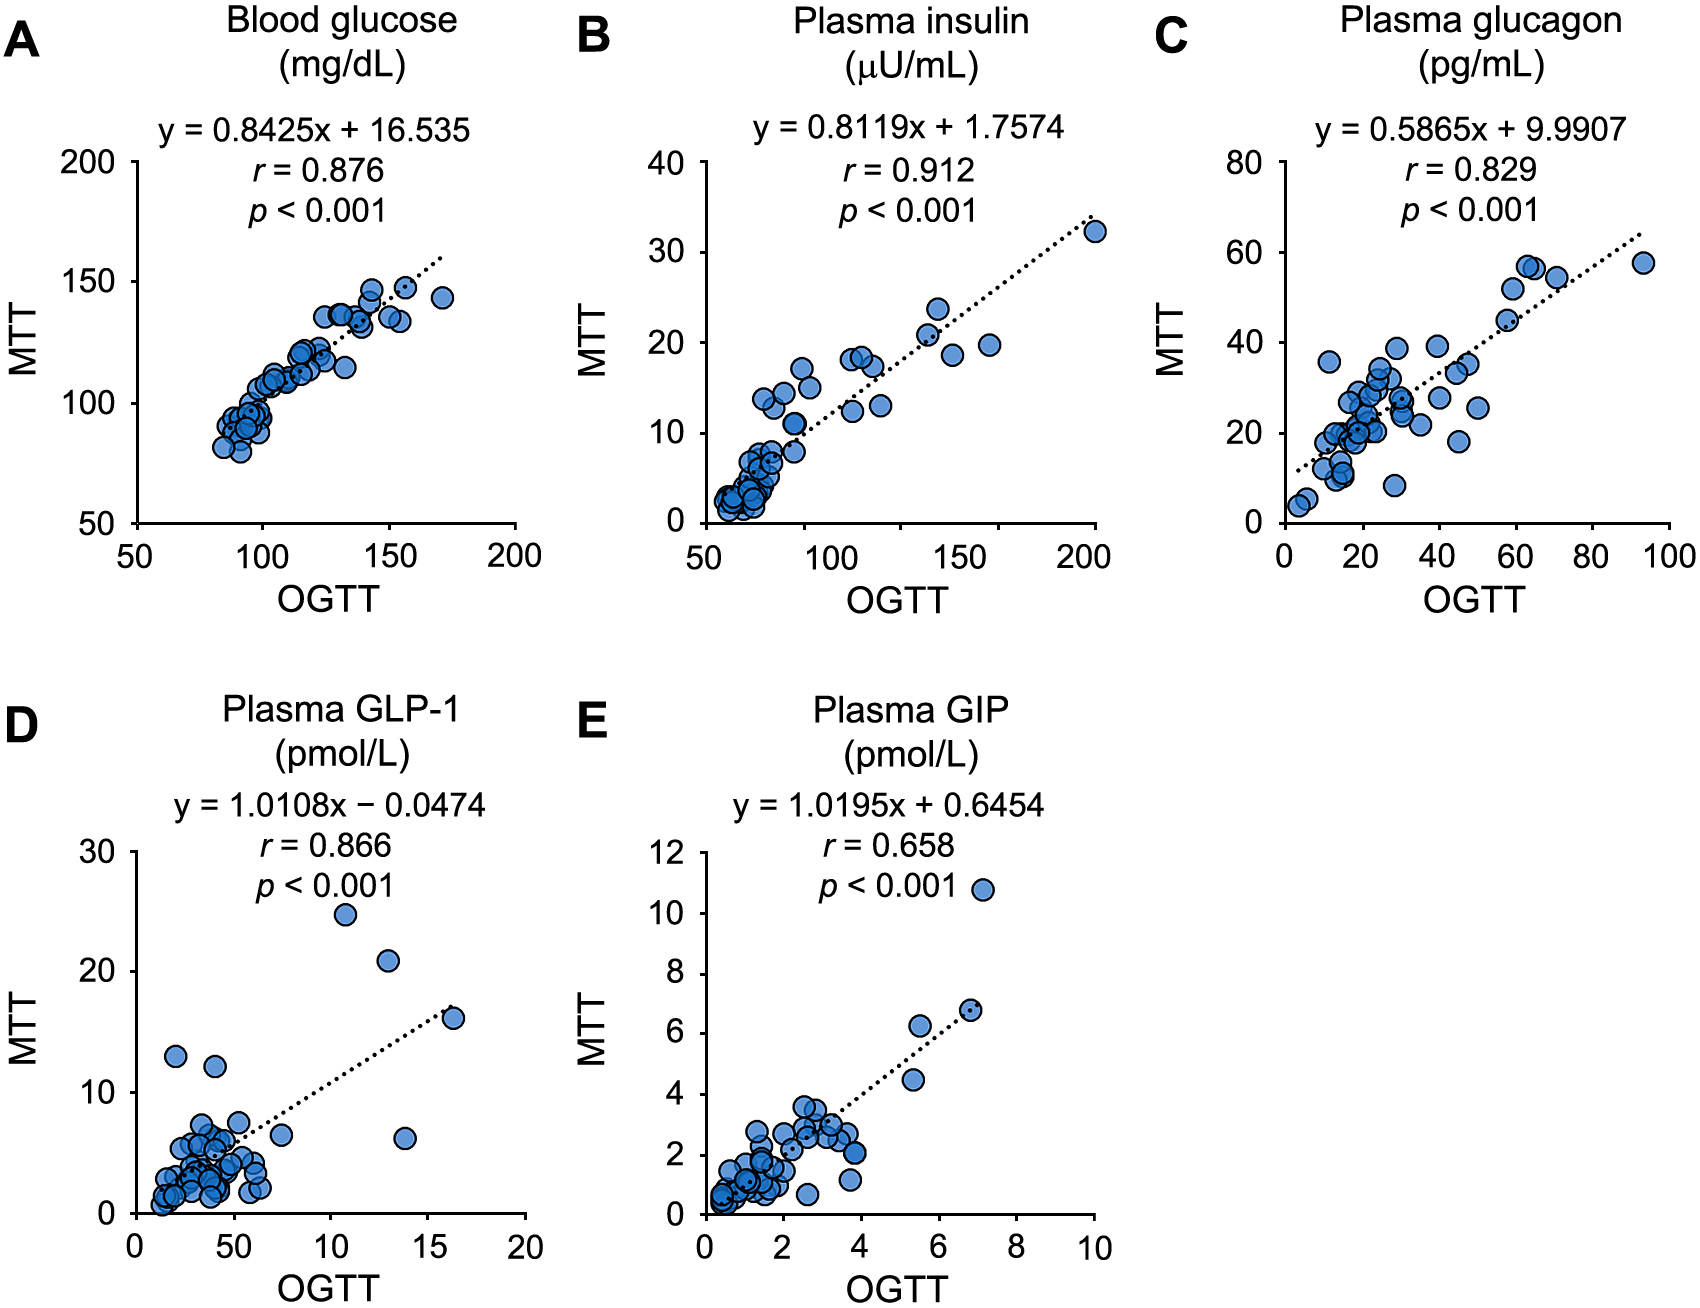
Our next question was which glucagon-related parameter was more useful for the evaluation of glucose intolerance in T2DM. Before answering this question, we confirmed the strong correlations in fasting blood glucose and various hormone levels between OGTT and MTT performed on the different dates (Supplementary Fig. 4). These we expected these tests to provide good reproducibility and consistent results, and it seemed reasonable to analyze the diabetic state of each subject based on the results of individual OGTT and MTT.
Histograms of the four glucagon-related parameters correlated with the blood glucose-related parameters were prepared, and the data distributions from the healthy subjects and T2DM patients were compared (Fig. 3). All four glucagon-related parameters had wider distributions that were shifted to the right in T2DM patients compared with the same parameters in healthy subjects. Therefore, the T2DM patients were divided into two groups based on the maximum parameter values of the healthy subjects and compared. ΔGlucagon0–0.5h in MTT, which had the highest correlation with blood glucose-related parameters, exceeded the reference value (i.e., the maximum value in the healthy subjects, 35 pg/mL) in 13 of 29 T2DM patients (Fig. 3A). In OGTT and MTT, the subgroup with higher ΔGlucagon0–0.5h (over 35 pg/mL) in MTT had significantly higher blood glucose levels than the subgroup with lower ΔGlucagon0–0.5h (below 35 pg/mL) (Fig. 4). There was no apparent difference in plasma GLP-1 and GIP levels between the two subgroups (Supplementary Fig. 5).

Fasting glucagon was analyzed using the average of the data in OGTT and MTT (Fig. 3B). Since the fasting glucagon of healthy subjects had an outlier (ID: 25, T = 2.85, and p = 0.011 by the Smirnov-Grubbs test), the second-largest value (34.0 pg/mL) was used as the reference value. As a result, 9 of 29 T2DM patients exceeded this value. In OGTT, the blood glucose levels in the subgroup with higher fasting glucagon (over 34.0 pg/mL) were significantly higher than in the subgroup with lower fasting glucagon (below 34.0 pg/mL) (Supplementary Fig. 6). However, there was no significant difference in blood glucose levels between the subgroups in MTT (Supplementary Fig. 6).
With regard to AUCglucagon and ΔGlucagon0–0.5h in OGTT, the data from T2DM patients had a wide distribution and overlapped with the data from healthy subjects; thus, the numbers of T2DM patients whose values exceeded the maximum value of healthy subjects were only 7 and 6 of 29, respectively. (Fig. 3C, 3D). When T2DM patients were divided into the subgroups based on these criteria, there was no significant difference in blood glucose levels between the subgroups (Supplementary Figs. 7 and 8).
Among these four glucagon-related parameters, ΔGlucagon0–0.5h in MTT displayed the largest difference between T2DM patients and healthy subjects. We concluded that T2DM patients with high ΔGlucagon0–0.5h values in MTT might have more profound characteristics of glucose intolerance than currently thought, and that the assessment of plasma glucagon levels by sandwich ELISA might contribute to the understanding of the pathophysiology of T2DM.
Negative correlation was not observed between glucagon secretion and insulin or GLP-1 secretion
Because insulin and GLP-1 are known to suppress glucagon secretion, insulin-related or GLP-1-related parameters are expected to show a negative correlation with glucagon-related parameters. However, statistic analysis revealed that such a negative correlation was not observed during OGTT and MTT (Supplementary Table 1 and Supplementary Table 2). Nonetheless, enhanced glucagon secretion in T2DM could be attributed to impaired insulin secretion caused by β-cell dysfunction. Therefore, we divided T2DM patients into the two subgroups whose insulinogenic index was higher or lower than 0.4, then compared their plasma glucagon levels during OGTT and MTT. As shown in Supplementary Fig. 9, there was no significant difference in plasma glucagon levels between these two groups.
Discussion
A recent advance in glucagon research is improved glucagon measurement through the development of a glucagon sandwich ELISA [15]. We evaluated the relative reliability of sandwich ELISA and RIA by comparing them with the most accurate LC-HRMS system [17]. Here, we measured glucagon by using the sandwich ELISA and two conventional RIA kits, comparing healthy subjects with T2DM patients during OGTT and MTT. Plasma glucagon levels measured by the RIA kits were very different from those measured using the sandwich ELISA, as reported previously [23]. Thus, in the further analysis of glucagon in this study, we used the glucagon values measured by sandwich ELISA.
We previously reported an increase in fasting plasma glucagon levels and delayed suppression of glucagon after glucose loading in screen-detected T2DM subjects using a sandwich ELISA [19]. Færch et al. reported similar results in a large cohort (N = 1,437) study of Caucasian subjects [24]. Notably, they extracted plasma samples with ethanol before measuring glucagon with the established RIA [14, 25-28]. Reaction specificity is known to be improved by appropriate plasma pretreatment, even in conventional RIA, but its procedural complexity might reduce its quantitative reliability. Here, the sandwich ELISA enabled us to obtain similar results without pretreating the plasma, while using a much smaller number of samples than were included in the cohort study [24]. These results indicate that glucagon sandwich ELISA is a simple, effective, and reliable method for clinical examinations that are often conducted in variable conditions.
Contrary to the suppression of glucagon secretion by glucose loading, glucagon secretion is enhanced by meal loading in healthy subjects [15, 17, 29, 30] and T2DM patients [18]. We confirmed these opposite plasma dynamics of glucagon in the healthy subjects. More importantly, we revealed that the increase in plasma glucagon levels after meal loading was markedly higher in T2DM patients than in healthy subjects. Delayed and attenuated suppression of glucagon secretion after glucose loading in T2DM patients (Fig. 1C) could be explained by impaired insulin response in α-cells [31, 32]. However, enhanced glucagon secretion as well as enhanced insulin secretion after meal loading in T2DM patients (Fig. 2B, 2C) cannot be explained by a simple paracrine mechanism. Moreover, we could not detect significantly negative correlation between insulin-related parameters and glucagon-related parameters (Supplementary Table 1 and Supplementary Fig. 9). Glucagon secretion is regulated by various factors, including hormonal endocrine, paracrine, autocrine, and autonomic nervous regulation [33], while the detailed mechanism of impaired glucagon secretion in α-cells in T2DM is largely unknown. In this study, the healthy subjects and T2DM patients underwent both OGTT and MTT. Therefore, the difference in changes in plasma glucagon levels between OGTT and MTT should be due simply to the difference in the nutrients. This suggests that the glucagon secretory response to some kinds of nutrients might be disturbed in T2DM.
As described before, fasting plasma glucagon levels in early-stage diabetes (screen-detected T2DM) were associated with the index of insulin sensitivity [19, 24]. An augmented glucagon response to intravenous arginine administration has been reported to be associated with insulin resistance [34] and a risk factor for future worsening glucose intolerance [35]. In the present study, fasting plasma glucagon levels also exhibited a significantly positive correlation with HOMA-IR (r = 0.435, p < 0.01, n = 48, data not shown). Analysis of the data also revealed that the early glucagon response (ΔGlucagon0–0.5h) in MTT exhibited significant correlations with blood glucose-related parameters. Furthermore, we demonstrated that the T2DM patients whose ΔGlucagon0–0.5h in MTT was higher than the maximum value in the healthy subjects had worse impairment of glucose tolerance. Hence, we suggest that analyzing changes in plasma glucagon levels, in addition to changes in blood glucose or plasma insulin levels, is useful in understanding the pathophysiology of T2DM. In this study, among the four glucagon-related parameters, fasting plasma glucagon, AUCGlucagon in GTT, and ΔGlucagon0–0.5h in GTT seemed to be less useful than ΔGlucagon0–0.5h in MTT because, as shown in the histograms of these parameters, the data distributions of T2DM patients and healthy subjects largely overlapped. Therefore, the number of T2DM patients whose parameter value exceeded the reference value was small. The lack of a sufficient number of subjects to conduct a thoughtful statistical analysis is the limitation of this study.
Plasma GLP-1 and GIP levels did not show marked differences between healthy subjects and T2DM patients in this study. Consistent with this study, meta-analyses have reported that T2DM patients retain GLP-1 and GIP responsiveness during OGTT and MTT [36, 37]. Incretin might affect glucagon secretion and impaired glucose tolerance in T2DM patients [38, 39], but there was no significantly negative correlation between GLP-1-realted parameters and glucagon-related parameters during OGTT and MTT (Supplementary Table 2). Administration of GLP-1 receptor agonist suppresses excessive postprandial glucagon secretion and improves postprandial hyperglycemia in T2DM patients, however, endogenous GLP-1 alterations seemingly have mild effect on glucagon secretion. The GLP-1 and GIP data in this study do not support the measurement of plasma incretin concentration as helpful in understanding the pathophysiology of T2DM.
In conclusion, the measurement of plasma glucagon levels by sandwich ELISA might contribute to a better understanding of the pathophysiology of T2DM. We expect that, in addition to blood glucose and insulin, glucagon will become a diagnostic marker for T2DM, and strongly hope that the integrated use of these markers will inform a new classification of T2DM and future personalized treatment of this disease.
Supplemental Information
The inclusion and exclusion criteria for the healthy subjects and diabetes patients.
The inclusion criteria for the healthy subjects were: aged 20 to 69 years; HbA1c of less than 6.2%; and not taking regular medication. The inclusion criteria for the T2DM patients were: aged 20 to 69 years; and not using anti-diabetic medication.
The exclusion criteria for the healthy subjects and T2DM patients were: 1) abnormal liver or kidney function test measurements; 2) pregnancy with estimated date of confinement within 12 weeks; 3) cardiopulmonary dysfunction; 4) symptoms of anemia; 5) doctor’s diagnosis of chronic or acute infectious disease; 6) ongoing participation in another clinical study at the commencement date of the present study; 7) judgment of ineligibility for other reasons by the principal investigator.
Supplementary Table 1
Correlations between insulin-related parameters and glucagon-related parameters during OGTT and MTT.
|
|
|
Fasting glucagon |
AUCGlucagon |
ΔGlucagon0–0.5h |
| OGTT |
Fasting insulin |
r |
0.459 |
0.327 |
–0.088 |
|
p |
0.001** |
0.023* |
0.552 |
| AUCInsulin |
r |
0.366 |
0.153 |
–0.229 |
|
p |
0.011* |
0.299 |
0.117 |
| ΔInsulin0–0.5h |
r |
0.149 |
–0.013 |
–0.228 |
|
p |
0.313 |
0.929 |
0.120 |
| Insulinogenic index |
r |
–0.158 |
–0.266 |
–0.232 |
|
p |
0.283 |
0.067 |
0.113 |
| MTT |
Fasting insulin |
r |
0.458 |
0.225 |
0.364 |
|
p |
0.001** |
0.125 |
0.011* |
| AUCInsulin |
r |
0.347 |
0.223 |
0.369 |
|
p |
0.016* |
0.127 |
0.010* |
| ΔInsulin0–0.5h |
r |
0.233 |
0.169 |
0.188 |
|
p |
0.111 |
0.251 |
0.201 |
| Insulinogenic index |
r |
–0.070 |
–0.067 |
–0.265 |
|
p |
0.634 |
0.653 |
0.069 |
r, Correlation coefficient; p, p-value. * p < 0.05, ** p < 0.01.
Supplementary Table 2
Correlations between GLP-1-related parameters and glucagon-related parameters during OGTT and MTT.
|
|
|
Fasting glucagon |
AUCGlucagon |
ΔGlucagon0–0.5h |
| OGTT |
Fasting GLP-1 |
r |
0.254 |
0.227 |
0.116 |
|
p |
0.082 |
0.121 |
0.431 |
| AUCGLP-1 |
r |
–0.160 |
0.104 |
0.395 |
|
p |
0.277 |
0.483 |
0.006** |
| ΔGLP-10–0.5h |
r |
–0.142 |
0.102 |
0.493 |
|
p |
0.335 |
0.492 |
<0.001*** |
| MTT |
Fasting GLP-1 |
r |
0.186 |
0.231 |
0.246 |
|
p |
0.204 |
0.115 |
0.092 |
| AUCGLP-1 |
r |
–0.021 |
0.213 |
0.194 |
|
p |
0.885 |
0.147 |
0.186 |
| ΔGLP-10–0.5h |
r |
0.034 |
0.101 |
0.168 |
|
p |
0.817 |
0.494 |
0.253 |
r, Correlation coefficient; p, p-value. ** p < 0.01, *** p < 0.001.
References
- 1 Dobbs R, Sakurai H, Sasaki H, Faloona G, Valverde I, et al. (1975) Glucagon: role in the hyperglycemia of diabetes mellitus. Science 187: 544–547.
- 2 Unger RH, Orci L (1975) The essential role of glucagon in the pathogenesis of diabetes mellitus. Lancet 1: 14–16.
- 3 Del Prato S, Castellino P, Simonson DC, DeFronzo RA (1987) Hyperglucagonemia and insulin-mediated glucose metabolism. J Clin Invest 79: 547–556.
- 4 Brand CL, Jorgensen PN, Svendsen I, Holst JJ (1996) Evidence for a major role for glucagon in regulation of plasma glucose in conscious, nondiabetic, and alloxan-induced diabetic rabbits. Diabetes 45: 1076–1083.
- 5 Liang Y, Osborne MC, Monia BP, Bhanot S, Gaarde WA, et al. (2004) Reduction in glucagon receptor expression by an antisense oligonucleotide ameliorates diabetic syndrome in db/db mice. Diabetes 53: 410–417.
- 6 Hancock AS, Du A, Liu J, Miller M, May CL (2010) Glucagon deficiency reduces hepatic glucose production and improves glucose tolerance in adult mice. Mol Endocrinol 24: 1605–1614.
- 7 Lee Y, Wang MY, Du XQ, Charron MJ, Unger RH (2011) Glucagon receptor knockout prevents insulin-deficient type 1 diabetes in mice. Diabetes 60: 391–397.
- 8 Sharma AX, Quittner-Strom EB, Lee Y, Johnson JA, Martin SA, et al. (2018) Glucagon receptor antagonism improves glucose metabolism and cardiac function by promoting AMP-mediated protein kinase in diabetic mice. Cell Rep 22: 1760–1773.
- 9 Kazda CM, Ding Y, Kelly RP, Garhyan P, Shi C, et al. (2016) Evaluation of efficacy and safety of the glucagon receptor antagonist LY2409021 in patients with type 2 diabetes: 12- and 24-week phase 2 studies. Diabetes Care 39: 1241–1249.
- 10 Kazierad DJ, Bergman A, Tan B, Erion DM, Somayaji V, et al. (2016) Effects of multiple ascending doses of the glucagon receptor antagonist PF-06291874 in patients with type 2 diabetes mellitus. Diabetes Obes Metab 18: 795–802.
- 11 Kazda CM, Frias J, Foga I, Cui X, Guzman CB, et al. (2017) Treatment with the glucagon receptor antagonist LY2409021 increases ambulatory blood pressure in patients with type 2 diabetes. Diabetes Obes Metab 19: 1071–1077.
- 12 Guzman CB, Zhang XM, Liu R, Regev A, Shankar S, et al. (2017) Treatment with LY2409021, a glucagon receptor antagonist, increases liver fat in patients with type 2 diabetes. Diabetes Obes Metab 19: 1521–1528.
- 13 Holst JJ, Christensen M, Lund A, de Heer J, Svendsen B, et al. (2011) Regulation of glucagon secretion by incretins. Diabetes Obes Metab 13 Suppl 1: 89–94.
- 14 Bak MJ, Albrechtsen NW, Pedersen J, Hartmann B, Christensen M, et al. (2014) Specificity and sensitivity of commercially available assays for glucagon and oxyntomodulin measurement in humans. Eur J Endocrinol 170: 529–538.
- 15 Wewer Albrechtsen NJ, Hartmann B, Veedfald S, Windeløv JA, Plamboeck A, et al. (2014) Hyperglucagonaemia analysed by glucagon sandwich ELISA: nonspecific interference or truly elevated levels? Diabetologia 57: 1919–1926.
- 16 Campbell JE, Drucker DJ (2015) Islet alpha cells and glucagon—critical regulators of energy homeostasis. Nat Rev Endocrinol 11: 329–338.
- 17 Miyachi A, Kobayashi M, Mieno E, Goto M, Furusawa K, et al. (2017) Accurate analytical method for human plasma glucagon levels using liquid chromatography-high resolution mass spectrometry: comparison with commercially available immunoassays. Anal Bioanal Chem 409: 5911–5918.
- 18 Katahira T, Kanazawa A, Shinohara M, Koshibu M, Kaga H, et al. (2019) Postprandial plasma glucagon kinetics in type 2 diabetes mellitus: comparison of immunoassay and mass spectrometry. J Endocr Soc 3: 42–51.
- 19 Ichikawa R, Takano K, Fujimoto K, Motomiya T, Kobayashi M, et al. (2019) Basal glucagon hypersecretion and response to oral glucose load in prediabetes and mild type 2 diabetes. Endocr J 66: 663–675.
- 20 Matthews DR, Hosker JP, Rudenski AS, Naylor BA, Treacher DF, et al. (1985) Homeostasis model assessment: insulin resistance and beta-cell function from fasting plasma glucose and insulin concentrations in man. Diabetologia 28: 412–419.
- 21 Kadowaki T, Miyake Y, Hagura R, Akanuma Y, Kajinuma H, et al. (1984) Risk factors for worsening to diabetes in subjects with impaired glucose tolerance. Diabetologia 26: 44–49.
- 22 Matthews JN, Altman DG, Campbell MJ, Royston P (1990) Analysis of serial measurements in medical research. BMJ 300: 680.
- 23 Matsuo T, Miyagawa J, Kusunoki Y, Miuchi M, Ikawa T, et al. (2016) Postabsorptive hyperglucagonemia in patients with type 2 diabetes mellitus analyzed with a novel enzyme-linked immunosorbent assay. J Diabetes Investig 7: 324–331.
- 24 Færch K, Vistisen D, Pacini G, Torekov SS, Johansen NB, et al. (2016) Insulin resistance is accompanied by increased fasting glucagon and delayed glucagon suppression in individuals with normal and impaired glucose regulation. Diabetes 65: 3473–3481.
- 25 Holst JJ (1980) Evidence that glicentin contains the entire sequence of glucagon. Biochem J 187: 337–343.
- 26 Holst JJ (1982) Evidence that enteroglucagon (II) is identical with the C-terminal sequence (residues 33–69) of glicentin. Biochem J 207: 381–388.
- 27 Orskov C, Jeppesen J, Madsbad S, Holst JJ (1991) Proglucagon products in plasma of noninsulin-dependent diabetics and nondiabetic controls in the fasting state and after oral glucose and intravenous arginine. J Clin Invest 87: 415–423.
- 28 Bak MJ, Wewer Albrechtsen N, Hartmann B, Pedersen J, Christensen M, et al. (2014) No effect of aprotinin (TrasylolTM) on degradation of exogenous and endogenous glucagon in human, mouse and rat plasma. J Endocrinol Diab 1: 5.
- 29 Lee AY, Chappell DL, Bak MJ, Judo M, Liang L, et al. (2016) Multiplexed quantification of proglucagon-derived peptides by immunoaffinity enrichment and tandem mass spectrometry after a meal tolerance test. Clin Chem 62: 227–235.
- 30 Ang T, Kowalski GM, Bruce CR (2018) Endogenous glucose production after sequential meals in humans: evidence for more prolonged suppression after ingestion of a second meal. Am J Physiol Endocrinol Metab 315: E904–E911.
- 31 Kawamori D (2017) Exploring the molecular mechanisms underlying alpha- and beta-cell dysfunction in diabetes. Diabetol Int 8: 248–256.
- 32 Ipp E (2000) Impaired glucose tolerance: the irrepressible alpha-cell? Diabetes Care 23: 569–570.
- 33 Gromada J, Franklin I, Wollheim CB (2007) Alpha-cells of the endocrine pancreas: 35 years of research but the enigma remains. Endocr Rev 28: 84–116.
- 34 Larsson H, Ahrén B (2000) Glucose intolerance is predicted by low insulin secretion and high glucagon secretion: outcome of a prospective study in postmenopausal Caucasian women. Diabetologia 43: 194–202.
- 35 Larsson H, Ahrén B (2000) Islet dysfunction in insulin resistance involves impaired insulin secretion and increased glucagon secretion in postmenopausal women with impaired glucose tolerance. Diabetes Care 23: 650–657.
- 36 Calanna S, Christensen M, Holst JJ, Laferrère B, Gluud LL, et al. (2013) Secretion of glucose-dependent insulinotropic polypeptide in patients with type 2 diabetes. Diabetes Care 36: 3346–3352.
- 37 Calanna S, Christensen M, Holst JJ, Laferrère B, Gluud LL, et al. (2013) Secretion of glucagon-like peptide-1 in patients with type 2 diabetes mellitus: systematic review and meta-analyses of clinical studies. Diabetologia 56: 965–972.
- 38 Chia CW, Carlson OD, Kim W, Shin Y-K, Charles CP, et al. (2009) Exogenous glucose–dependent insulinotropic polypeptide worsens post prandial hyperglycemia in type 2 diabetes. Diabetes 58: 1342–1349.
- 39 Lund A, Vilsboll T, Bagger J, Holst J, Knop F (2011) The separate and combined impact of the intestinal hormones, GIP, GLP-1, and GLP-2, on glucagon secretion in type 2 diabetes. Am J Physiol Endocrinol Metab 300: E1038–E1046.