Abstract
This randomized, open-label, and parallel-group study aimed to investigate the effects of altering the timing of carbohydrate intake at breakfast or dinner on blood glucose fluctuations and energy metabolism. A total of 43 participants with type 2 diabetes were assigned to either the breakfast or dinner group. Participants were provided an isocaloric carbohydrate-restricted diet constituting 10% carbohydrate only at breakfast or dinner for 2 days during the study. Glucose fluctuations were compared using a continuous glucose monitoring system (iPro2) and body composition, energy expenditure, blood biochemistry, and endocrine function changes. The carbohydrate restriction either at breakfast or dinner significantly decreased postprandial glucose excursion and mean 24-h blood glucose levels. The incremental blood glucose area under the curve (AUC) for 2 h (iAUC0-2h) at lunch significantly increased in the breakfast group, whereas no significant differences were observed in the iAUC0-2h between breakfast and lunch in the dinner group. Carbohydrate restriction reduced diet-induced thermogenesis at breakfast (intragroup comparison; 223 ± 117 to 109 ± 104 kcal, p = 0.002) but did not affect diet-induced thermogenesis at dinner. However, fasting plasma free fatty acids were comparable in both groups, prelunch free fatty acids increased significantly only in the breakfast group (0.20 ± 0.09 to 0.63 ± 0.19 mEq/L, p < 0.001). Carbohydrate restriction in the diet once daily decreases mean 24-h blood glucose levels and exerts unique metabolic effects depending on the timing.
A RECENT IMPROVEMENT in continuous glucose monitoring (CGM) systems has revealed previously unrecognized blood glucose fluctuations in individuals with diabetes [1]. Accumulating evidence suggests that postprandial hyperglycemia is associated with an increased risk of developing cardiovascular diseases and, therefore, may be a therapeutic target [2]. Carbohydrate restriction in the diet may be one solution for remedying postprandial hyperglycemia. Adequate nutritional balance is beneficial to health and has been a central issue of debate with respect to diabetes, obesity, and longevity. In particular, the balance of macronutrients may affect health due to cross-talk among macronutrient metabolic pathways [3]. Carbohydrate restriction lowers postprandial excursions of both glucose and insulin [4]; therefore, is believed to be effective in reducing body weight [5]. However, a recent human study that assayed energy oxidation and expenditure revealed that restricting dietary carbohydrates does not contribute to body fat loss, whereas a restricted fat/high carbohydrate diet does reduce body fat [6]. In addition, excess intake of protein and fat, as a trade-off for carbohydrate restriction, may be harmful to health, particularly with respect to longevity and developing diseases such as cancer and diabetes [7]. These findings provide the option of mild carbohydrate restriction in planning therapeutic nutrition strategies for patients with diabetes. Indeed, the “Standards of Medical Care in Diabetes” position statement does not provide an ideal value for the percentage of calories that should come from carbohydrates, protein, and fat for people with diabetes in general. These values should be based on individual assessments of metabolic goals for each patient [8].
Nutrients, especially carbohydrates and protein, reset peripheral circadian clocks that govern downstream metabolic processes [9], such as fatty acid synthesis in the liver [10] and glucose uptake from the intestine [11]. Indeed, recent studies have shown that circadian rhythm disorders lead to obesity or exacerbation of diabetic symptoms [12], suggesting that the biological clock is associated with this disease.
These findings suggest that dietary intervention from the perspective of chrono-nutrition and/or nutritional balance may alter energy homeostasis. To test this hypothesis, we investigated the effects of alternating the carbohydrate intake timing between breakfast and dinner on blood glucose fluctuations and energy metabolism.
Materials and Methods
Overview
We conducted a randomized, open-label, and parallel-group trial in Japanese patients with type 2 diabetes at Kanazawa University Hospital in accordance with the Declaration of Helsinki. The participants provided written informed consent before conducting any study-related procedures. This trial was approved by the Institutional Review Board and registered with the University Hospital Medical Information Network (UMIN) Clinical Trials Registry (number UMIN000010407). A total of 43 participants with type 2 diabetes were recruited from the Department of Endocrinology and Metabolism, Kanazawa University Hospital, from February 2013 to February 2017. No essential changes were observed on the methods and outcomes after trial commencement.
Patient eligibility
The eligibility criteria were as follows: >20 years of age with a diagnosis of type 2 diabetes mellitus. The exclusion criteria were as follows: a history of type 1 diabetes or ketoacidosis; recurrent episodes of severe hypoglycemia with loss of consciousness; concomitant infection, planning to undergo surgery, or severe trauma; concomitant corticosteroid therapy; poorly controlled hypertension (systolic blood pressure of >160 mmHg or diastolic blood pressure of >100 mmHg); severe retinopathy; malignancy on an active therapeutic regimen; pregnancy or breastfeeding; or an inability to participate in the study as assessed by the investigators.
We did not include severe nephropathy in the exclusion criteria. However, patients on dialysis and with severe renal dysfunction (estimated glomerular filtration rate <30 mL/min/1.73 m2, and serum creatinine, >2.5 mg/dL in men and >2.0 mg/dL in women) were excluded because they often restrict dietary protein. All participants had an estimated glomerular filtration rate >45 mL/min/1.73 m2.
Study participants
Participants were randomly assigned to the breakfast or dinner group at a 1:1 ratio using sequentially numbered containers. All participants were inpatients. Participants were provided three meals a day, and each meal had almost the same calories. The total dietary energy intake was 30 kcal/kg of the ideal body weight per day. Energy sources of the balanced diet consisted of 16%–20% from protein, 21%–28% from fat, and 50%–61% from carbohydrates (Supplementary Table 1). The carbohydrate-restricted diet for breakfast or dinner was isocaloric to the balanced diet, with a PFC balance of 25% from protein, 65% from fat, and 10% from carbohydrates. In both the groups, participants consumed a balanced diet, except for a carbohydrate-restricted diet at breakfast or dinner. Meals were provided at our hospital. Dietary intake was monitored by our medical staff. All participants ate every meal during the study.
The study duration was 6 days (from Day 1 to Day 6), and during which blood glucose fluctuations were recorded using CGM iPro2. Baseline assessment was conducted after obtaining informed consent in both groups. Participants in each group took the carbohydrate-restricted diet only at either breakfast or dinner for 2 days, and changes from the balanced diet were assessed (Supplementary Table 2). The carbohydrate-restricted diet data were recorded after the 2-day carbohydrate-restricted diet. CGM iPro2 automatically measured interstitial fluid glucose levels every 5 min. Means ± standard deviations of blood glucose levels were calculated from a 2-day balanced or carbohydrate-restricted diet (Fig. 1).

During the clinical trial, some drugs that could affect postprandial blood glucose levels or lead to hypoglycemia (i.e., sulfonylureas, glinides, α-glucosidase inhibitors, glucagon-like peptide-1 receptor agonists, regular insulin, and rapid-acting insulin analogs) were discontinued, whereas other drugs (i.e., dipeptidyl peptidase 4 inhibitors, biguanide, thiazolidinediones, and basal insulin) were continued. Furthermore, participants performed only daily activities and restricted exercise during the trial period.
Efficacy end-points
The primary efficacy end-point was the difference in glucose fluctuations (the mean 24-h blood glucose level, M value [13], and the mean amplitude of glycemic excursions [14]) between the balanced and carbohydrate-restricted diets in each group. The mean 24-h blood glucose level was calculated from 2 days of each diet. M value and the mean amplitude of glycemic excursions were calculated from the latter day.
The secondary end-point was the body weight (BW) changes, body mass index, waist circumference, body composition, C-peptide immunoreactivity (CPR), serum alkaline phosphatase (ALP), blood and urine calcium, inorganic phosphate, serum concentrations of 3-hydroxybutyrate (3-HBA), total cholesterol, fasting triglycerides (TG), high density lipoprotein (HDL) cholesterol, free fatty acids (FFAs), insulin counter-regulatory hormones (growth hormone, glucagon, and cortisol), basal energy expenditure (BEE), diet-induced thermogenesis (DIT), respiratory quotient (RQ), peripheral endothelial function using fingertip plethysmography, and treatment satisfaction.
Measurements of blood biochemistry, insulin counter-regulatory hormones (fasting glucagon and cortisol), and body composition were performed before breakfast. TG and FFAs were also measured before lunch. FFA concentrations were measured enzymatically at BML Inc. (Tokyo, Japan) using an automatic analyzer (JEOL Ltd. JCA-BM8060, Tokyo, Japan). The midnight growth hormone was measured at 23:00 h.
Body composition was measured by multifrequency bioelectrical impedance analysis using the Multi-Frequency Body Composition Analyzer BC-118D (Tanita Corporation, Tokyo, Japan), with an eight-point footpad-style electrode arrangement. Previous studies showed that multifrequency bioelectrical impedance analysis was more accurate than single-frequency bioelectrical impedance analysis using dual-energy X-ray absorptiometry [15].
Energy expenditure was calculated by measuring oxygen consumption (VO2) and carbon dioxide production (VCO2) in recumbent participants at room temperature over a 10-min period by indirect calorimetry using a Minato AE-310s AEROMONITOR (Minato Medical Science Company Ltd., Osaka, Japan). Energy expenditure was calculated from VO2 and VCO2 measurements using the equation reported by de Weir [16]. Before taking the measurements, the participants rested for over 30 min in a supine position. Energy expenditure and RQ were measured for 10 min before and 1 h after the consumption of each diet and were presented as BEE and EE60 and RQ0 and RQ60. DIT and ⊿RQ were measured as the difference between the EE60 and BEE and between RQ60 and RQ0, respectively. DIT was measured at breakfast in the breakfast group and at dinner in the dinner group on day 2 and on the second day of the carbohydrate-restricted diet.
An EndoPAT-2000 device (Itamar Medical Inc, Caesarea, Israel) was used to assess peripheral endothelial function using fingertip plethysmography. The EndoPAT quantifies peripheral arterial tone changes during postocclusion reactive hyperemia (RH) induced by 5 min of brachial artery occlusion [17]. The EndoPAT software automatically calculates two measures of peripheral endothelial dysfunction. The RH-index (RHI) is calculated using the post- and pre-occlusion values with measurements on the contralateral arm to control for concurrent endothelium-independent vascular tone changes and is validated for peripheral endothelial dysfunction [18]. Endothelial function predicts late cardiovascular events [19].
Treatment satisfaction was assessed using the diabetes treatment satisfaction questionnaire (DTSQ) [20, 21], conducted on the same day as the assessment of each diet. The overall treatment satisfaction score was calculated as the sum of DTSQ items 1 (Q1, satisfaction with the treatment), 4 (Q4, convenience of the treatment), 5 (Q5, flexibility of the treatment), 6 (Q6, understanding of your diabetes), 7 (Q7, recommend to others), and 8 (Q8, wish to continue treatment). Items 2 (Q2, perceived hyperglycemia frequency) and 3 (Q3, perceived hypoglycemia frequency) were treated as separate variables. This quality of life (QOL) instrument was not designed to measure treatment satisfaction related to the device.
Safety and tolerability were assessed by several parameters. Key safety parameters included general adverse, hypoglycemic, and hyperglycemic events and other parameters of interest such as ketone bodies, lipid metabolism, serum phosphorus, and urinary calcium excretion. Adverse events were monitored throughout the study.
Statistical analysis
A completed case analysis, rather than an intention-to-treat analysis, was performed because two participants, one from each group, dropped out of the study; reasons for withdrawing from the study were unrelated to the patients’ baseline values or their responses. The data are expressed as means ± standard deviations. SPSS version 22.0 (SPSS Inc., Chicago, Illinois, USA) was used for all the statistical analyses. Normally distributed continuous variables were compared between groups using the Student’s t test, whereas nonnormally distributed continuous variables were compared using the Mann–Whitney U test. A paired t-test or Wilcoxon’s signed-rank test was performed to assess intragroup differences. p < 0.05 was considered to be statistically significant.
Results
Baseline characteristics
A total of 43 eligible participants were screened and randomly assigned to the breakfast or dinner group. Among them, 41 participants were analyzed as two patients did not participate due to a diagnosis of cancer or withdrawal of consent (Supplementary Fig. 1). Baseline characteristics for participants were as follows: the mean age, 61.4 ± 16.6 and 62.8 ± 10.6 years; body mass index, 25.8 ± 5.94 and 25.1 ± 4.40 kg/m2; fasting plasma glucose, 119 ± 27.8 and 120 ± 25.9 mg/dL; and glycated hemoglobin, 8.2 ± 1.7 and 8.2 ± 1.5% in the breakfast and dinner groups, respectively. No significant differences were noted in the baseline characteristics between groups (Table 1). No significant adverse events or unintended effects were observed in each group.
Table 1
Baseline characteristics of study participants
|
Breakfast group (n = 21) |
Dinner group (n = 20) |
p |
| Male/Female |
6/15 |
11/9 |
0.317 |
| Age (years) |
61.4 ± 16.6 |
62.8 ± 10.6 |
0.433 |
| Disease duration (years) |
15.4 ± 14.0 |
10.2 ± 10.0 |
0.220 |
| Combination therapy (SU/BG/αGI/TZD/DPP4-I/Glinide/GLP-1 RAs/Insulin) |
3/12/3/1/10/5/4/6 |
4/12/1/1/12/2/1/6 |
0.429 |
| Body weight (kg) |
69.1 ± 19.8 |
63.1 ± 16.2 |
0.220 |
| Body mass index (kg/m2) |
25.8 ± 5.94 |
25.1 ± 4.40 |
0.938 |
| Waist circumference (cm) |
95.5 ± 14.6 |
89.1 ± 10.5 |
0.114 |
| Systolic blood pressure (mmHg) |
119 ± 10.5 |
119 ± 13.6 |
0.845 |
| Fasting plasma glucose (mg/dL) |
119 ± 27.8 |
120 ± 25.9 |
0.958 |
| HbA1c (%) |
8.2 ± 1.7 |
8.2 ± 1.5 |
0.896 |
| C-peptide immnoreactivety (ng/mL) |
2.0 ± 1.5 |
1.9 ± 1.0 |
0.876 |
| Retinopathy* (no DR/mild-NPDR/moderate-NPDR/severe-NPDR/PDR) |
18/1/0/0/2 |
18/0/1/0/1 |
0.406 |
| Normoalbuminuria/Microalbuminuria/Macroalbuminuria |
16/5/0 |
19/1/0 |
0.368 |
| CVRR (%) |
2.4 ± 1.8 |
2.5 ± 0.9 |
0.144 |
| Total cholesterol (mg/dL) |
178 ± 32.3 |
171 ± 32.9 |
0.502 |
| Triglycerides (mg/dL) |
158 ± 90.8 |
165 ± 93.9 |
0.886 |
Data are expressed as mean ± SD. p-value for the intergroup comparison.
* Retinopathy was graded according to the International Clinical Classification of Diabetic Retinopathy.
αGI, alpha-glucosidase inhibitor; BG, biguanide; CVRR, coefficient of variation R-R interval; DPP4-I, dipeptidyl peptidase 4-Inhibitor; DR, diabetic retinopathy; GLP-1 RAs, glucagon-like peptide-1 receptor agonists; NPDR, non-proliferative diabetic retinopathy; PDR, proliferative diabetic retinopathy; SU, sulfonylurea; TZD, thiazolidine
The carbohydrate-restricted diet significantly reduced the corresponding postprandial incremental blood glucose AUC for 2 h (iAUC0-2h) after the meals in both breakfast and dinner groups. As a result, it significantly reduced the mean 24-h blood glucose levels in both groups, but without significant difference between them. The carbohydrate-restricted diet significantly reduced the M value only in the breakfast group. Conversely, the carbohydrate-restricted diet did not affect the mean amplitude of glycemic excursions in either group. Notably, the carbohydrate-restricted diet significantly elevated iAUC0-2h at lunch in the breakfast group, whereas it did not affect the iAUC0-2h at breakfast and lunch in the dinner group. iAUC0-2h at lunch was significantly higher in the breakfast group than that in the dinner group (Table 2, Fig. 2). No hypoglycemic and hyperglycemic events were observed in both groups.
Table 2
Glucose fluctuation, body composition, energy expenditure, and blood biochemistry
|
Breakfast group |
Dinner group |
p† |
p†† |
| n |
Balanced |
Carb-restricted |
p |
n |
Balanced |
Carb-restricted |
p |
| Mean 24-h blood glucose level (mg/dL) |
19 |
166 ± 38 |
149 ± 28 |
0.002 |
19 |
156 ± 25 |
140 ± 22 |
0.005 |
0.651 |
0.264 |
| M value |
19 |
114 ± 108 |
65 ± 47 |
0.013 |
19 |
69 ± 54 |
46 ± 32 |
0.117 |
0.328 |
0.219 |
| MAGE (mg/dL) |
19 |
104 ± 71 |
107 ± 47 |
0.059 |
19 |
96 ± 44 |
94 ± 37 |
0.717 |
0.521 |
0.393 |
| iAUC0-2h at breakfast (mg/dL·min) |
19 |
6,527 ± 4,352 |
651 ± 960 |
<0.001 |
19 |
4,503 ± 3,150 |
4,958 ± 3,372 |
0.355 |
<0.001 |
<0.001 |
| iAUC0-2h at lunch (mg/dL·min) |
19 |
3,660 ± 2,657 |
5,271 ± 3,120 |
<0.001 |
19 |
3,385 ± 2,705 |
2,539 ± 3,386 |
0.153 |
0.001 |
0.016 |
| iAUC0-2h at dinner (mg/dL·min) |
19 |
6,243 ± 3,630 |
4,910 ± 3,210 |
0.050 |
19 |
5,829 ± 3,820 |
663 ± 1,411 |
<0.001 |
0.001 |
<0.001 |
| Body Weight (kg) |
21 |
67.8 ± 19.9 |
67.4 ± 20.0 |
0.002 |
20 |
61.5 ± 16.0 |
61.2 ± 15.8 |
0.020 |
0.504 |
0.179 |
| Body Mass Index (kg/m2) |
21 |
25.4 ± 6.0 |
25.2 ± 6.0 |
0.002 |
20 |
24.5 ± 4.5 |
24.4 ± 4.4 |
0.020 |
3.000 |
0.825 |
| Waist circumference (cm) |
21 |
92.6 ± 13.8 |
91.6 ± 13.4 |
0.012 |
18 |
86.6 ± 7.2 |
86.5 ± 7.6 |
0.770 |
0.121 |
0.398 |
| Body Fat (%) |
21 |
30.4 ± 9.5 |
30.2 ± 9.3 |
0.586 |
19 |
32.7 ± 8.4 |
33.0 ± 8.1 |
0.420 |
0.264 |
0.322 |
| Lean Body Mass (kg) |
21 |
46.3 ± 10.2 |
46.3 ± 10.7 |
0.432 |
19 |
40.7 ± 9.6 |
39.8 ± 10.1 |
0.190 |
0.243 |
0.066 |
| Basal Energy Expenditure (×103 kcal) |
19 |
1.30 ± 033 |
1.25 ± 0.43 |
0.198 |
19 |
1.17 ± 0.30 |
1.16 ± 0.31 |
0.158 |
0.557 |
0.297 |
| ⊿Respiratory Quotient |
20 |
0.04 ± 0.06 |
–0.04 ± 0.09 |
<0.001 |
19 |
0.01 ± 0.06 |
–0.02 ± 0.07 |
0.279 |
0.032 |
0.573 |
| Fasting Plasma Glucose (mg/dL) |
21 |
125 ± 29 |
122 ± 29 |
0.457 |
20 |
124 ± 24 |
116 ± 19 |
0.077 |
0.540 |
0.385 |
| Creatinine (mg/dL) |
21 |
0.70 ± 0.20 |
0.72 ± 0.18 |
0.051 |
20 |
0.66 ± 0.15 |
0.69 ± 0.17 |
0.034 |
0.603 |
0.542 |
| Calcium (mg/dL) |
21 |
9.1 ± 0.4 |
9.2 ± 0.3 |
0.380 |
20 |
9.1 ± 0.3 |
9.3 ± 0.3 |
0.010 |
0.250 |
0.201 |
| Urine-Calcium (mg/gCr) |
21 |
131 ± 91 |
112 ± 58 |
0.149 |
19 |
157 ± 137 |
175 ± 122 |
0.028 |
0.012 |
0.012 |
| Inorganic Phosphorus (mg/dL) |
19 |
3.4 ± 0.6 |
3.5 ± 0.6 |
0.418 |
16 |
3.4 ± 0.4 |
3.7 ± 0.5 |
0.006 |
0.175 |
0.347 |
| Urine-Inorganic Phosphorus (mg/gCr) |
19 |
547 ± 168 |
638 ± 199 |
0.018 |
15 |
590 ± 176 |
687 ± 231 |
0.013 |
0.903 |
0.513 |
| Alkaline Phosphatase (U/L) |
19 |
227 ± 80 |
228 ± 76 |
0.636 |
16 |
206 ± 61 |
209 ± 64 |
0.361 |
0.654 |
0.427 |
| Triglyceride (mg/dL) |
21 |
135 ± 51 |
114 ± 42 |
<0.001 |
20 |
153 ± 71 |
123 ± 54 |
0.003 |
0.334 |
0.896 |
| Prelunch Triglyceride (mg/dL) |
16 |
196 ± 62 |
226 ± 89 |
0.083 |
13 |
184.0 ± 75.2 |
146.1 ± 64.9 |
0.001 |
0.001 |
0.012 |
| Total cholesterol (mg/dL) |
21 |
173 ± 38 |
168 ± 37 |
0.110 |
20 |
165 ± 33 |
165 ± 36 |
0.789 |
0.481 |
0.761 |
| High density lipoprotein cholesterol (mg/dL) |
21 |
41 ± 15 |
42 ± 14 |
0.362 |
20 |
37 ± 7 |
39 ± 8 |
<0.001 |
0.031 |
0.834 |
| Free Fatty Acids (mEq/L) |
21 |
0.41 ± 0.19 |
0.42 ± 0.17 |
0.348 |
19 |
0.41 ± 0.20 |
0.42 ± 0.18 |
0.686 |
0.664 |
0.968 |
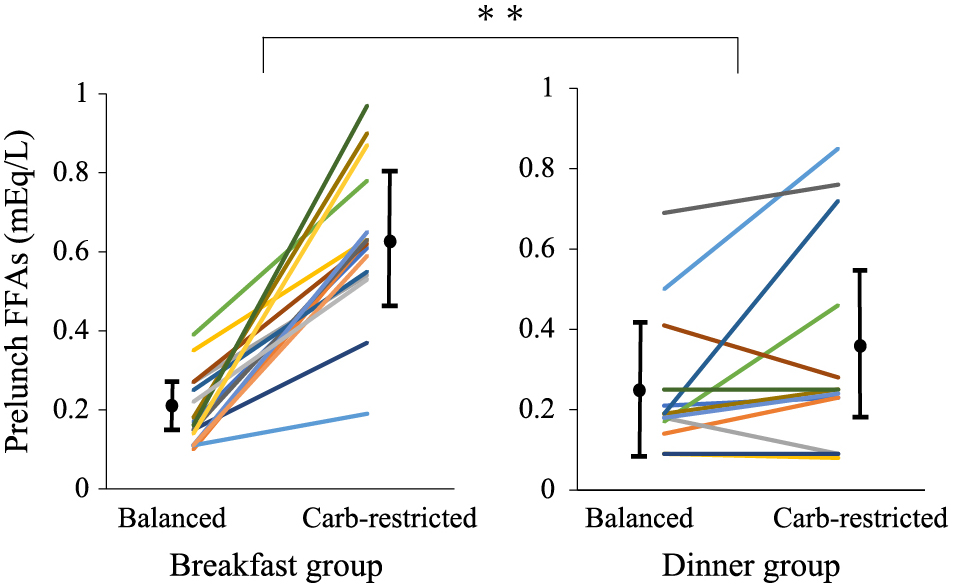
| Prelunch Free Fatty Acids (mEq/L) |
16 |
0.20 ± 0.09 |
0.63 ± 0.19 |
<0.001 |
13 |
0.25 ± 0.17 |
0.35 ± 0.25 |
0.119 |
<0.001 |
0.010 |
| 3-Hydroxybutyric acid (μmol/L) |
21 |
84 ± 137 |
85 ± 88 |
0.022 |
20 |
72 ± 81 |
120 ± 104 |
0.016 |
0.080 |
0.100 |
| Reactive Hyperemia Index |
18 |
1.56 ± 0.25 |
1.66 ± 0.23 |
0.201 |
17 |
1.72 ± 0.45 |
1.65 ± 0.24 |
0.428 |
0.198 |
0.932 |
| C-peptide immunoreactivity (ng/mL) |
21 |
1.9 ± 1.1 |
1.7 ± 1.1 |
0.028 |
20 |
1.7 ± 1.0 |
1.7 ± 0.9 |
0.302 |
0.290 |
0.942 |
| Immunoreactive glucagon (pg/mL) |
18 |
139 ± 79 |
145 ± 80 |
0.286 |
16 |
120 ± 18 |
136 ± 21 |
0.002 |
0.076 |
0.417 |
| Midnight Growth Hormone (ng/mL) |
18 |
0.6 ± 0.6 |
1.1 ± 1.2 |
0.130 |
15 |
2.0 ± 2.0 |
0.9 ± 0.9 |
0.041 |
0.009 |
0.945 |
| Insulin-like growth factor-1 (ng/mL) |
21 |
137 ± 52 |
131 ± 46 |
0.654 |
20 |
115 ± 41 |
117 ± 35 |
0.965 |
0.948 |
0.419 |
| Adrenocorticotropic hormone (pg/mL) |
21 |
37.1 ± 20.2 |
30.0 ± 13.5 |
0.045 |
20 |
35.5 ± 28.4 |
32.0 ± 22.5 |
0.398 |
0.593 |
0.557 |
| Cortisol (μg/dL) |
21 |
15.6 ± 7.2 |
14.6 ± 5.1 |
0.418 |
20 |
16.9 ± 5.0 |
15.5 ± 3.5 |
0.279 |
0.584 |
0.499 |
Data are expressed as mean ± SD.
p-value for the intragroup comparison between isoenergetic balanced diet and carbohydrate-restricted diet.
† p-value for the intergroup comparison of changes from isoenergetic balanced diets between groups.
†† p-value for the intergroup comparison of post-intervention data between groups.

Compared with the balanced diet, the carbohydrate-restricted diet significantly decreased BW and body mass index in both groups, without significant difference between them. With intragroup comparison, the carbohydrate-restricted diet significantly reduced the DIT at breakfast in the breakfast group (intragroup comparison; 223 ± 117 to 109 ± 104 kcal, p = 0.002), but did not affect the DIT at dinner in the dinner group (intragroup comparison;105 ± 135 to 87 ± 103 kcal, p = 0.554) (Fig. 3). The carbohydrate-restricted diet did not affect fasting plasma glucose in either group. It elevated serum creatinine levels only in the dinner group and tended to elevate in the breakfast group. It significantly elevated TG concentrations in both groups, without significant difference between them. However, it significantly reduced prelunch TG and elevated HDL-cholesterol only in the dinner group. The carbohydrate-restricted diet significantly elevated plasma glucagon concentrations only in the dinner group (Table 3). Fasting FFAs were comparable in both groups, and prelunch FFAs significantly elevated only in the breakfast group (0.20 ± 0.09 to 0.63 ± 0.19 mEq/L, p < 0.001). Prelunch, but not fasting, FFAs were significantly higher in the breakfast group than that in the dinner group (Table 2, Fig. 4).

Table 3
Diabetes Treatment Satisfaction Questionnaire scores (DTSQ) at isoenergetic balanced diet and carbohydrate-restricted diet
|
Breakfast group (n = 21) |
Dinner group (n = 20) |
p† |
p†† |
| Balanced |
Carb-restricted |
p |
Balanced |
Carb-restricted |
p |
| Q1 |
3.9 ± 1.0 |
4.3 ± 1.5 |
0.116 |
3.8 ± 1.6 |
5.1 ± 1.0 |
0.009 |
0.116 |
0.110 |
| Q2 |
3.0 ± 1.9 |
2.3 ± 1.6 |
0.040 |
3.8 ± 1.8 |
2.3 ± 1.7 |
0.008 |
0.122 |
0.957 |
| Q3 |
0.7 ± 1.3 |
1.2 ± 1.8 |
0.104 |
2.0 ± 2.1 |
1.6 ± 1.8 |
0.589 |
0.116 |
0.513 |
| Q4 |
3.4 ± 1.2 |
4.3 ± 1.0 |
0.004 |
3.7 ± 1.8 |
5.1 ± 1.4 |
0.015 |
0.393 |
0.005 |
| Q5 |
3.5 ± 1.1 |
4.1 ± 1.2 |
0.111 |
4.0 ± 1.5 |
4.9 ± 1.4 |
0.011 |
0.358 |
0.006 |
| Q6 |
3.7 ± 1.0 |
4.2 ± 1.0 |
0.013 |
4.6 ± 1.3 |
5.3 ± 1.1 |
0.050 |
0.857 |
0.001 |
| Q7 |
3.7 ± 1.5 |
4.4 ± 1.6 |
0.043 |
4.5 ± 1.5 |
5.3 ± 1.0 |
0.010 |
0.612 |
0.041 |
| Q8 |
3.7 ± 1.2 |
4.6 ± 1.3 |
0.019 |
4.3 ± 1.5 |
5.3 ± 0.8 |
0.019 |
0.848 |
0.066 |
| SUM |
21.9 ± 4.8 |
26.0 ± 6.3 |
0.002 |
24.8 ± 6.5 |
30.9 ± 4.0 |
0.001 |
0.537 |
0.026 |
The instruments contain 8 questions: Q1 satisfaction with current treatment, Q2 perceived frequency of hyperglycemia, Q3 perceived frequency of hypoglycemia, Q4 convenience of the treatment, Q5 flexibility of the treatment, Q6 understanding of diabetes mellitus, Q7 willingness to recommend the treatment to others, and Q8 satisfaction to continue the treatment. The score of each item is from 0 to 6 points. SUM is a total score of Q1, Q4, Q5, Q6, Q7 and Q8.
Data are expressed as mean ± SD.
p-value for the intragroup comparison between isoenergetic balanced diet and carbohydrate-restricted diet.
† p-value for the intergroup comparison of changes from isoenergetic balanced diets between groups.
†† p-value for the intergroup comparison of post-intervention data between groups.
The carbohydrate-restricted diet did not change the RHI, reflecting the endothelial function, in both groups, with no significant differences in changes or at the end-point between the groups (Table 2).
Treatment satisfaction
For almost all questions, participants under the carbohydrate-restricted diet provided significantly higher scores than those with the balanced diet in the dinner group. In the dinner group only, satisfaction scores for Q1 and Q5 were significantly elevated. The sum of the DTSQ scores for the carbohydrate-restricted diet significantly elevated in both groups, but without significant differences between groups (Table 3). Conversely, the dinner group in the carbohydrate-restricted diet had significantly higher scores for Q4, Q5, Q6, Q7, Q8, and SUM in the comparison between groups (Table 3).
Discussion
This is the first report of an open-label, randomized, parallel-group study comparing the effects of alternating the carbohydrate intake timing between breakfast and dinner on blood glucose fluctuations and energy metabolism in patients with type 2 diabetes. Carbohydrate restriction in breakfast and dinner groups significantly decreased the postprandial glucose excursion and the mean 24-h blood glucose concentrations, suggesting that carbohydrate mainly contributes to postprandial hyperglycemia. Carbohydrate restriction in the breakfast group increased prelunch FFAs and postlunch glucose excursion, while tending to reduce postdinner glucose excursion. These findings suggest that carbohydrate plays a significant role in the “second meal effect,” a phenomenon whereby the first meal affects the postprandial glucose excursion of the second meal. Jenkins et al. revealed that low glycemic index foods decrease postbreakfast and postlunch blood glucose levels [22]. In addition, skipping breakfast leads to a greater increase in postlunch blood glucose levels, and prelunch FFAs were strongly positively correlated with postlunch iAUC0-4h [23]. Carbohydrate intake elevates insulin secretion, suppresses lipolysis, and, thereby, lowers circulating FFAs. Some saturated fatty acids such as palmitate impair insulin signaling in hepatocytes [24]. Indeed, increased FFAs induce insulin resistance in humans [25, 26]. Therefore, elevating FFAs by restricting carbohydrate intake in the breakfast group may have caused the increased postlunch glucose excursion values as observed in this study. However, restricting carbohydrates in the dinner group had no effect on postbreakfast glucose excursion, possibly because it did not affect the fasting FFAs in the next morning.
DIT is determined by diet dose, and higher caloric meals induce higher DIT measurements [27]. DIT is also associated with specific macronutrients; carbohydrates and protein more significantly contribute than fat to DIT [28]. In addition, DIT shows circadian variations and is significantly higher in the morning than in the afternoon and night [29]. The carbohydrate-restricted diet significantly decreased DIT compared with the balanced diet only in the breakfast group in intragroup comparison (Fig. 3). Therefore, carbohydrate restriction in the breakfast may deprive diet-induced thermogenesis beneficial for energy expenditure.
Previous studies revealed that carbohydrate-restricted diets elevate HDL-cholesterol and reduce those of TG [5]. Unexpectedly, HDL-cholesterol was elevated only in the dinner group in this study. Prelunch TG significantly was reduced only in the dinner group, whereas fasting TG was reduced in both groups. Unknown mechanisms may underlie these isolated effects of carbohydrate restriction on lipid metabolism. This study demonstrated that BW decreased despite DIT significantly decreasing in the breakfast group. Other factors besides the DIT may be involved in the weight-reducing effect of carbohydrate-restricting breakfast. Carbohydrate restriction increases ketone bodies and FFAs [30]. Dimitrios et al. showed that morning carbohydrate restriction contributed more strongly to weight loss than calorie restriction [31]. In addition, the study also demonstrated that morning carbohydrate restriction reduced insulin secretion, which is consistent with the findings of our study. Adrenocorticotropic hormone produces its enhancing effect on glucose-induced insulin secretion [32], so the suppression of postprandial hyperglycemia by carbohydrate restriction reduced insulin secretion. Because growth hormone (GH) induces lipolysis and GH deficiency causes obesity [33], a reduction of GH levels in the dinner group might have contributed to the relative reduction in weight in the breakfast group.
The carbohydrate-restricted diet contained a relatively increased proportion of fat and protein and, therefore, the contents of the meal seemed to be more acceptable at dinner than at breakfast. DTSQ score was significantly elevated at postintervention with carbohydrate-restricted diets. However, the dinner group had significantly higher scores in the DTSQ after the carbohydrate-restricted diet. Therefore, the carbohydrate-restricted diet at dinner may be more acceptable than at breakfast in terms of QOL.
The limitations of the study were as follows. First, we evaluated the acute effects of the carbohydrate-restricted diet. The long-term challenge will be in evaluating the chronic effects and safety of once-daily carbohydrate-restricted diets. An increased HDL-cholesterol in a carbohydrate-restricted diet at dinner may have an advantage in suppressing arteriosclerosis [34]. Conversely, the significant increase in urinary excretion of calcium and 3-hydroxybutyric acid in the dinner group may be anticipated as increased risks for ureteral and kidney stones [35] and ketoacidosis [8]. The carbohydrate-restricted diet in this study accompanies a relatively higher protein ratio as a trade-off, which may increase the risk of cancer and overall mortality in patients aged ≤65 years in an epidemiological study [7]. Carbohydrate restriction during dinner reduced the midnight GH levels, which may be anticipated for reduced skeletal muscle and bone [36], nonalcoholic steatohepatitis [37], and depression [38]. Second, BEE and DIT were not measured in a respiration chamber because one was unfortunately not available at our hospital. In addition, DIT was measured as the difference between EE60 and BEE. This factor was measured only once, an hour after the meal, as DIT generally peaks 1 h after the food ingestion [29]. Indeed, EE180 was lower than EE60 in our previous study [39].
In conclusion, carbohydrate restriction at breakfast or dinner significantly decreases postprandial glucose excursion and mean 24-h blood glucose levels. The carbohydrate-restricted diet at breakfast did not incur the second meal effect, possibly due to elevated prelunch plasma FFAs. DIT was higher in the breakfast than in the dinner group, as it was lost due to carbohydrate restriction. The carbohydrate-restricted diet at dinner was beneficial to plasma lipid profiles. The QOL was better in participants receiving a carbohydrate-restricted diet in the dinner group than in the breakfast group. These findings provide novel chrono-nutritional information that may contribute to better medical nutrition therapies for people with type 2 diabetes.
Abbreviations
3-HBA, 3-hydroxybutyrate; ALP, serum alkaline phosphatase; BEE, basal energy expenditure; BW, body weight; CGM, continuous glucose monitoring; CPR, C-peptide immunoreactivity; DIT, diet-induced thermogenesis; DTSQ, the diabetes treatment satisfaction questionnaire; FFAs, free fatty acids; GH, growth hormone; HDL-cholesterol, high density lipoprotein cholesterol; iAUC, Incremental blood glucose area under the curve; PAT, peripheral arterial tone; QOL, quality of life; RH, reactive hyperemia; RQ, respiratory quotient; TG, Triglycerides; UMIN, University Hospital Medical Information Network
Acknowledgments
The authors’ responsibilities were as follows-Toshinari.T. is the guarantor of this study. Toshinari.T. and Y.T. designed the study. Y.E., S.S., Takeo.T, T.K., and Y.T. analyzed the data. Y.E., Y.T., and Toshinari.T. interpreted the data and wrote the manuscript. All authors recruited the participants, collected the data, read and approved the manuscript, and all agree with submission to this journal. All of the authors have read and approved the manuscript, and all agree with submission to your journal. All of the authors have contributed significantly to this work.
Disclosure
We declare no potential conflicts of interest associated with this research.
Supplementary Table 1
PFC balance in the balanced diet
| Energy (kcal/day) |
Protein |
Fat |
Carbohydrate |
| Weight (g) |
% of total energy |
Weight (g) |
% of total energy |
Weight (g) |
% of total energy |
| 1,200 |
59 |
20 |
37.5 |
28 |
150 |
50 |
| 1,280 |
61 |
19 |
37.5 |
26 |
168 |
53 |
| 1,360 |
63 |
19 |
37.5 |
25 |
186 |
55 |
| 1,440 |
65 |
18 |
37.5 |
23 |
204 |
57 |
| 1,520 |
67 |
18 |
37.5 |
22 |
222 |
58 |
| 1,600 |
69 |
17 |
37.5 |
21 |
240 |
60 |
| 1,680 |
78 |
19 |
42.5 |
23 |
240 |
57 |
| 1,760 |
80 |
18 |
42.5 |
22 |
258 |
59 |
| 1,840 |
82 |
18 |
56.5 |
28 |
246 |
53 |
| 1,920 |
84 |
18 |
56.5 |
26 |
264 |
55 |
| 2,000 |
86 |
17 |
56.5 |
25 |
282 |
56 |
| 2,080 |
88 |
17 |
56.5 |
24 |
300 |
58 |
| 2,160 |
90 |
17 |
56.5 |
24 |
318 |
59 |
| 2,240 |
90 |
16 |
56.5 |
23 |
338 |
60 |
| 2,320 |
92 |
16 |
56.5 |
22 |
356 |
61 |
| 2,400 |
101 |
17 |
61.5 |
23 |
356 |
59 |
Each diet is separated by 80 kcal.
Energy sources of the balanced diet were constituted by 16%–20% from protein, 21%–28% from fat, and 50%–61% from carbohydrates.
Supplementary Table 2
Study protocol
| Breakfast group |
|
Day 1 |
Day 2 |
Day 3 |
Day 4 |
Day 5 |
Day 6 |
| CGM |
|
● |
● |
● |
● |
● |
● |
| Baseline assessment |
● |
|
|
|
|
|
|
| Assessment of balanced diet |
|
|
● |
|
|
|
|
| Carbohydrate-restricted diet only at breakfast |
|
|
|
|
● |
● |
|
| Glucose fluctuation |
|
|
● |
● |
● |
● |
|
| Measurement of diet-induced thermogenesis |
|
|
● |
|
|
● |
|
| Prelunch and midnight blood examination |
|
|
● |
|
|
● |
|
| Assessment of carbohydrate-restricted diet |
|
|
|
|
|
|
● |
| Treatment satisfaction |
|
|
● |
|
|
|
● |
| Dinner group |
|
Day 1 |
Day 2 |
Day 3 |
Day 4 |
Day 5 |
Day 6 |
| CGM |
|
● |
● |
● |
● |
● |
● |
| Baseline assessment |
● |
|
|
|
|
|
|
| Assessment of balanced diet |
|
|
● |
|
|
|
|
| Carbohydrate-restricted diet only at dinner |
|
|
|
● |
● |
|
|
| Glucose fluctuation |
|
● |
● |
● |
● |
|
|
| Measurement of diet-induced thermogenesis |
|
|
● |
|
● |
|
|
| Prelunch and midnight blood examination |
|
|
● |
|
● |
|
|
| Assessment of carbohydrate-restricted diet |
|
|
|
|
|
● |
|
| Treatment satisfaction |
|
|
● |
|
|
● |
|
References
- 1 Battelino T, Danne T, Bergenstal RM, Amiel SA, Beck R, et al. (2019) Clinical targets for continuous glucose monitoring data interpretation: recommendations from the international consensus on time in range. Diabetes Care 42: 1593–1603.
- 2 Chiasson JL, Josse RG, Gomis R, Hanefeld M, Karasik A, et al. (2003) Acarbose treatment and the risk of cardiovascular disease and hypertension in patients with impaired glucose tolerance: the STOP-NIDDM trial. JAMA 90: 486–494.
- 3 Otoda T, Takamura T, Misu H, Ota T, Murata S, et al. (2013) Proteasome dysfunction mediates obesity-induced endoplasmic reticulum stress and insulin resistance in the liver. Diabetes 62: 811–824.
- 4 Gannon MC, Nuttall FQ (2004) Effect of a high-protein, low-carbohydrate diet on blood glucose control in people with type 2 diabetes. Diabetes 53: 2375–2382.
- 5 Shai I, Schwarzfuchs D, Henkin Y, Shahar DR, Witkow S, et al. (2008) Weight loss with a low-carbohydrate, mediterranean, or low-fat diet. N Engl J Med 59: 229–241.
- 6 Hall KD, Bemis T, Brychta R, Chen KY, Courville A, et al. (2015) Calorie for calorie, dietary fat restriction results in more body fat loss than carbohydrate restriction in people with obesity. Cell Metab 22: 427–436.
- 7 Levine ME, Suarez JA, Brandhorst S, Balasubramanian P, Cheng CW, et al. (2014) Low protein intake is associated with a major reduction in IGF-1, cancer, and overall mortality in the 65 and younger but not older population. Cell Metab 19: 407–417.
- 8 American Diabetes Association (2019) Lifestyle management: standards of medical care in diabetes-2019. Diabetes Care 42: S46–S60.
- 9 Oike H, Oishi K, Kobori M (2014) Nutrients, clock genes, and chrononutrition. Curr Nutr Rep 3: 204–212.
- 10 Kawasaki H, Doi R, Ito K, Shimoda M, Ishida N (2013) The Circadian binding of CLOCK protein to the promoter of C/ebpα gene in mouse cells. PLoS One 8: e58221.
- 11 Fatima J, Iqbal CW, Houghton SG, Kasparek MS, Duenes JA, et al. (2009) Hexose transporter expression and function in mouse small intestine: role of diurnal rhythm. J Gastrointest Surg 13: 634–641.
- 12 Marcheva B, Ramsey KM, Buhr ED, Kobayashi Y, Su H, et al. (2010) Disruption of the clock components CLOCK and BMAL1 leads to hypoinsulinaemia and diabetes. Nature 466: 627–631.
- 13 Schlichtkrull J, Munck O, Jersild M (1965) The m-value, an index of blood-sugar control in diabetics. Acta Med Scand 177: 95–102.
- 14 Service FJ, Molnar GD, Rosevear JW, Ackerman E, Gatewood LC, et al. (1970) Mean amplitude of glycemic excursions, a measure of diabetic instability. Diabetes 19: 644–655.
- 15 Alves FD, Souza GC, Biolo A, Clausell N (2014) Comparison of two bioelectrical impedance devices and dual-energy X-ray absorptiometry to evaluate body composition in heart failure. J Hum Nutr Diet 27: 632–638.
- 16 WEIR JB (1949) New methods for calculating metabolic rate with special reference to protein metabolism. J Physiol 109: 1–9.
- 17 Flammer AJ, Anderson T, Celermajer DS, Creager MA, Deanfield J, et al. (2012) The assessment of endothelial function: from research into clinical practice. Circulation 126: 753–767.
- 18 Bonetti PO, Pumper GM, Higano ST, Holmes DR, Kuvin JT, et al. (2004) Noninvasive identification of patients with early coronary atherosclerosis by assessment of digital reactive hyperemia. J Am Coll Cardiol 44: 2137–2141.
- 19 Rubinshtein R, Kuvin JT, Soffler M, Lennon RJ, Lavi S, et al. (2010) Assessment of endothelial function by non-invasive peripheral arterial tonometry predicts late cardiovascular adverse events. Eur Heart J 31: 1142–1148.
- 20 Bradley C, Gamsu DS (1994) Guidelines for encouraging psychological well-being: report of a Working Group of the World Health Organization Regional Office for Europe and International Diabetes Federation European Region St Vincent Declaration Action Programme for Diabetes. Diabet Med 11: 510–516.
- 21 Ishii H, Bradley C, Riazi A, Barendse S, Yamamoto T (2000) The Japanese Version of the Diabetes Treatment Satisfaction Questionnaire (DTSQ): translation and clinical evaluation. J Clin Exp Med 192: 809–814 (In Japanese).
- 22 Jenkins DJ, Wolever TM, Taylor RH, Griffiths C, Krzeminska K, et al. (1982) Slow release dietary carbohydrate improves second meal tolerance. Am J Clin Nutr 35: 1339–1346.
- 23 Jovanovic A, Gerrard J, Taylor R (2009) The second-meal phenomenon in type 2 diabetes. Diabetes Care 32: 1199–1201.
- 24 Nakamura S, Takamura T, Matsuzawa N, Takayama H, Misu H, et al. (2009) Palmitate induces insulin resistance in H4IIEC3 hepatocytes through reactive oxygen species produced by mitochondria. J Biol Chem 284: 14809–14818.
- 25 Rachek LI (2014) Chapter eight—free fatty acids and skeletal muscle insulin resistance. Prog Mol Biol Transl Sci 121: 267–292.
- 26 Boden G (1999) Free fatty acids, insulin resistance, and type 2 diabetes mellitus. Proc Assoc Am Physicians 111: 241–248.
- 27 Hill JO, Heymsfield SB, McMannus C 3rd, DiGirolamo M (1984) Meal size and thermic response to food in male subjects as a function of maximum aerobic capacity. Metabolism 33: 743–749.
- 28 Westerterp KR (2004) Diet induced thermogenesis. Nutr Metab (Lond) 1: 1–5.
- 29 Romon M, Edme JL, Boulenguez C, Lescroart JL, Frimat P (1993) Circadian variation of diet-induced thermogenesis. Am J Clin Nutr 57: 476–480.
- 30 Westman EC, Feinman RD, Mavropoulos JC, Vernon MC, Volek JS, et al. (2007) Low-carbohydrate nutrition and metabolism. Am J Clin Nutr 86: 276–284.
- 31 Dellis D, Tsilingiris D, Eleftheriadou I, Tentolouris A, Sfikakis PP Jr, et al. (2020) Carbohydrate restriction in the morning increases weight loss effect of a hypocaloric Mediterranean type diet: a randomized, parallel group dietary intervention in overweight and obese subjects. Nutrition 71: 110578.
- 32 Gagliardino JJ, Borelli MI, Boschero AC, Rojas E, Atwater I (1995) Modulatory mechanism of ACTH on insulin secretion: effect on cytosolic Ca2+, membrane potential and Ca(2+-ATPase activity. Arch Physiol Biochem 103: 73–78.
- 33 Kopchick JJ, Berryman DE, Puri V, Lee KY, Jorgensen JOL (2020) The effects of growth hormone on adipose tissue: old observations, new mechanisms. Nat Rev Endocrinol 16: 135–146.
- 34 von Eckardstein A, Nofer JR, Assmann G (2001) High density lipoproteins and arteriosclerosis. Role of cholesterol efflux and reverse cholesterol transport. Arterioscler Thromb Vasc Biol 21: 13–27.
- 35 Worcester EM, Coe FL (2010) Clinical practice. Calcium kidney stones. N Engl J Med 363: 954–963.
- 36 Mukherjee A, Murray RD, Shalet SM (2004) Impact of growth hormone status on body composition and the skeleton. Horm Res 62 Suppl 3: 35–41.
- 37 Takahashi Y (2017) The role of growth hormone and insulin-like growth factor-I in the liver. Int J Mol Sci 18: 1447.
- 38 Butler T, Harvey P, Cardozo L, Zhu YS, Mosa A, et al. (2019) Epilepsy, depression, and growth hormone. Epilepsy Behav 94: 297–300.
- 39 Isobe Y, Sakurai M, Kita Y, Takeshita Y, Misu H, et al. (2016) Fat-free mass and calf circumference as body composition indices to determine non-exercise activity thermogenesis in patients with diabetes. J Diabetes Investig 7: 352–358.

