Abstract
Serum dehydroepiandrosterone sulfate (DHEA-S) levels reflect the state of adrenocorticotropic hormone (ACTH) secretion. However, it is difficult to use serum DHEA-S to diagnose hypothalamic-pituitary-adrenal (HPA) axis insufficiency due to its non-normal and highly skewed distribution. In this study, we focused on HPA insufficiency caused by hypothalamic and/or pituitary dysfunction and evaluated the usefulness of the standard deviation score of log-transformed DHEA-S (ln DHEA-S SD score), which was calculated from the established age- and sex-specific reference values. We retrospectively reviewed the medical records of 94 patients suspected of having HPA insufficiency, in whom serum DHEA-S measurement and the rapid ACTH stimulation test were performed, and included 65 patients who met our criteria in this study. The ln DHEA-S SD scores were distributed more normally than measured DHEA-S levels and were significantly higher in patients with a peak cortisol level ≥18 μg/dL than in those below this value, suggesting that this score is a legitimate and strong indicator of adrenocortical function. The optimal cut-off value for impaired HPA function was –0.853, with a sensitivity of 70.3% and a specificity of 100%. Among the 37 patients whose peak cortisol levels were below 18 μg/dL, 11 patients with ln DHEA-S scores ≥–0.853 exhibited significantly higher basal ACTH and basal and peak cortisol levels than the 26 patients with scores <–0.853. Thus, this score plays a supportive role in evaluating HPA axis function, particularly in patients with borderline cortisol responses to ACTH.
INSUFFICIENT CORTISOL SECRETION, which may lead to a life-threatening adrenal crisis in case of stress [1], is caused by either primary hypoadrenalism or hypothalamic-pituitary-adrenal (HPA) axis insufficiency. HPA insufficiency, which is derived from organic hypothalamic and/or pituitary disorders or past prolonged exposure to excessive glucocorticoids, is suspected based on clinical symptoms, baseline plasma adrenocorticotropic hormone (ACTH), and baseline and stimulated serum cortisol levels. The gold standard modality for the diagnosis of HPA insufficiency is the insulin tolerance test (ITT) because it can assess the integrity of the entire HPA axis [2]. However, ITT requires induction of hypoglycemia and thus is not preferred and even regarded as contraindicated in the elderly and those with seizure disorders and ischemic heart diseases [3]. Another potential hazard in ITT is possible induction of adrenal crisis. Therefore, the rapid ACTH stimulation test, which is easier and safer than ITT, is commonly used instead to diagnose chronic adrenal insufficiency (AI), based on the assumption that in chronic HPA insufficiency, the adrenal cortex should be atrophic and hyporesponsive to ACTH [2]. The guideline of the Japan Endocrine Society recommends a peak cortisol level ≥18 μg/dL on the rapid ACTH test as the optimal cut-off value for intact HPA function [2]. Although this test is quite safe, a simpler diagnostic marker which can be obtained without ACTH administration would be desirable.
Serum dehydroepiandrosterone sulfate (DHEA-S) is an androgen secreted specifically from the adrenal cortex in an ACTH-dependent manner. Thus, serum DHEA-S levels reflect the state of ACTH secretion over a certain period [4] and may be clinically valuable for monitoring the adrenal status. However, there are some difficulties in using serum DHEA-S levels as a biomarker of adrenocortical function. Its normal range markedly differs depending on sex (higher in men than in women) and age (lower in the elderly) [5]. Importantly, serum DHEA-S levels in healthy individuals are skewed and distributed non-parametrically [6]. A previous study showed that the serum DHEA-S z-scores calculated using two separate half-normal distributions to the age- and sex-specific reference ranges may be useful to diagnose HPA insufficiency in young individuals aged up to 30 years [7]. Another report used the ratio of measured DHEA-S to the lower limit of the respective reference range for the diagnosis of HPA insufficiency [8]. Intriguingly, it has long been recognized that logarithmically (log) transformed serum DHEA-S levels, unlike those untransformed, follow the normal distribution pattern in healthy individuals [6]. Thus, we hypothesized that the standard deviation score of log-transformed DHEA-S (ln DHEA-S SD score), which can be calculated from the established age- and sex-specific reference values, may be a reliable diagnostic parameter for HPA insufficiency. The aim of this study was to evaluate the usefulness of the ln DHEA-S SD score for diagnosing HPA insufficiency.
Materials and Methods
Study design and patients
This retrospective study was approved by the institutional review board of Teikyo University Hospital, Japan (approval number 20-024-3). The need for written informed consent was waived owing to the retrospective nature of the study.
The subjects were 94 patients who were suspected of having HPA insufficiency based on their clinical manifestations or underlying diseases and who underwent serum DHEA-S and rapid ACTH tests at our hospital between April 2014 and January 2020. We excluded 29 patients: those with adrenal tumors, those on contraceptive pills, those with documented hypersecretion of aldosterone or thyroid hormone, and those with growth hormone-producing adenoma or insulinoma. The remaining 65 patients (28 men and 37 women, with a mean [SD] age of 55.9 [18.1] years) were included in the analysis.
Assessments
Serum DHEA-S levels were measured using a chemiluminescence enzyme immunoassay kit (Access DHEA-S, Beckman Coulter, Inc. Brea, CA, USA). Cortisol and ACTH levels were measured using electrochemiluminescence immunoassay kits (Elecsys Cortisol II and Elecsys ACTH, Roche Diagnostics K. K. Basel, Switzerland). Serum DHEA-S measurement and the rapid ACTH stimulation test were performed on the same day or, if not possible, no more than 7 days apart. The rapid ACTH test was performed by intravenous administration of 250 μg synthetic ACTH (1–24) (Cortrosyn, Daiichi Pharmaceutical Co., Tokyo, Japan). The serum cortisol levels were measured in blood samples collected before and 30 and 60 minutes after the administration. A cut-off value of 18 μg/dL (500 nmol/L) for peak serum cortisol levels was used for HPA insufficiency diagnosis [2]. The 65 patients were divided into two groups according to the peak cortisol level: the impaired HPA axis group (those with a peak cortisol level <18 μg/dL (n = 37)) and the intact HPA axis group (those with a peak cortisol level ≥18 μg/dL (n = 28)).
Statistical analysis
Each measured serum DHEA-S level (X) was converted into an SD score using the age- and sex-specific upper limit of DHEA-S level (A) and the age- and sex-specific lower limit of DHEA-S level (B), both of which were provided by the kit manufacturer. The age- and sex-specific upper and lower limits of DHEA-S level are shown in Supplementary Table 1. A ln DHEA-S SD score was calculated using the following formula: ln DHEA-S SD score = 2*ln(X/AB)/ln(A/AB). Differences between men and women were evaluated using the χ2 test. Between-group comparisons were performed using the non-parametric Mann–Whitney U test in the analysis of measured serum DHEA-S levels. Meanwhile, the parametric Student’s t-test was used in the analysis of ln DHEA-S SD scores. Correlations were assessed by using Spearman’s correlation coefficient analysis. Furthermore, the univariate analysis was used to examine the association between the peak cortisol level and the ln DHEA-S SD score, while logistic regression analysis was used to provide a line that predicted the existence of HPA insufficiency. All statistical analyses were performed with R version 3.6.1 (The R Foundation for Statistical Computing, Vienna, Austria). Two-tailed p values of <0.05 were considered significant.
Results
Between-group comparison of DHEA-S
The clinical diagnoses of the impaired HPA axis group were shown in Table 1. Both the raw serum DHEA-S levels and the ln DHEA-S SD scores were significantly higher in the intact HPA axis group than in the impaired HPA axis group (Table 2). In both groups, the distribution of untransformed DHEA-S levels was non-parametric, whereas that of ln DHEA-S SD score was parametric. Fig. 1 shows the measured serum DHEA-S and the ln DHEA-S SD scores in the intact and impaired HPA axis groups.
Table 1
Final diagnoses of the impaired HPA axis group
| Clinical disorder |
No. of patients |
| Iatrogenic adrenal insufficiency due to prolonged use of glucocorticoids |
19 |
| Isolated ACTH deficiency |
12 |
| Non-functioning pituitary adenoma |
2 |
| Sheehan’s syndrome |
1 |
| Postoperative adrenal Cushing’s syndrome |
1 |
| Unknown (No obvious diseases were found) |
2 |
Abbreviations: ACTH, adrenocorticotropic hormone; HPA axis, hypothalamic-pituitary-adrenal axis
Table 2
Characteristics of the intact and impaired HPA axis groups
| Groups |
Intact HPA axis |
Impaired HPA axis |
p |
| n (Female) |
28 (19) |
37 (18) |
0.195 |
| Age (years), median (range) |
51
(25–85) |
58
(25–87) |
0.591 |
| DHEA-S (ng/mL), median (range) (n) |
| 21–30 years |
2,070
(829–2,210) (4) |
1,538.5
(127–2,950) (2) |
1 |
| 31–40 years |
1,322
(754–1,473) (3) |
719
(65–2,352) (8) |
0.776 |
| 41–50 years |
1,251
(578–2,103) (7) |
273
(237–1,017) (5) |
<0.05 |
| 51–60 years |
714
(588–810) (3) |
292
(20–947) (6) |
0.167 |
| 61–70 years |
595
(395–795) (2) |
198.5
(43–707) (4) |
0.267 |
| ≥71 years |
444
(160–1,482) (9) |
140.5
(24–1,067) (12) |
<0.05 |
| All age groups |
802.5
(160–2,210) (28) |
249.0
(20–2,950) (37) |
<0.05 |
| ln DHEA-S SD score, median (mean ± SD) (n) |
| 21–30 years |
0.6
(0.5 ± 0.8) (4) |
–1.0
(–1.0 ± 2.0) (2) |
0.211 |
| 31–40 years |
0.9
(0.6 ± 0.6) (3) |
–0.6
(–0.8 ± 1.9) (8) |
0.245 |
| 41–50 years |
0.2
(0.1 ± 0.5) (7) |
–1.6
(–2.2 ± 1.2) (5) |
<0.05 |
| 51–60 years |
0.5
(0.2 ± 0.7) (3) |
–2.6
(–2.6 ± 1.5) (6) |
<0.05 |
| 61–70 years |
0.6
(0.6 ± 0.8) (2) |
–2.5
(–2.2 ± 1.8) (4) |
0.113 |
| ≥71 years |
0.3
(0.3 ± 0.8) (9) |
–1.0
(–1.2 ± 1.4) (12) |
<0.05 |
| All age groups |
0.3
(0.3 ± 0.7) (28) |
–1.6
(–1.6 ± 1.6) (37) |
<0.05 |
| Baseline cortisol level (μg/dL), median (range) |
9.1
(4.1–13.8) |
3.3
(0.1–11.9) |
<0.05 |
| Peak cortisol level (μg/dL), median (range) |
22.7
(18.4–34.1) |
13.6
(1.6–17.6) |
|
* Impaired HPA axis is defined by a peak cortisol level <18 μg/dL after ACTH stimulation.
Abbreviations: ACTH, adrenocorticotropic hormone; DHEA-S, dehydroepiandrosterone sulfate; HPA axis, hypothalamic-pituitary-adrenal axis; ln DHEA-S SD score, standard deviation score of logarithmically transformed DHEA-S

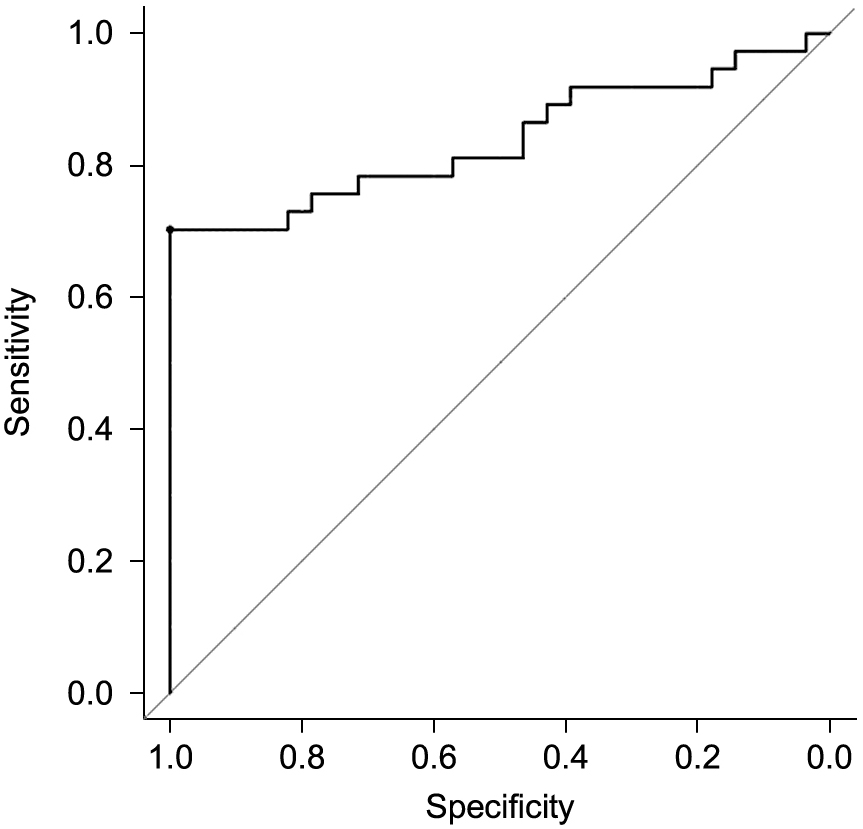
The association between DHEA-S and the peak cortisol level after ACTH stimulation was evaluated in all subjects. Both the measured DHEA-S levels and the ln DHEA-S SD scores were positively correlated with the peak cortisol levels (Fig. 2). The subjects were distributed in a more linear manner when plotted using the ln DHEA-S SD scores. The ln DHEA-S SD score was a significant predictor of the peak cortisol level in the univariate analysis of the peak cortisol level (β-coefficient: 3.60 [95% CI: 2.68–4.52], p < 0.05). Similarly, this score was shown to be a significant predictor of the existence of HPA insufficiency in the logistic regression analysis of HPA insufficiency (OR: 0.27 [95% CI: 0.14–0.53], p < 0.05). Moreover, in the ROC curve analysis, the optimal cut-off value of ln DHEA-S SD score for impaired HPA function was –0.853, with a sensitivity of 70.3%, a specificity of 100%, a positive predictive value of 100%, and a negative predictive value of 71.8% (area under the curve: 0.838 [95% CI: 0.738–0.938], p < 0.05, Fig. 3).

Finally, based on the results of the ROC curve analysis, we divided the impaired HPA axis group into two subgroups according to the ln DHEA-S SD score: the normal DHEA-S subgroup (those with a ln DHEA-S SD score ≥–0.853 [n = 11]) and the subnormal DHEA-S subgroup (those with a ln DHEA-S SD score <–0.853 [n = 26]). Details of patients belonging to the normal DHEA-S subgroup are presented in Table 3. Between-group comparisons showed that baseline ACTH and cortisol and peak cortisol levels were significantly higher in the normal DHEA-S subgroup compared with the subnormal DHEA-S subgroup (Table 4).
Table 3
Details of patients with reduced peak cortisol levels and normal ln DHEA-S SD scores
| Case |
Age (years) |
Sex |
Diseases |
Prescribed steroid at the time of examination |
Cortisol level after ACTH stimulation (μg/dL) |
Baseline ACTH level (pg/mL) |
ln DHEA-S SD score |
| Baseline |
30 minutes |
60 minutes |
| 1 |
35 |
F |
IAD |
— |
3.3 |
10.8 |
14.6 |
8.5 |
1.34 |
| 2 |
71 |
M |
IAD |
— |
8.9 |
14.2 |
16.3 |
40.3 |
1.12 |
| 3 |
33 |
F |
IAD |
— |
3.0 |
13.5 |
17.6 |
13.5 |
1.04 |
| 4 |
34 |
F |
IAD |
HC 10 mg/day |
6.5 |
14.6 |
17.6 |
46 |
0.55 |
| 5 |
76 |
M |
IAD |
— |
6.9 |
13.3 |
17.1 |
79.9 |
0.33 |
| 6 |
38 |
M |
IAD |
— |
8.1 |
10.3 |
11.8 |
50.1 |
0.16 |
| 7 |
80 |
M |
IAD |
— |
9 |
13.2 |
14.9 |
30.3 |
–0.40 |
| 8 |
25 |
M |
IAI |
PSL 2 mg/day |
11.7 |
15.0 |
16.7 |
62.2 |
0.38 |
| 9 |
74 |
F |
IAI |
HC 15 mg/day |
11 |
12.6 |
13.6 |
41.2 |
0.34 |
| 10 |
63 |
M |
IAI |
HC 15 mg/day |
9.3 |
13.9 |
16.2 |
24.3 |
–0.14 |
| 11 |
58 |
M |
IAI |
— |
5.6 |
13.9 |
16.2 |
30.3 |
–0.27 |
Abbreviations: ACTH, adrenocorticotropic hormone; F, female; HC, hydrocortisone; IAD, isolated ACTH deficiency; IAI, iatrogenic adrenal insufficiency; M, male; PSL, prednisolone; ln DHEA-S SD score, standard deviation score of logarithmically transformed dehydroepiandrosterone sulfate
Table 4
Characteristics of the normal and subnormal ln DHEA-S SD score subgroups of the impaired HPA axis group
| Subgroups |
Normal ln DHEA-S SD score |
Subnormal ln DHEA-S SD score |
p |
| n (Female) |
11 (4) |
26 (14) |
0.540 |
| Age (years), median (range) |
59
(25–83) |
57.5
(25–87) |
0.739 |
| DHEA-S (ng/mL), median (range) |
1,067
(154–2,950) |
166
(20–1,017) |
<0.05 |
| Baseline ACTH level (pg/mL), median (range) |
41.2
(8.5–106.2) |
11.6
(1.0–112.5) |
<0.05 |
| Baseline cortisol level (μg/dL), median (range) |
8.1
(3.0–11.7) |
1.7
(0.1–11.9) |
<0.05 |
| Peak cortisol level (μg/dL), median (range) |
16.2
(11.8–17.6) |
9.8
(1.6–17.6) |
<0.05 |
Abbreviations: ACTH, adrenocorticotropic hormone; DHEA-S, dehydroepiandrosterone sulfate; ln DHEA-S SD score, standard deviation score of logarithmically transformed DHEA-S
Discussion
Although serum DHEA-S levels have been known to reflect adrenocortical function, there have been some difficulties in using them for the diagnosis of HPA insufficiency. The findings of this study show that the ln DHEA-S SD score is a useful indicator of HPA axis function. Its optimal cut-off value for impaired HPA function was –0.853, and this had a sensitivity of 70.3% and a specificity of 100%. Analysis of subgroups divided based on this cut-off value revealed that HPA axis function was regarded as relatively preserved in patients with ln DHEA-S SD scores above or equal to –0.853 compared with that in patients with scores below –0.853.
It is well known that two androgens are specifically secreted from the adrenal cortex: dehydroepiandrosterone (DHEA) and its sulfoconjugated ester, DHEA-S. Although they are regarded as androgens, there is a minimal contribution of the gonads to their synthesis, which is thus unaffected by hypogonadism or menopause [5, 9, 10]. DHEA is secreted synchronously with cortisol from the adrenal cortex [11] and has a half-life of 1–3 hours [10]. On the other hand, serum DHEA-S has a longer serum half-life of approximately 20 hours [12] and exhibits little diurnal and seasonal variation [6]. There have been attempts to use DHEA-S as a candidate indicator to assess HPA axis function. However, measured DHEA-S is distributed non-parametrically in all age groups and is skewed to higher values. In addition, especially in elderly people, normal reference ranges for measured DHEA-S concentrations are so low that it is difficult to interpret them [9]. Meanwhile, a previous study showed that serum DHEA-S exhibits a more normal distribution when log-transformed [6]. Therefore, according to the assay kit manufacturer’s information that the reference range of our kit applies to 95% of the normal population, we calculated the ln DHEA-S SD scores based on the hypothesis that the log-transformed upper and lower limits reflect the +2SD and –2SD, respectively. Once calculated, this score could be used as a parameter to evaluate adrenocortical function, no longer worrying about the subject’s age- and sex-specific normal range.
In this study, the ln DHEA-S SD score had a sensitivity of 70.3% and a specificity of 100% when using an optimal cut-off value of –0.853 to diagnose impaired HPA function. Its sensitivity was not so good as its specificity because there were 11 patients (29.7%) above this cut-off value in the impaired HPA axis group. We confirmed that none of the 11 patients were taking DHEA supplements. Further analyses indicated that HPA axis function was significantly more preserved in these 11 patients than in those with peak cortisol levels <18 μg/dL and ln DHEA-S SD scores <–0.853. These 11 patients consisted of 7 patients with isolated ACTH deficiency (IAD) and 4 patients with iatrogenic adrenal insufficiency (IAI) due to prolonged use of glucocorticoids. As for the four patients with IAI, all of them had received long-term (more than 4 weeks) treatment. As a matter of fact, patients who had undergone only short-term (≤4 weeks) pharmacological doses of glucocorticoids were not even tested in the first place, because their adrenocortical function could safely be regarded as intact [13]. While our study observed a discrepancy, i.e., insufficient stimulated cortisol levels and normal ln DHEA-S SD scores in 11 patients, previous studies demonstrated that intact cortisol secretion and subnormal DHEA-S secretion could be seen for a while during progression into AI or recovery from prolonged exposure to supraphysiological glucocorticoid. Topor et al. demonstrated in vitro that in human adrenocortical cells, DHEA secretion is stimulated by cortisol in a dose-dependent manner [14]. Clinically, Kassem et al. showed that in the early phase of secondary AI, impairment of adrenal androgen secretion precedes that of glucocorticoid secretion [9]. Nawata et al. revealed a delayed recovery of DHEA-S secretion as compared to cortisol secretion, after removal of cortisol-producing adrenocortical adenoma [15], suggesting that sufficient cortisol secretion is a prerequisite for normal production of DHEA and DHEA-S. The reason why 11 patients in our study exhibited normal DHEA-S levels without sufficient ACTH-stimulated cortisol secretion, as opposed to what is usually observed during the recovery from suppressed HPA axis [15], remains to be elucidated. The underlying mechanisms of dissociation between adrenal androgens and cortisol levels have not yet been fully defined and require further research.
Regarding how to make use of DHEA-S levels clinically, previous studies have also attempted to adjust skewed distribution and differences between sex and age of DHEA-S. Fischli et al. calculated the z-scores for DHEA-S using reference curves that were developed by fitting two separate half-normal distributions to the age- and sex-specific ranges provided by the assay kit manufacturer [7]. The age- and sex-specific z-score was useful to perfectly predict HPA axis insufficiency in individuals up to 30 years old. However, its sensitivity decreased to 70% in individuals older than 50 years, and the scores were similar between the intact and impaired HPA axis subjects between 31 and 50 years. In another attempt, Charoensri et al. used the ratio of the measured DHEA-S value to the lower limit of the respective reference range and showed that the area under the curve was 0.920 (95% CI: 0.844–0.997) with 100% sensitivity [8]. However, they showed no results about specificity, a positive predictive value, and a negative predictive value. It is difficult to evaluate the usefulness of this ratio due to their limited data. Compared with these previous attempts, the ln DHEA-S SD score is more convenient because it can be easily calculated at any hospital just by obtaining the information on the upper and lower limits of the reference range. Also, we think that it would be definitely better to take the upper limit into consideration as well, in order to deal with highly variable DHEA-S levels.
The DHEA-S levels corresponding to –0.853 of ln DHEA-S SD score of each 10-year age group are shown in Supplementary Table 2. Because the ln DHEA-S SD score was calculated using upper and lower limits of healthy individuals, a small but significant number of healthy individuals could be judged to have AI if we relied on this score alone. In this study, we dealt with the patients suspected of having HPA insufficiency based on their clinical manifestations or underlying diseases, but not healthy subjects. Thus, it is important to note that this score is useful when applied to the patients whose probability of having HPA insufficiency is high. Even in such patients, it would be prudent not to evaluate HPA axis function solely on the basis of ln DHEA-S SD score, because its sensitivity for the diagnosis of AI, which is potentially life-threatening, is 70.3%. However, subgroup analysis of the subjects with inadequate ACTH-stimulated cortisol response revealed that those with normal DHEA-S levels had only relatively mild AI, compared with those with subnormal DHEA-S levels. Thus, even though ln DHEA-S score may not be a perfect surrogate for the rapid ACTH stimulation test, it may still be useful to at least exclude severe AI. For example, if a patient exhibits a slightly subnormal peak cortisol level but a normal ln DHEA-S SD score, it may be reasonable to prescribe only small doses of hydrocortisone (e.g., 5–10 mg regularly in the morning or only in times of stress).
There are some limitations to our study. First, HPA axis function was assessed based on the rapid ACTH stimulation test, but not ITT. Second, our sample size did not allow for further stratification of the subjects according to the causes of HPA insufficiency, etc. Third, the data on factors which may influence DHEA-S but not HPA axis (e.g., prolactin, chronic inflammation, and some medications) were not available, and thus were not evaluated in this study. Finally, although the ln DHEA-S SD score is adjusted with age and sex, it remains to be elucidated whether this score is appropriate for longitudinal comparison because our study design was cross-sectional. We think that analyzing more samples and establishing more detailed reference ranges, especially in young and elderly people, would improve the usefulness of the ln DHEA-S SD score.
In conclusion, the ln DHEA-S SD score can be used as a valuable marker of the integrity of the HPA axis without concerns about the age- and sex-specific reference ranges. This score may help accurately diagnose HPA insufficiency.
Acknowledgements
We thank the members of the division of medical informatics of the Teikyo University Hospital for data retrieval.
Grants or Fellowships
This research did not receive any specific grant from any funding agency in the public, commercial, or not-for-profit sector.
Disclosure Statement
The authors have nothing to disclose.
Data Availability
The datasets generated and/or analyzed during the current study are not publicly available but are available from the corresponding author on reasonable request.
Supplementary Table 1
Reference values of Access DHEA-S Chemiluminescent Enzyme Immunoassay from Beckman–Coulter, for each age and sex group
| Age (years) |
Male (ng/mL) |
Female (ng/mL) |
| 18–20 |
240–5,370 |
510–3,210 |
| 21–30 |
850–6,900 |
180–3,910 |
| 31–40 |
1,060–4,640 |
230–2,660 |
| 41–50 |
700–4,950 |
190–2,310 |
| 51–60 |
380–3,130 |
80–1,880 |
| 61–70 |
240–2,440 |
120–1,330 |
| ≥71 |
50–2,530 |
70–1,770 |
Supplementary Table 2
DHEA-S levels corresponding to ln DHEA-S SD scores of –0.853
| Age, years |
Male (ng/mL) |
Female (ng/mL) |
| 18–20 |
582 |
864 |
| 21–30 |
1,550 |
435 |
| 31–40 |
1,619 |
464 |
| 41–50 |
1,227 |
389 |
| 51–60 |
695 |
198 |
| 61–70 |
467 |
239 |
| ≥71 |
154 |
177 |
References
- 1 Hahner S, Loeffler M, Bleicken B, Drechsler C, Milovanovic D, et al. (2010) Epidemiology of adrenal crisis in chronic adrenal insufficiency: the need for new prevention strategies. Eur J Endocrinol 162: 597–602.
- 2 Yanase T, Tajima T, Katabami T, Iwasaki Y, Tanahashi Y, et al. (2016) Diagnosis and treatment of adrenal insufficiency including adrenal crisis: a Japan Endocrine Society clinical practice guideline. Endocr J 63: 765–784.
- 3 Takahashi K, Nakamura A, Miyoshi H, Nomoto H, Kameda H, et al. (2017) Factors associated with an inadequate hypoglycemia in the insulin tolerance test in Japanese patients with suspected or proven hypopituitarism. Endocr J 64: 387–392.
- 4 Yamaji T, Ishibashi M, Takaku F, Itabashi A, Katayama S, et al. (1987) Serum dehydroepiandrosterone sulfate concentrations in secondary adrenal insufficiency. J Clin Endocrinol Metab 65: 448–451.
- 5 Nasrallah MP, Arafah BM (2003) The value of dehydroepiandrosterone sulfate measurements in the assessment of adrenal function. J Clin Endocrinol Metab 88: 5293–5298.
- 6 Orentreich N, Brind JL, Rizer RL, Vogelman JH (1984) Age changes and sex differences in serum dehydroepiandrosterone sulfate concentrations throughout adulthood. J Clin Endocrinol Metab 59: 551–555.
- 7 Fischli S, Jenni S, Allemann S, Zwahlen M, Diem P, et al. (2008) Dehydroepiandrosterone sulfate in the assessment of the hypothalamic-pituitary-adrenal axis. J Clin Endocrinol Metab 93: 539–542.
- 8 Charoensri S, Chailurkit L, Muntham D, Bunnag P (2017) Serum dehydroepiandrosterone sulfate in assessing the integrity of the hypothalamic-pituitary-adrenal axis. J Clin Transl Endocrinol 7: 42–46.
- 9 Sayyed Kassem L, El Sibai K, Chaiban J, Abdelmannan D, Arafah BM (2012) Measurements of serum DHEA and DHEA sulphate levels improve the accuracy of the low-dose cosyntropin test in the diagnosis of central adrenal insufficiency. J Clin Endocrinol Metab 97: 3655–3662.
- 10 Kroboth PD, Salek FS, Pittenger AL, Fabian TJ, Frye RF (1999) DHEA and DHEA-S: a review. J Clin Pharmacol 39: 327–348.
- 11 Rosenfeld RS, Hellman L, Roffwarg H, Weitzman ED, Fukushima DK, et al. (1971) Dehydroisoandrosterone is secreted episodically and synchronously with cortisol by normal man. J Clin Endocrinol Metab 33: 87–92.
- 12 Legrain S, Massien C, Lahlou N, Roger M, Debuire B, et al. (2000) Dehydroepiandrosterone replacement administration: pharmacokinetic and pharmacodynamic studies in healthy elderly subjects. J Clin Endocrinol Metab 85: 3208–3217.
- 13 Woodcock T, Barker P, Daniel S, Fletcher S, Wass JAH, et al. (2020) Guidelines for the management of glucocorticoids during the peri-operative period for patients with adrenal insufficiency: Guidelines from the Association of Anaesthetists, the Royal College of Physicians and the Society for Endocrinology UK. Anaesthesia 75: 654–663.
- 14 Topor LS, Asai M, Dunn J, Majzoub JA (2011) Cortisol stimulates secretion of dehydroepiandrosterone in human adrenocortical cells through inhibition of 3βHSD2. J Clin Endocrinol Metab 96: E31–E39.
- 15 Nawata H, Higuchi K, Yanase T, Takayanagi R, Kato K, et al. (1985) Mechanism of dissociation of cortisol and adrenal androgen secretion after removal of adrenocortical adenoma in patients with Cushing’s syndrome. Endocrinol Jpn 32: 691–700.