Abstract
Only a few studies of continuous glucose monitoring (CGM) in patients with steroid diabetes have been published. Therefore, we investigated all patients with type 2 diabetes (n = 121) and steroid diabetes (n = 40) who used the FreeStyle Libre Pro® device (Abbott Japan) at Gunma University Hospital between 2017 and 2019. Glycated hemoglobin (HbA1c), mean sensor glucose (SG), and glucose management indicator values were similar in both groups. However, the indices for glycemic variabilities, expressed as standard deviations and percent coefficients of variation, were higher in patients with steroid diabetes than in those with type 2 diabetes. The associations between HbA1c, mean SG, and time in range (TIR) when glucose values were 70–180, <70, or >180 mg/dL were assessed using Pearson’s product-moment correlation coefficient, which demonstrated good correlations in both patient groups. However, patients with steroid diabetes had a higher SG and lower TIR than did counterparts with type 2 diabetes who had similar HbA1c levels. To examine the effect of prednisolone on CGM data, we divided patients with steroid diabetes into 2 subgroups according to prednisolone dose (≤5 and >5 mg), and found that the dose of this steroid impacted the associations between HbA1c and CGM data, mean SG, and TIR. In summary, our data highlight the importance of cautiously interpreting CGM data and the optimal HbA1c level in patients with steroid diabetes to prevent diabetes-related complications. Further analyses using other CGM devices are necessary to further validate our findings.
STEROID DIABETES is a common sequela of drug-induced diabetes wherein oral glucocorticoids induce insulin resistance [1]. Since the effects of glucocorticoids peak in the early afternoon regardless of food intake, it is difficult to neutralize these glucose fluctuations even with multiple daily insulin injections [2, 3].
Continuous glucose monitoring (CGM) systems measure patients’ glycemic profiles continuously over a few days [4]. Moreover, the A1c-Derived Average Glucose study established a strong correlation between average glucose levels and glycated hemoglobin (HbA1c), calculated as follows: average glucose (mg/dL) = 28.7 × HbA1c (%) – 46.7 [5, 6]. As such, the HbA1c can be estimated using the mean sensor glucose (SG) values measured via CGM; this estimated HbA1c is referred to as the glucose management indicator (GMI) [7]. Additionally, The International Consensus in Time in Range (TIR) recently proposed that the TIR, time below range (TBR), and time above range (TAR) be regarded as key CGM metrics for glycemic control [7-9]. The correlation between HbA1c and TIR has been established in a number of studies that encompassed patients of a wide age range who used various insulin control technologies. However, only few studies of CGM among patients with steroid diabetes have been published. The goal of this investigation was to address this gap in knowledge.
Materials and Methods
This study was approved by the Gunma University Institutional Review Board (ID 150008), and conformed to the provisions of the Declaration of Helsinki (as revised in Fortaleza, Brazil, October 2013). Patients provided written informed consent before undergoing any study-related procedures. All patients with type 2 diabetes and steroid diabetes who used the FreeStyle Libre Pro® device (Abbott Japan) at Gunma University Hospital between 2017 and 2019 were reviewed. The underlying diseases for which patients were treated with the steroid prednisolone (PSL) are listed in Table 1 (few patients had more than one of these diseases, resulting in overlap). Anemic patients (i.e., men and women with hematocrit values of <39% and <36%, respectively) and those with compromised glucose levels (such as pregnant women) were excluded from the study, as were patients treated with iron or erythropoietin preparations. The CGM data were downloaded, and the proportions of times during which glucose values were between 70 and 180 mg/dL (TIR), below 70 mg/dL (TBR), and above 180 mg/dL (TAR) were calculated. Our analysis excluded days 0–1 and 13–14, when the mean absolute relative difference is typically high [10]. Our mean examination period was 11.5 ± 0.7 days for patients with type 2 diabetes patients and 10.9 ± 0.4 days for those with steroid diabetes. HbA1c levels were measured within 1 month after CGM. All continuous variables are expressed as means ± standard deviations. The associations between HbA1c levels, TIR, TBR, and TAR were assessed using Pearson’s product-moment correlation coefficients.
Table 1
Comorbidities of patients included in the study
|
# No. of patients |
| Post-kidney transplant diabetes |
7 |
| Dermatomyositis/Polymyositis |
7 |
| Interstitial pneumonia |
3 |
| Microscopic polyangiitis |
3 |
| Lymphocytic hypophysitis |
2 |
| Immune thrombocytopenia |
2 |
| Rheumatoid arthritis |
2 |
| Granulomatosis with polyangiitis |
2 |
| IgG4-related disease |
2 |
| Eosinophilic gastroenteritis |
2 |
| Pemphigus vulgaris |
1 |
| Crohn disease |
1 |
| Acquired hemophilia |
1 |
| Renal cell cancer |
1 |
| Sarcoidosis |
1 |
| Eosinophilic pneumonia |
1 |
| Cholesterol embolism |
1 |
| Systemic scleroderma |
1 |
| Sjogren’s syndrome |
1 |
| Posterior scleritis |
1 |
Results
The profiles of the 161 patients included in this study are shown in Table 2. The duration of steroid diabetes was not significantly different from that of type 2 diabetes among the respective patients, although the mean body mass index of the former group was significantly lower than that of the latter. Meanwhile, age, HbA1c, and estimated glomerular filtration rates were not significantly different between the 2 groups. Levels of serum C peptide (which indicates endogenous insulin secretion) were substantially higher in patients with steroid diabetes than in those with type 2 diabetes. The proportion of patients with steroid diabetes who did not require medication was 5 times more than that of patients with type 2 diabetes. On the other hand, the administration of sulfonylurea, dipeptidyl peptidase-4 inhibitor, and glucagon-like peptide-1 receptor agonist (which stimulates insulin secretion from beta cells) by patients with type 2 diabetes was 1.5–4 times more frequent than that by patients with steroid diabetes, indicating that endogenous insulin secretion was lower in patients with type 2 diabetes and that those with steroid diabetes were more resistant to insulin.
Table 2
Characteristics of patients included in the study
|
Type 2 diabetes |
Steroid diabetes |
p-value |
| N (male/female) |
121 (54/67) |
40 (17/23) |
0.197 |
| Age (years) |
62.2 ± 9.9 |
60.0 ± 10.8 |
0.41 |
| Duration of diabetes |
14.0 ± 7.3 |
12.9 ± 8.1 |
0.297 |
| Body mass index |
25.4 ± 3.7 |
23.0 ± 3.1 |
0.007 |
| HbA1c (%) |
7.8 ± 0.8 |
7.6 ± 0.8 |
0.167 |
| eGFR (mL/min) |
73.9 ± 19.5 |
67.7 ± 21.2 |
0.124 |
| C-peptide index |
1.3 ± 0.8 |
2.0 ± 1.0 |
0.003 |
| Diet (%) |
2.5 |
12.5 |
|
| Sulfonylurea (%) |
14 |
7.5 |
|
| Glinide (%) |
12.4 |
10 |
|
| Dipeptidyl peptidase-4 inhibitor (%) |
30.6 |
20 |
|
| Biguanide (%) |
35.5 |
40 |
|
| α-Glucosidase inhibitor (%) |
25.6 |
12.5 |
|
| Sodium glucose cotransporter 2 inhibitor (%) |
32.2 |
12.5 |
|
| Thiazolidine (%) |
0.8 |
2.5 |
|
| Glucagon-like peptide-1 receptor agonist (%) |
22.3 |
5 |
|
| Insulin (%) |
67.8 |
75 |
|
| Mean glucose (mg/dL) |
158 ± 28.1 |
168 ± 38.5 |
0.102 |
| GMI (%) |
7.1 ± 1.0 |
7.5 ± 0.2 |
0.102 |
| SD glucose (mg/dL) |
48.8 ± 12.6 |
gluc3 ± 14.1 |
0.006 |
| Percent CV |
30.9 ± 5.1 |
34.3 ± 3.9 |
0.003 |
| TIR (%) |
67.7 ± 14.1 |
62.0 ± 15.1 |
0.061 |
| TBR (<70) (%) |
3.0 ± 4.0 |
3.7 ± 4.8 |
0.24 |
| TBR (<54) (%) |
0.7 ± 1.5 |
0.9 ± 1.5 |
0.317 |
| TAR (>180) (%) |
29.3 ± 14.9 |
34.3 ± 16.1 |
0.103 |
| TAR (>250) (%) |
8.2 ± 9.7 |
12.1 ± 12.0 |
0.073 |
HbA1c, glycated hemoglobin; eGFR, estimated glomerular filtration rate; GMI, glucose management indicator; SD, standard deviation; CV, coefficient of variation; TIR, time in range; TBR, time below range; TAR, time above range.
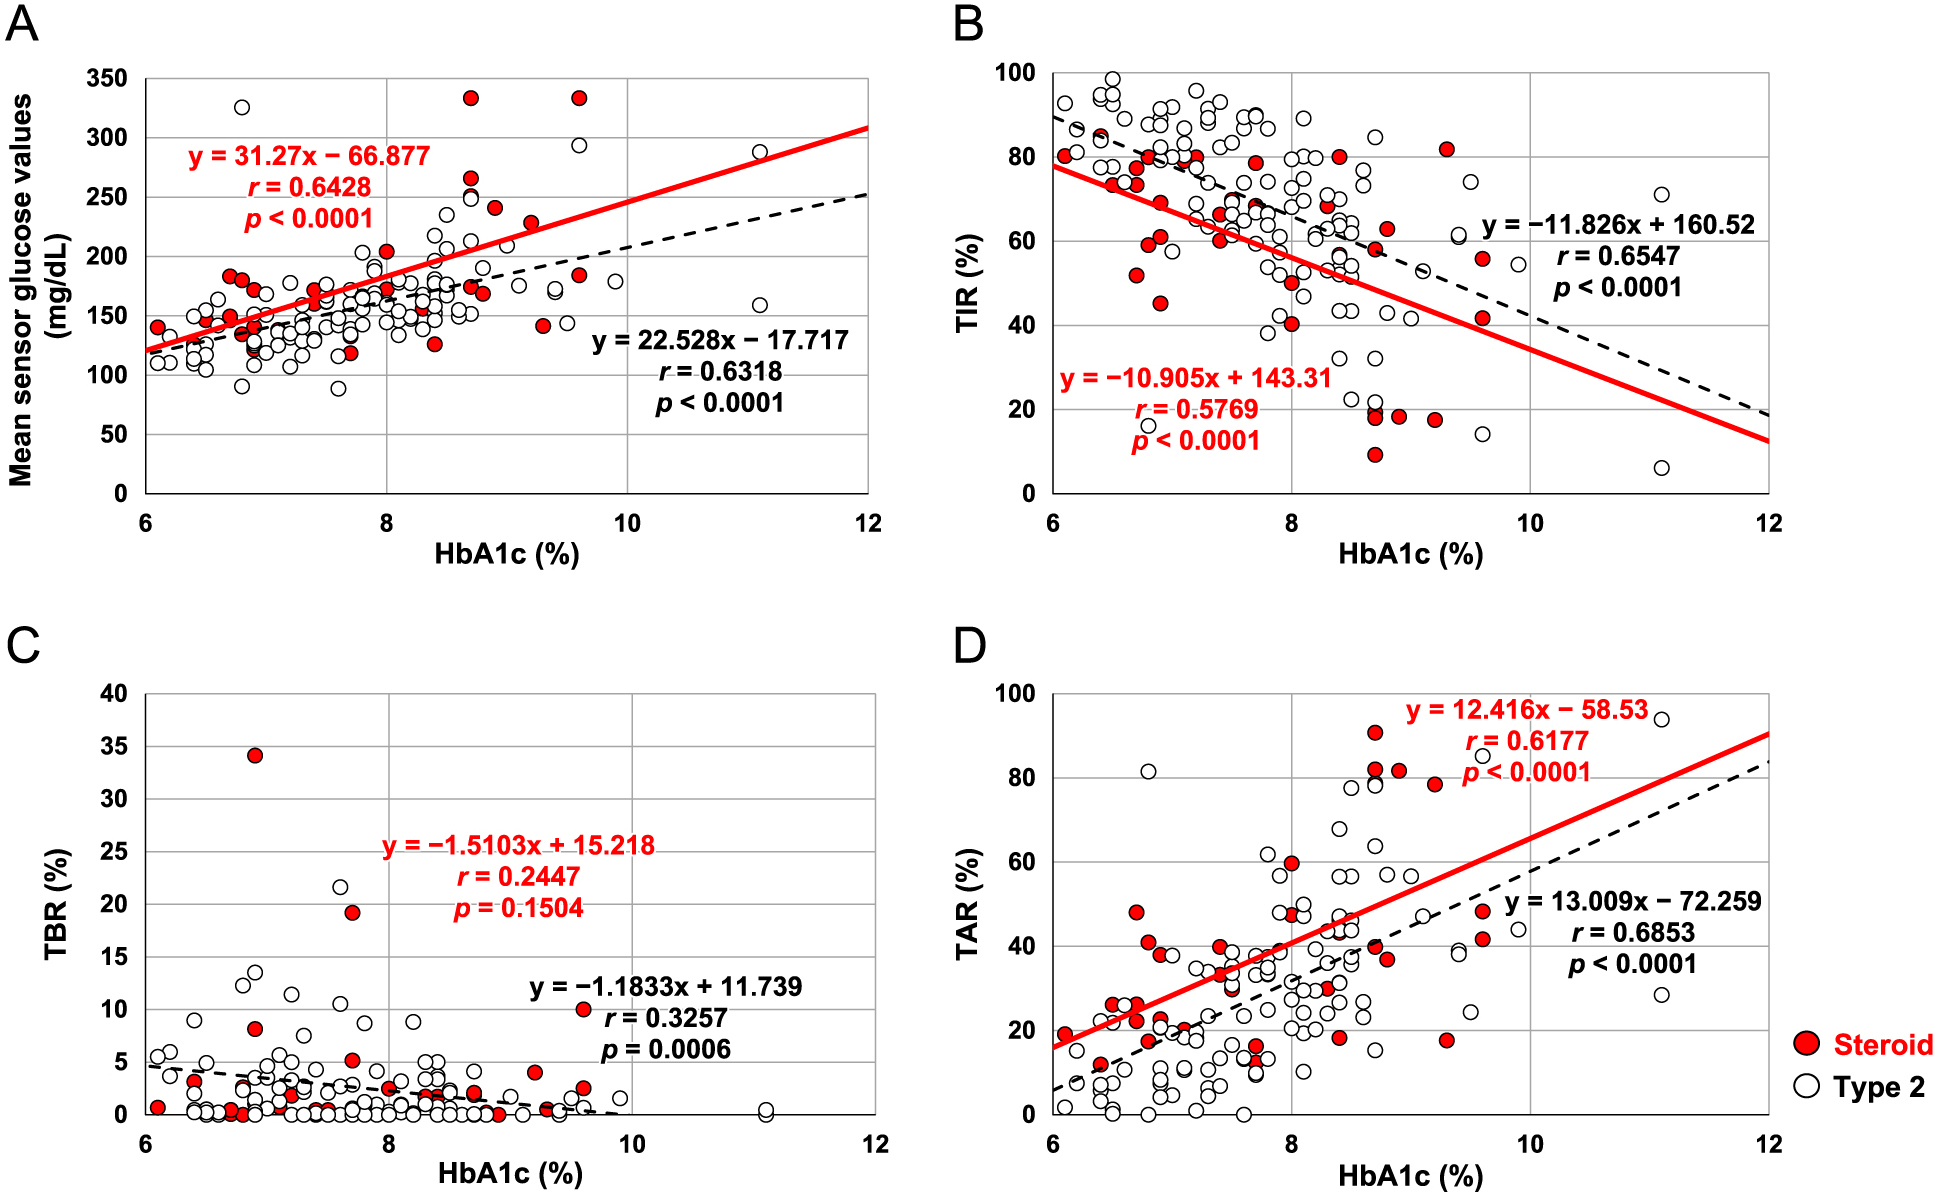
The mean SG values as well as the GMIs derived from them were similar in both diabetes groups. The indices for glycemic variabilities (GVs), expressed as the standard deviation (SD) and percent coefficient of variation (CV), were higher in patients with steroid diabetes than in those with type 2 diabetes (Table 1). Additionally, CGM metrics such as the TIR, TBR, and TBR did not significantly differ between the 2 groups; however, detailed analyses demonstrated that the correlation between HbA1c and mean SG did differ between the groups. Among patients with similar HbA1c levels, those with steroid diabetes had a higher SG (Fig. 1A). While the correlations between HbA1c and TBR were identical, those between HbA1c and each of TIR and TAR were the inverse of each other in that patients with steroid diabetes had a lower TIR and higher TAR than did counterparts with type 2 diabetes who had similar HbA1c levels (Fig. 1B, C, D).
The doses of administered PSL are shown in Fig. 2A; the mean dose was 7.6 ± 4.5 mg and the median was 5 mg. To examine the effect of PSL on CGM data, we divided patients with steroid diabetes into 2 subgroups based on PSL dose: those treated with ≤5 mg (n = 24) and those who received >5 mg (n = 14). Although the analysis may have been underpowered given the small number of patients, the correlations between the HbA1c, mean SG, and TIR differed between these 2 subgroups (Fig. 2B, C). Given that the GV indices were not significantly different between the subgroup that received ≤5 mg PSL and that which received >5 mg (SD: 57.7 ± 16.3 vs. 57.3 ± 10.1, p = 0.474; %CV 34.8 ± 3.7 vs. 34.1 ± 4.4, p = 0.346), the dose of PSL appeared to be influencing the CGM data whereas the GVs did not. In this respect, the HbA1c values were not significantly different between the subgroup that received ≤5 mg PSL and that which received >5 mg (7.5 ± 0.2% vs. 8.0 ± 0.5%, p = 0.088), although they tended to be higher in the latter subgroup; meanwhile, the GMI values were almost the same (7.4 ± 0.4% vs. 7.3 ± 0.4%, p = 0.439). As evident by the overlapping graphs (Fig. 2B, C, D), patients treated with ≤5 mg PSL demonstrated correlations similar to those of the entire steroid diabetes group (light blue line vs. red line) given that the majority of patients with steroid diabetes received exactly 5 mg of PSL. On the other hand, patients treated with >5 mg PSL exhibited similar correlations between mean SG and HbA1c as did patients with type 2 diabetes (dark blue line vs. dashed black line) (Fig. 2B); however, patients treated with >5 mg PSL exhibited different correlations between TIR, TBR, and HbA1c than did those with type 2 diabetes (dark blue line vs. dashed black line) (Fig. 2C, D), indicating that the dose of PSL might influence the correlations between TIR, TBR, and HbA1c as derived from CGM data without changing the GVs.

Discussion
The CGM data showed a good correlation between the HbA1c and mean SG in both patients with steroid diabetes and those with type 2 diabetes; however, the extents of these correlations were different between these patient groups. When using the FreeStyle Libre Pro device, CGM is reportedly less accurate if the GV is significantly elevated (e.g., when the %CV is >36%) [7]. Therefore, our data were likely influenced by glucose fluctuations inherent in patients with steroid diabetes. It has been reported that dipeptidyl peptidase-4 inhibitors, sodium–glucose cotransporter 2 inhibitors, and glucagon-like peptide-1 receptor agonists significantly improve the accuracy of measures such as the mean amplitude of glucose excursions and CGM standard deviations [11]. Indeed, patients with steroid diabetes in our study were administered these agents less frequently than were those with type 2 diabetes, suggesting that these medications themselves might have influenced glucose fluctuations and thus the accuracy of CGM. However, in our study, the GV of patients with steroid diabetes was lower than that previously reported for patients with type 1 diabetes [7-9]. In this regard, it has been reported that the dose of steroid influences HbA1c levels, even amounts as low as 5 mg PSL [12, 13]. The median PSL dose in our study was 5 mg, and HbA1c values were not significantly different between patients administered this median dose. However, when dividing patients with steroid diabetes into the 2 PSL dosing subgroups, the actual HbA1c values (while trending apart) were not significantly different between them, whereas the GMIs were almost the same. More interestingly, patients with steroid diabetes treated with >5 mg PSL showed similar correlations between mean SG and HbA1c as did those with type 2 diabetes, whereas no correlations between TIR and HbA1c were noted in this study, indicating that the dose of PSL itself might influence the correlations between TIR and HbA1c, as derived from CGM data, without changing on GVs. Further analyses using other more accurate CGM devices, such as Dexcom, may further confirm our findings
HbA1c represents a person’s average glucose level over the most recent 3 months, and serves as a clinical indicator of potential diabetes-related complications. Few studies regarding the optimal HbA1c level for patients with steroid diabetes have been published. Our study highlighted the importance of achieving a target HbA1c level in such patients, since the mean SG of this cohort was higher than that in patients with type 2 diabetes with the same HbA1c level.
Since HbA1c is used as an indicator of blood glucose control over the preceding months, the correlations between the SG values and HbA1c can be influenced by various factors (such as underlying treatment) during this period [14]. CGM performed for 10–14 days may not necessarily represent true 90-day glycemic status as would an individual’s HbA1c; however, the correlations between SG values and HbA1c are reportedly preserved [15]. Our data were consistent with previous studies, especially those comparing patients with type 2 diabetes to those with steroid diabetes, especially given that the methodologies we used were the same.
Limitations that should be considered include that this study was of a cross-sectional retrospective design with a small sample size; moreover, only Japanese patients at our hospital were evaluated.
In conclusion, our CGM data suggest the optimal HbA1c level of patients with steroid diabetes should be reevaluated, since the mean SG of this cohort was higher than that of patients with type 2 diabetes who had similar HbA1c levels. Our data highlighted the importance of carefully interpreting both CGM and HbA1c data in patients with steroid diabetes. Further analyses using other CGM devices, such as Dexcom, may further validate our data.
Conflicts of Interest
None of the authors have any potential conflicts of interest associated with this research.
Funding Sources
No funding received.
Disclosure
None declared.
References
- 1 Bonaventura A, Montecucco F (2018) Steroid-induced hyperglycemia: an underdiagnosed problem or clinical inertia? A narrative review. Diabetes Res Clin Pract 139: 203–220.
- 2 Radhakutty A, Stranks JL, Mangelsdorf BL, Drake SM, Roberts GW, et al. (2017) Treatment of prednisolone-induced hyperglycaemia in hospitalized patients: insights from a randomized, controlled study. Diabetes Obes Metab 19: 571–578.
- 3 Kishimoto M, Noda M (2015) Verification of glycemic profiles using continuous glucose monitoring: cases with steroid use, liver cirrhosis, enteral nutrition, or late dumping syndrome. J Med Invest 62: 1–10.
- 4 Bode BW, Gross TM, Thornton KR, Mastrototaro JJ (1999) Continuous glucose monitoring used to adjust diabetes therapy improves glycosylated hemoglobin: a pilot study. Diabetes Res Clin Pract 46: 183–190.
- 5 Borg R, Kuenen JC, Carstensen B, Zheng H, Nathan DM, et al. (2010) Associations between features of glucose exposure and A1C: the A1C-Derived Average Glucose (ADAG) study. Diabetes 59: 1585–1590.
- 6 Nathan DM, Kuenen J, Borg R, Zheng H, Schoenfeld D, et al. (2008) Translating the A1C assay into estimated average glucose values. Diabetes Care 31: 1473–1478.
- 7 Danne T, Nimri R, Battelino T, Bergenstal RM, Close KL, et al. (2017) International consensus on use of continuous glucose monitoring. Diabetes Care 40: 1631–1640.
- 8 Vigersky RA, McMahon C (2019) The relationship of hemoglobin A1C to time-in-range in patients with diabetes. Diabetes Technol Ther 21: 81–85.
- 9 Rodbard D (2020) Glucose time in range, time above range, and time below range depend on mean or median glucose or HbA1c, glucose coefficient of variation, and shape of the glucose distribution. Diabetes Technol Ther 22: 492–500.
- 10 Tsoukas M, Rutkowski J, El-Fathi A, Yale JF, Bernier-Twardy S, et al. (2020) Accuracy of FreeStyle Libre in adults with type 1 diabetes: the effect of sensor age. Diabetes Technol Ther 22: 203–207.
- 11 Dandona P (2017) Minimizing glycemic fluctuations in patients with type 2 diabetes: approaches and importance. Diabetes Technol Ther 19: 498–506.
- 12 Habib G, Dar-Esaif Y, Bishara H, Artul S, Badarny S, et al. (2014) The impact of corticosteroid treatment on hemoglobin A1C levels among patients with type-2 diabetes with chronic obstructive pulmonary disease exacerbation. Respir Med 108: 1641–1646.
- 13 Tillmann FP, Schmitz M, Rump LC, Quack I (2018) Impact of low-dose steroids on HbA1c levels and development of pre-diabetes and NODAT in non-diabetic renal transplant recipients on long-term follow-up. Int Urol Nephrol 50: 771–777.
- 14 Rodbard D (2016) Continuous glucose monitoring: a review of successes, challenges, and opportunities. Diabetes Technol Ther 18 Suppl 2: S3–S13.
- 15 Xing D, Kollman C, Beck RW, Tamborlane WV, Laffel L, et al. (2011) Optimal sampling intervals to assess long-term glycemic control using continuous glucose monitoring. Diabetes Technol Ther 13: 351–358.
