ORIGINAL
Analysis of genome-wide DNA methylation patterns in obesity
2021 Volume 68 Issue 12 Pages 1439-1453

Details
2021 Volume 68 Issue 12 Pages 1439-1453
Obesity is a chronic and complex psychosomatic disease that is becoming increasingly prevalent worldwide. This study aimed to analyze whole methylation profiles to uncover the epigenetic mechanisms associated with obesity. DNA methylation profiles in blood samples from patients with obesity and normal controls were studied using the Illumina 850 K methylation microarray. The diagnostic value of the differentially methylated genes was determined using receiver operating characteristic (ROC) analysis. The expression of selected candidate genes was verified using reverse transcription quantitative polymerase chain reaction (RT-qPCR) and pyrosequencing. A total of 9,371 significantly differentially methylated sites (7,974 hypermethylated sites and 1,397 hypomethylated sites) were identified in 4,571 genes. A difference in the distribution of differentially methylated sites (hypermethylated and hypomethylated) in both gene structures and CpG islands was observed. A total of 114 key differentially methylated sites were identified in the CpG islands. ROC results indicated that Inhibin Subunit Beta B (INHBB), Homeobox A9 (HOXA9), Troponin T3 (TNNT3), Cyclic adenosine monophosphate (cAMP)-responsive element binding protein (CREB)-regulated transcription coactivator 1 (CRTC1) and Zinc finger and BTB domain-containing 7 B (ZBTB7B) could discriminate patients with obesity from normal controls. RT-qPCR results of CRTC1 and ZBTB7B were consistent with our methylation profile results. The pyrosequencing results showed that the methylation levels of CRTC1 CpG sites (CpG1 and CpG2-cg11660071) and INHBB CpG sites (CpG2) were significantly changed in patients with obesity compared with normal controls, which was consistent with our DNA methylation profile results. Our study provides new insights into the pathological mechanism of obesity.
OBESITY is a chronic and complex psychosomatic disorder that involves complex interactions between genetic and environmental factors. The increased prevalence of obesity places a huge burden on both personal and public health worldwide [1, 2]. Emerging evidence indicates that obesity is strongly associated with the incidence of type 2 diabetes mellitus, cardiovascular diseases, cancer, respiratory disorders and infertility [3]. It is estimated that the heritability of obesity is approximately 75%. However, less than 30% of obesity cases involve genetic variation [4]. Increasing evidence suggests that environmental factors induce epigenetic changes that may also influence the risk of obesity [5].
DNA methylation is the most common epigenetic mechanism that causes changes in gene expression without altering the DNA sequence [6]. DNA methylation has attracted attention because of its tissue specificity and responsiveness to environmental changes [7]. Altered DNA methylation patterns have been found in tissues and blood of patients with obesity [8, 9]. In blood and adipose tissue, elevated methylation of the hypoxia-inducible factor 3 alpha (HIF3α) gene is associated with an increase in body mass index (BMI) [10]. Additionally, the variably methylated region of the pro-opiomelanocortin gene is involved in the regulation of body weight [11]. Moreover, male obesity is associated with modification of DNA methylation in sperm, which may affect the epigenome of the next generation [12]. However, genome-wide obesity-related DNA methylation profiles remain unclear.
Understanding DNA methylation alteration triggered by behavioral and environmental factors that contribute to obesity would help in the identification of potential molecular targets for the diagnosis and novel intervention of this disease. To uncover potential epigenetic mechanisms associated with obesity, an epigenetic analysis of DNA methylation was conducted in the blood of patients with obesity and normal controls. This study provides new insights into the role of epigenetics in the pathogenesis of obesity.
In this study, eight participants were recruited from patients with obesity (n = 4; BMI >30 kg/m2) and normal controls (n = 4; BMI <25 kg/m2) for DNA methylation analysis. Informed and written consent was obtained from all study participants. The study protocols and procedures were performed in accordance with the Declaration of Helsinki and approved by the ethics committee of our hospital. The clinical characteristics of the subjects recruited in this study are displayed in Table 1.
| Patients with obesity | Normal controls | p value | |
|---|---|---|---|
| n | 4 | 4 | |
| Sex = Male (%) | 2 (50.0) | 1 (25.0) | 1 |
| Age (mean (SD) | 36.25 (6.18) | 32.25 (10.97) | 0.549 |
| Height (mean (SD) | 1.67 (0.12) | 1.67 (0.05) | 0.97 |
| Weight (mean (SD) | 89.75 (13.23) | 57.75 (8.54) | 0.007 |
| BMI (mean (SD) | 32.21 (3.12) | 20.79 (2.55) | 0.001 |
| SBP (mean (SD) | 139.50 (13.82) | 117.00 (8.29) | 0.031 |
| DBP (mean (SD) | 82.50 (5.00) | 69.75 (6.08) | 0.018 |
| FBG (mean (SD) | 5.24 (0.60) | 5.65 (0.33) | 0.278 |
| TC (mean (SD) | 4.61 (0.84) | 4.18 (0.48) | 0.413 |
| TG (mean (SD) | 1.57 (0.61) | 1.00 (0.54) | 0.205 |
| HDL (mean (SD) | 1.02 (0.11) | 1.26 (0.30) | 0.193 |
| LDL (mean (SD) | 3.23 (0.74) | 2.51 (0.32) | 0.12 |
Abbreviations: BMI, body mass index; HDL-C, high-density lipoprotein cholesterol; LDL-C, low-density lipoprotein cholesterol; TC, Total cholesterol; T.G, Triglyceride; FBG, fasting blood-glucose; DBP, diastolic blood pressure; SBP, systolic blood pressure.
DNA was extracted from blood samples using the DNeasy kit (Qiagen, CA, USA) according to the manufacturer’s guidelines. The concentration of the extracted DNA was detected using a fluorometer (Life Technologies, Carlsbad, CA, USA). Bisulfite conversion and purification of DNA (200–500 ng) was performed with the EZ DNA methylation kit (Zymo Research, Irvine, CA, USA) and the DNA Clean-Up kit (Zymo Research), respectively.
DNA methylation analysis and data processingDNA methylation analysis was performed using an Infinium Methylation EPIC Bead Chips Kit (Illumina, Inc., San Diego, CA, USA), which contains over 850,000 CpG sites covering regulatory genomic regions, including enhancers, transcription factor binding sites and open chromatin regions. The Chip Analysis Methylation Pipeline (CHAMP) package in the R was applied to analyze the raw data and calculate the original beta value. To correct for bias, standardization was performed using the beta-mixture quantile normalization method in the CHAMP package. To search differentially methylated sites in the same locations of multiple sample genomes, a probe was mapped to the hg19 reference genome. Next, the two groups of samples were standardized. Differentially methylated sites were identified using the linear regression method. A p < 0.05 was used to define differentially methylated sites. Scatter and volcano plots of the differentially methylated sites were established using ggplot2 package in R. The pheatmap package was used for cluster analysis of the differentially methylated sites. Finally, a Manhattan plot was built to examine the distribution of differentially methylated sites in chromosomes using the qqman package. Methylation in different regions of the genome has different regulatory effects on gene expression. To reveal these genomic characteristics, the distributions of methylation sites in different regions of the genome were analyzed.
Functional annotationConsensusPathDB (CPDB; http://cpdb.molgen.mpg.de/CPDB) was used to perform Gene Ontology (GO) and Kyoto Encyclopedia of Genes and the Genomes (KEGG) signaling pathway enrichment analysis. Terms with p < 0.05 were considered significant.
Analysis of methylation at CpG islandsA threshold of p < 0.05 and the absolute value of deltaBeta >0.1 was used to identify differentially methylated sites at the CpG islands, of which deltaBeta >0 and deltaBeta <0 showed hypermethylation sites and hypomethylation sites, respectively.
Receiver operating characteristic (ROC) analysisTo evaluate the diagnostic value of differentially methylated genes, including Inhibin Subunit Beta B (INHBB), Homeobox A9 (HOXA9), Troponin T3 (TNNT3), Cyclic adenosine monophosphate (cAMP)-responsive element binding protein (CREB)-regulated transcription coactivator 1 (CRTC1) and Zinc finger and BTB domain-containing 7 B (ZBTB7B), the GSE109597 dataset was used to perform ROC analysis. GSE109597 dataset was downloaded from the Gene Expression Omnibus (GEO) dataset website (https://www.ncbi.nlm.nih.gov/geo/), which included blood samples from normal controls (n = 40) and patients with obesity (n = 44). Expression levels of the genes above and the grouping information of the samples in the GSE109597 dataset were used as input data for ROC analysis. The area under the ROC curve (AUC) was used to evaluate the diagnostic values of the genes above. The corresponding cut-off thresholds of the ROC curve were determined by Youden’s index (sensitivity + specificity – 1). Finally, sensitivity and specificity of differentially methylated genes was calculated in the diagnosis of patients with obesity. These plots were drawn using the pROC package in R.
Reverse transcription quantitative polymerase chain reaction (RT-qPCR)Blood samples collected from patients with obesity (n = 5; BMI >30 kg/m2) and normal controls (n = 5; BMI <25 kg/m2) were used to perform RT-qPCR analysis. Total RNA was isolated using the TRIzol reagent (Invitrogen, Carlsbad, CA, USA). Complementary DNA reverse transcription and RT-qPCR were performed using the Fast Quant RT Kit (Invitrogen) and Super Real PreMix Plus SYBR Green (Invitrogen), respectively. Human GAPDH was used as an endogenous control for gene expression. Data was analyzed by the 2–ΔΔCt method.
PyrosequencingBlood samples collected from patients with obesity (n = 30; BMI >30 kg/m2) and normal controls (n = 30; BMI <25 kg/m2) were used to perform pyrosequencing. Primers were designed using the PyroMark Assay Design 2.0 (Qiagen, Hilden, Germany). The bisulfite transformed DNA was amplified using RT-qPCR. Then, 20 μl PCR products were immobilized using streptavidin-coated sepharose beads (GE Healthcare Life Sciences, Piscataway, NJ, USA). A sequencing primer (1 μM) was annealed to the purified DNA strands. Next, pyrosequencing was conducted using PyroMark Gold Q96 Reagents (Qiagen) and processed using PyroMark Q CpG software (Qiagen). Quality control was performed on all samples. The percentage of DNA methylation at each CpG site was calculated. Samples that failed quality control were excluded from data analysis.
A total of 9,371 differentially methylated sites including 7,974 hypermethylated sites and 1,397 hypomethylated sites were identified in 4,571 genes, among which 3,648 genes had hypermethylated sites, 671 gene had hypomethylated sites and 252 gene had both hypermethylated and hypomethylated sites (Supplementary Table 1). Scatter plot showed the distribution of methylation levels of differentially methylated sites (Fig. 1A). Fig. 1B shows a volcano plot of all differentially methylated sites between patients with obesity and normal controls, with orange representing hypermethylation sites and green representing hypomethylation sites. Fig. 1C displays the heat map of all differentially methylated sites between patients with obesity and normal controls, indicating that there was ample difference in DNA methylation between these two groups. A Manhattan plot of the distribution of differentially methylated sites in the chromosomes is shown in Fig. 2.

Differentially methylated sites between patients with obesity and normal controls.
(A) Scatter plot of the DNA methylation levels in patients with obesity and normal controls. (B) Volcano plot of differentially methylated sites. (C) Heat map of differentially methylated sites between patients with obesity and normal controls.

Manhattan plot of differentially methylated sites in chromosomes.
Genomic distribution of CpG sites (islands, shores and shelves) and gene structures affect gene expression [13, 14]. Therefore, we explored the distribution of the differentially methylated sites in the gene structures and CpG sites. A difference in the distribution of the differentially methylated sites (hypermethylated and hypomethylated) in both gene structures and CpG islands was observed (Fig. 3). The percentages of hypermethylated sites were 47%, 7%, 3%, 2%, 3%, 8% and 30% in the body, 5' untranslated region (UTR), 3' UTR, 1st Exon, 0–200 bases upstream of the transcription start site (TSS200), 200–1500 bases upstream of the transcription start site (TSS1500) and intergenic region (IGR), respectively. However, the percentages of hypomethylated sites were 27%, 9%, 2%, 4%, 12%, 18% and 28% in the body, 5' UTR, 3' UTR, 1st Exon, TSS200, TSS1500 and IGR, respectively. The percentages of hypermethylated CpG sites in the island, shore, shelf and open sea were 9%, 17%, 10% and 65%, respectively. However, the percentages of hypomethylated CpG sites in the island, shore, shelf and open sea were 26%, 22%, 4% and 48%, respectively. Most of the significantly differentially methylated sites were distributed in the gene body and IGRs. Regions outside the CpG islands were more likely to undergo methylation.

Genomic features of differentially methylated sites between patients with obesity and normal controls.
Graph shows percentages of hypermethylated and hypomethylated sites according to their functional genomic distribution and CpG content/neighborhood context.
To understand the functional significance of the extensive changes in DNA methylation in patients with obesity, we performed GO and KEGG analysis. The top 15 enriched molecular function, cell components and biological processes are demonstrated in Fig. 4A–C. These differentially methylated genes were significantly associated with anatomical structure development, multicellular organism development, cell adhesion, plasma membrane part, neuron part, ion binding and protein binding. KEGG analysis results showed 117 pathways associated with obesity. The top five pathways were the calcium signaling pathway, pathways in cancer, inflammatory mediator regulation of transient receptor potential (TRP) channels, thyroid hormone signaling pathway and glutamatergic synapse (Fig. 5).

Top 15 significantly enriched GO terms of differentially methylated genes.
A: Biological process. B: Cellular component. C: Molecular function. The X-axis shows log p and Y-axis shows GO terms.

Top five significantly enriched KEGG pathways of differentially methylated genes.
Under the threshold of p < 0.05 and the absolute value of deltaBeta >0.1, a total of 114 significantly differentially methylated sites (92 hypermethylated sites and 22 hypomethylated sites) were identified at CpG islands (Table 2). To identify the key methylated sites, those sites in the body, 1st Exon, TSS200, 3' UTR and TSS1500 were screened. Finally, 57 significantly differentially methylated sites were identified, including 53 hypermethylated sites and 4 hypomethylated sites (Table 3).
| Probe | p value | DeltaBeta | Gene | Feature | Methylation |
|---|---|---|---|---|---|
| cg05419812 | 6.28E-06 | –0.16998 | IGR | hypo | |
| cg10938586 | 1.23E-05 | –0.11533 | IGR | hypo | |
| cg06826243 | 2.51E-05 | 0.100175 | IGR | hyper | |
| cg01850179 | 3.89E-05 | –0.19017 | S1PR2 | 5'UTR | hypo |
| cg06189133 | 8.25E-05 | 0.113208 | INSL3 | Body | hyper |
| cg13504318 | 0.000108 | 0.147954 | INSL3 | Body | hyper |
| cg27243166 | 0.000165 | 0.101915 | NRXN2 | Body | hyper |
| cg10399005 | 0.000188 | 0.135204 | IGR | hyper | |
| cg23268197 | 0.000235 | 0.139771 | INSL3 | 1stExon | hyper |
| cg09284655 | 0.00024 | 0.16089 | IGR | hyper | |
| cg02487331 | 0.000253 | 0.302839 | IGR | hyper | |
| cg05390473 | 0.000287 | –0.13192 | IGR | hypo | |
| cg06460587 | 0.000315 | –0.16906 | IGR | hypo | |
| cg27327312 | 0.000432 | 0.113451 | IGR | hyper | |
| cg02707176 | 0.000439 | 0.173765 | PCDHGA4 | Body | hyper |
| cg04364728 | 0.00053 | –0.10503 | IGR | hypo | |
| cg14793137 | 0.000586 | 0.130184 | TPO | Body | hyper |
| cg01795955 | 0.000654 | 0.172753 | IGR | hyper | |
| cg16786756 | 0.000696 | 0.112396 | IGR | hyper | |
| cg07280807 | 0.000711 | 0.138417 | IGR | hyper | |
| cg20169823 | 0.000715 | –0.14482 | IGR | hypo | |
| cg21004358 | 0.000788 | 0.123181 | IGR | hyper | |
| cg18264486 | 0.000853 | –0.15689 | IGR | hypo | |
| cg24358785 | 0.000868 | 0.162561 | SLC22A3 | Body | hyper |
| cg20478934 | 0.000874 | 0.119587 | COL5A3 | Body | hyper |
| cg08677579 | 0.000977 | 0.12511 | IGR | hyper | |
| cg26214645 | 0.001153 | 0.119245 | SECTM1 | TSS200 | hyper |
| cg02608963 | 0.001274 | 0.136127 | IGR | hyper | |
| cg05146089 | 0.001301 | 0.17109 | IGR | hyper | |
| cg06415891 | 0.001315 | 0.149703 | IGR | hyper | |
| cg13972793 | 0.001326 | 0.105608 | PCDHGA4 | Body | hyper |
| cg05867884 | 0.001449 | 0.138615 | SLC6A18 | 3'UTR | hyper |
| cg11202727 | 0.001455 | 0.10228 | HOXB9 | 3'UTR | hyper |
| cg08470892 | 0.001553 | 0.111284 | TPSD1 | Body | hyper |
| cg24634568 | 0.001589 | 0.112799 | IGR | hyper | |
| cg05036635 | 0.001666 | 0.146371 | IGR | hyper | |
| cg11556846 | 0.001725 | 0.213093 | IGR | hyper | |
| cg01565314 | 0.001926 | 0.105849 | EXOC3L2 | TSS200 | hyper |
| cg07780517 | 0.001933 | 0.121575 | MTUS2 | 3'UTR | hyper |
| cg01003448 | 0.002003 | 0.162042 | FBXL16 | Body | hyper |
| cg20165694 | 0.002067 | 0.111366 | MTUS2 | Body | hyper |
| cg07482202 | 0.002089 | 0.132963 | FBXL16 | Body | hyper |
| cg02604095 | 0.002281 | 0.152507 | IGR | hyper | |
| cg02389040 | 0.002356 | –0.19011 | IGR | hypo | |
| cg22240717 | 0.00263 | 0.100644 | IGR | hyper | |
| cg12288076 | 0.002664 | 0.111292 | C20orf123 | Body | hyper |
| cg14113035 | 0.002666 | 0.128468 | IGR | hyper | |
| cg18625538 | 0.002695 | 0.172025 | IGR | hyper | |
| cg22832557 | 0.002853 | –0.16742 | ZNF578 | 5'UTR | hypo |
| cg02841571 | 0.002882 | 0.168624 | WDR27 | Body | hyper |
| cg06503573 | 0.002929 | 0.132712 | TNNT3 | Body | hyper |
| cg09894276 | 0.003101 | 0.189464 | WDR27 | Body | hyper |
| cg09174690 | 0.003374 | 0.104994 | INHBB | Body | hyper |
| cg07515989 | 0.003453 | 0.106275 | IGR | hyper | |
| cg03166265 | 0.003542 | 0.125296 | SORCS2 | Body | hyper |
| cg18414754 | 0.003557 | 0.189587 | C3orf72 | Body | hyper |
| cg17870959 | 0.003657 | 0.169753 | IGR | hyper | |
| cg18478731 | 0.003667 | 0.137744 | IGR | hyper | |
| cg03814644 | 0.003686 | 0.113432 | C6orf176 | Body | hyper |
| cg05746918 | 0.003696 | 0.104104 | PODXL2 | Body | hyper |
| cg16256492 | 0.00374 | 0.114875 | ZBTB7B | 3'UTR | hyper |
| cg26099834 | 0.003919 | –0.13381 | IGR | hypo | |
| cg04946709 | 0.003983 | 0.163039 | LOC644649 | Body | hyper |
| cg09075844 | 0.004323 | 0.148193 | SLC6A18 | Body | hyper |
| cg06953130 | 0.004606 | 0.15156 | C10orf47 | 3'UTR | hyper |
| cg01200150 | 0.004663 | 0.182504 | IGR | hyper | |
| cg16524716 | 0.004891 | 0.104912 | BIRC8 | 5'UTR | hyper |
| cg11942181 | 0.004892 | 0.155551 | IGR | hyper | |
| cg01381846 | 0.005003 | 0.16054 | HOXA9 | 1stExon | hyper |
| cg18091046 | 0.005007 | 0.124244 | MTUS2 | 3'UTR | hyper |
| cg12135344 | 0.00503 | 0.117531 | CHD5 | Body | hyper |
| cg01818795 | 0.00509 | 0.115795 | NMBR | 1stExon | hyper |
| cg04298253 | 0.00518 | –0.16055 | PRDM7 | TSS1500 | hypo |
| cg22318514 | 0.005367 | –0.10738 | IGR | hypo | |
| cg15568074 | 0.005441 | 0.556717 | HLA-DRB1 | Body | hyper |
| cg27046936 | 0.005457 | 0.14237 | PTGFR | 5'UTR | hyper |
| cg16379671 | 0.005538 | 0.103586 | IGR | hyper | |
| cg09274344 | 0.005555 | 0.154241 | IGR | hyper | |
| cg07553761 | 0.005592 | 0.10336 | TRIM59 | TSS1500 | hyper |
| cg00389386 | 0.005748 | 0.153814 | CHD5 | Body | hyper |
| cg20435535 | 0.005764 | –0.17444 | IGR | hypo | |
| cg16440561 | 0.005828 | –0.12281 | SPEG | Body | hypo |
| cg00167275 | 0.006302 | –0.23041 | FAM35A | TSS1500 | hypo |
| cg15467834 | 0.006316 | 0.116867 | IGR | hyper | |
| cg06407434 | 0.006361 | 0.136266 | LARGE | Body | hyper |
| cg10154826 | 0.00638 | 0.197045 | FAM8A1 | 1stExon | hyper |
| cg01619416 | 0.006417 | 0.107794 | IGR | hyper | |
| cg23433008 | 0.006427 | 0.105138 | RASGEF1C | 5'UTR | hyper |
| cg01067216 | 0.006428 | 0.137511 | IGR | hyper | |
| cg04850211 | 0.006558 | 0.117387 | OBSCN | Body | hyper |
| cg01335180 | 0.006957 | 0.136917 | HSPA7 | Body | hyper |
| cg20237074 | 0.00715 | 0.100551 | IGR | hyper | |
| cg16766914 | 0.007162 | 0.109925 | CUEDC1 | Body | hyper |
| cg06259025 | 0.007166 | –0.11845 | THSD1P | TSS1500 | hypo |
| cg11424776 | 0.007214 | 0.10199 | IGR | hyper | |
| cg07223180 | 0.007222 | 0.11427 | CRYL1 | Body | hyper |
| cg11174855 | 0.007224 | 0.103701 | NKX6-2 | 3'UTR | hyper |
| cg20816361 | 0.007353 | 0.12067 | IGR | hyper | |
| cg05857999 | 0.007534 | –0.1561 | IGR | hypo | |
| cg10249734 | 0.00822 | 0.151539 | SECTM1 | TSS200 | hyper |
| cg06433816 | 0.008233 | 0.207454 | EXD3 | 5'UTR | hyper |
| cg01126407 | 0.008279 | 0.104961 | KIAA0895L | TSS1500 | hyper |
| cg26316885 | 0.008503 | 0.15319 | ICAM5 | 3'UTR | hyper |
| cg15231205 | 0.008636 | 0.124488 | IGR | hyper | |
| cg13546935 | 0.00865 | –0.10139 | SPDYA | 5'UTR | hypo |
| cg00376654 | 0.009008 | 0.105615 | UMOD | Body | hyper |
| cg17759252 | 0.009036 | 0.127134 | CRTC1 | Body | hyper |
| cg18576957 | 0.009196 | –0.11245 | IGR | hypo | |
| cg13740929 | 0.009596 | –0.14319 | IGR | hypo | |
| cg00812799 | 0.0096 | 0.108592 | IL17D | Body | hyper |
| cg04497520 | 0.009671 | 0.131758 | PHF13 | TSS1500 | hyper |
| cg09139047 | 0.009723 | 0.354406 | HLA-DRB1 | Body | hyper |
| cg14018233 | 0.00993 | 0.131805 | IGR | hyper | |
| cg02304584 | 0.009998 | –0.18411 | IGR | hypo |
| Probe | p value | DeltaBeta | Gene | Feature | Methylation |
|---|---|---|---|---|---|
| cg06189133 | 8.25E-05 | 0.113208 | INSL3 | Body | hyper |
| cg13504318 | 0.000108 | 0.147954 | INSL3 | Body | hyper |
| cg27243166 | 0.000165 | 0.101915 | NRXN2 | Body | hyper |
| cg23268197 | 0.000235 | 0.139771 | INSL3 | 1stExon | hyper |
| cg02707176 | 0.000439 | 0.173765 | PCDHGA4 | Body | hyper |
| cg14793137 | 0.000586 | 0.130184 | TPO | Body | hyper |
| cg24358785 | 0.000868 | 0.162561 | SLC22A3 | Body | hyper |
| cg20478934 | 0.000874 | 0.119587 | COL5A3 | Body | hyper |
| cg26214645 | 0.001153 | 0.119245 | SECTM1 | TSS200 | hyper |
| cg13972793 | 0.001326 | 0.105608 | PCDHGA4 | Body | hyper |
| cg05867884 | 0.001449 | 0.138615 | SLC6A18 | 3'UTR | hyper |
| cg11202727 | 0.001455 | 0.10228 | HOXB9 | 3'UTR | hyper |
| cg08470892 | 0.001553 | 0.111284 | TPSD1 | Body | hyper |
| cg01565314 | 0.001926 | 0.105849 | EXOC3L2 | TSS200 | hyper |
| cg07780517 | 0.001933 | 0.121575 | MTUS2 | 3'UTR | hyper |
| cg01003448 | 0.002003 | 0.162042 | FBXL16 | Body | hyper |
| cg20165694 | 0.002067 | 0.111366 | MTUS2 | Body | hyper |
| cg07482202 | 0.002089 | 0.132963 | FBXL16 | Body | hyper |
| cg12288076 | 0.002664 | 0.111292 | C20orf123 | Body | hyper |
| cg02841571 | 0.002882 | 0.168624 | WDR27 | Body | hyper |
| cg06503573 | 0.002929 | 0.132712 | TNNT3 | Body | hyper |
| cg09894276 | 0.003101 | 0.189464 | WDR27 | Body | hyper |
| cg09174690 | 0.003374 | 0.104994 | INHBB | Body | hyper |
| cg03166265 | 0.003542 | 0.125296 | SORCS2 | Body | hyper |
| cg18414754 | 0.003557 | 0.189587 | C3orf72 | Body | hyper |
| cg03814644 | 0.003686 | 0.113432 | C6orf176 | Body | hyper |
| cg05746918 | 0.003696 | 0.104104 | PODXL2 | Body | hyper |
| cg16256492 | 0.00374 | 0.114875 | ZBTB7B | 3'UTR | hyper |
| cg04946709 | 0.003983 | 0.163039 | LOC644649 | Body | hyper |
| cg09075844 | 0.004323 | 0.148193 | SLC6A18 | Body | hyper |
| cg06953130 | 0.004606 | 0.15156 | C10orf47 | 3'UTR | hyper |
| cg01381846 | 0.005003 | 0.16054 | HOXA9 | 1stExon | hyper |
| cg18091046 | 0.005007 | 0.124244 | MTUS2 | 3'UTR | hyper |
| cg12135344 | 0.00503 | 0.117531 | CHD5 | Body | hyper |
| cg01818795 | 0.00509 | 0.115795 | NMBR | 1stExon | hyper |
| cg04298253 | 0.00518 | –0.16055 | PRDM7 | TSS1500 | hypo |
| cg15568074 | 0.005441 | 0.556717 | HLA-DRB1 | Body | hyper |
| cg07553761 | 0.005592 | 0.10336 | TRIM59 | TSS1500 | hyper |
| cg00389386 | 0.005748 | 0.153814 | CHD5 | Body | hyper |
| cg16440561 | 0.005828 | –0.12281 | SPEG | Body | hypo |
| cg00167275 | 0.006302 | –0.23041 | FAM35A | TSS1500 | hypo |
| cg06407434 | 0.006361 | 0.136266 | LARGE | Body | hyper |
| cg10154826 | 0.00638 | 0.197045 | FAM8A1 | 1stExon | hyper |
| cg04850211 | 0.006558 | 0.117387 | OBSCN | Body | hyper |
| cg01335180 | 0.006957 | 0.136917 | HSPA7 | Body | hyper |
| cg16766914 | 0.007162 | 0.109925 | CUEDC1 | Body | hyper |
| cg06259025 | 0.007166 | –0.11845 | THSD1P | TSS1500 | hypo |
| cg07223180 | 0.007222 | 0.11427 | CRYL1 | Body | hyper |
| cg11174855 | 0.007224 | 0.103701 | NKX6-2 | 3'UTR | hyper |
| cg10249734 | 0.00822 | 0.151539 | SECTM1 | TSS200 | hyper |
| cg01126407 | 0.008279 | 0.104961 | KIAA0895L | TSS1500 | hyper |
| cg26316885 | 0.008503 | 0.15319 | ICAM5 | 3'UTR | hyper |
| cg00376654 | 0.009008 | 0.105615 | UMOD | Body | hyper |
| cg17759252 | 0.009036 | 0.127134 | CRTC1 | Body | hyper |
| cg00812799 | 0.0096 | 0.108592 | IL17D | Body | hyper |
| cg04497520 | 0.009671 | 0.131758 | PHF13 | TSS1500 | hyper |
| cg09139047 | 0.009723 | 0.354406 | HLA-DRB1 | Body | hyper |
Next, the diagnostic value of CRTC1, HOXA9, TNNT3, INHBB and ZBTB7B was assessed using ROC analysis. As shown in Fig. 6, the AUC value of CRTC1, HOXA9, TNNT3, INHBB and ZBTB7B was 0.719, 0.661, 0.634, 0.566 and 0.715, respectively. The specificity of CRTC1, HOXA9, TNNT3, INHBB and ZBTB7B was 75.0%, 65.0%, 55.0%, 37.5% and 77.5%, respectively. The sensitivity of CRTC1, HOXA9, TNNT3, INHBB and ZBTB7B was 68.2%, 63.6%, 70.5%, 88.6% and 56.8%, respectively. These results suggested that CRTC1, HOXA9, TNNT3, INHBB and ZBTB7B had the capability to diagnose obesity with good specificity and sensitivity.
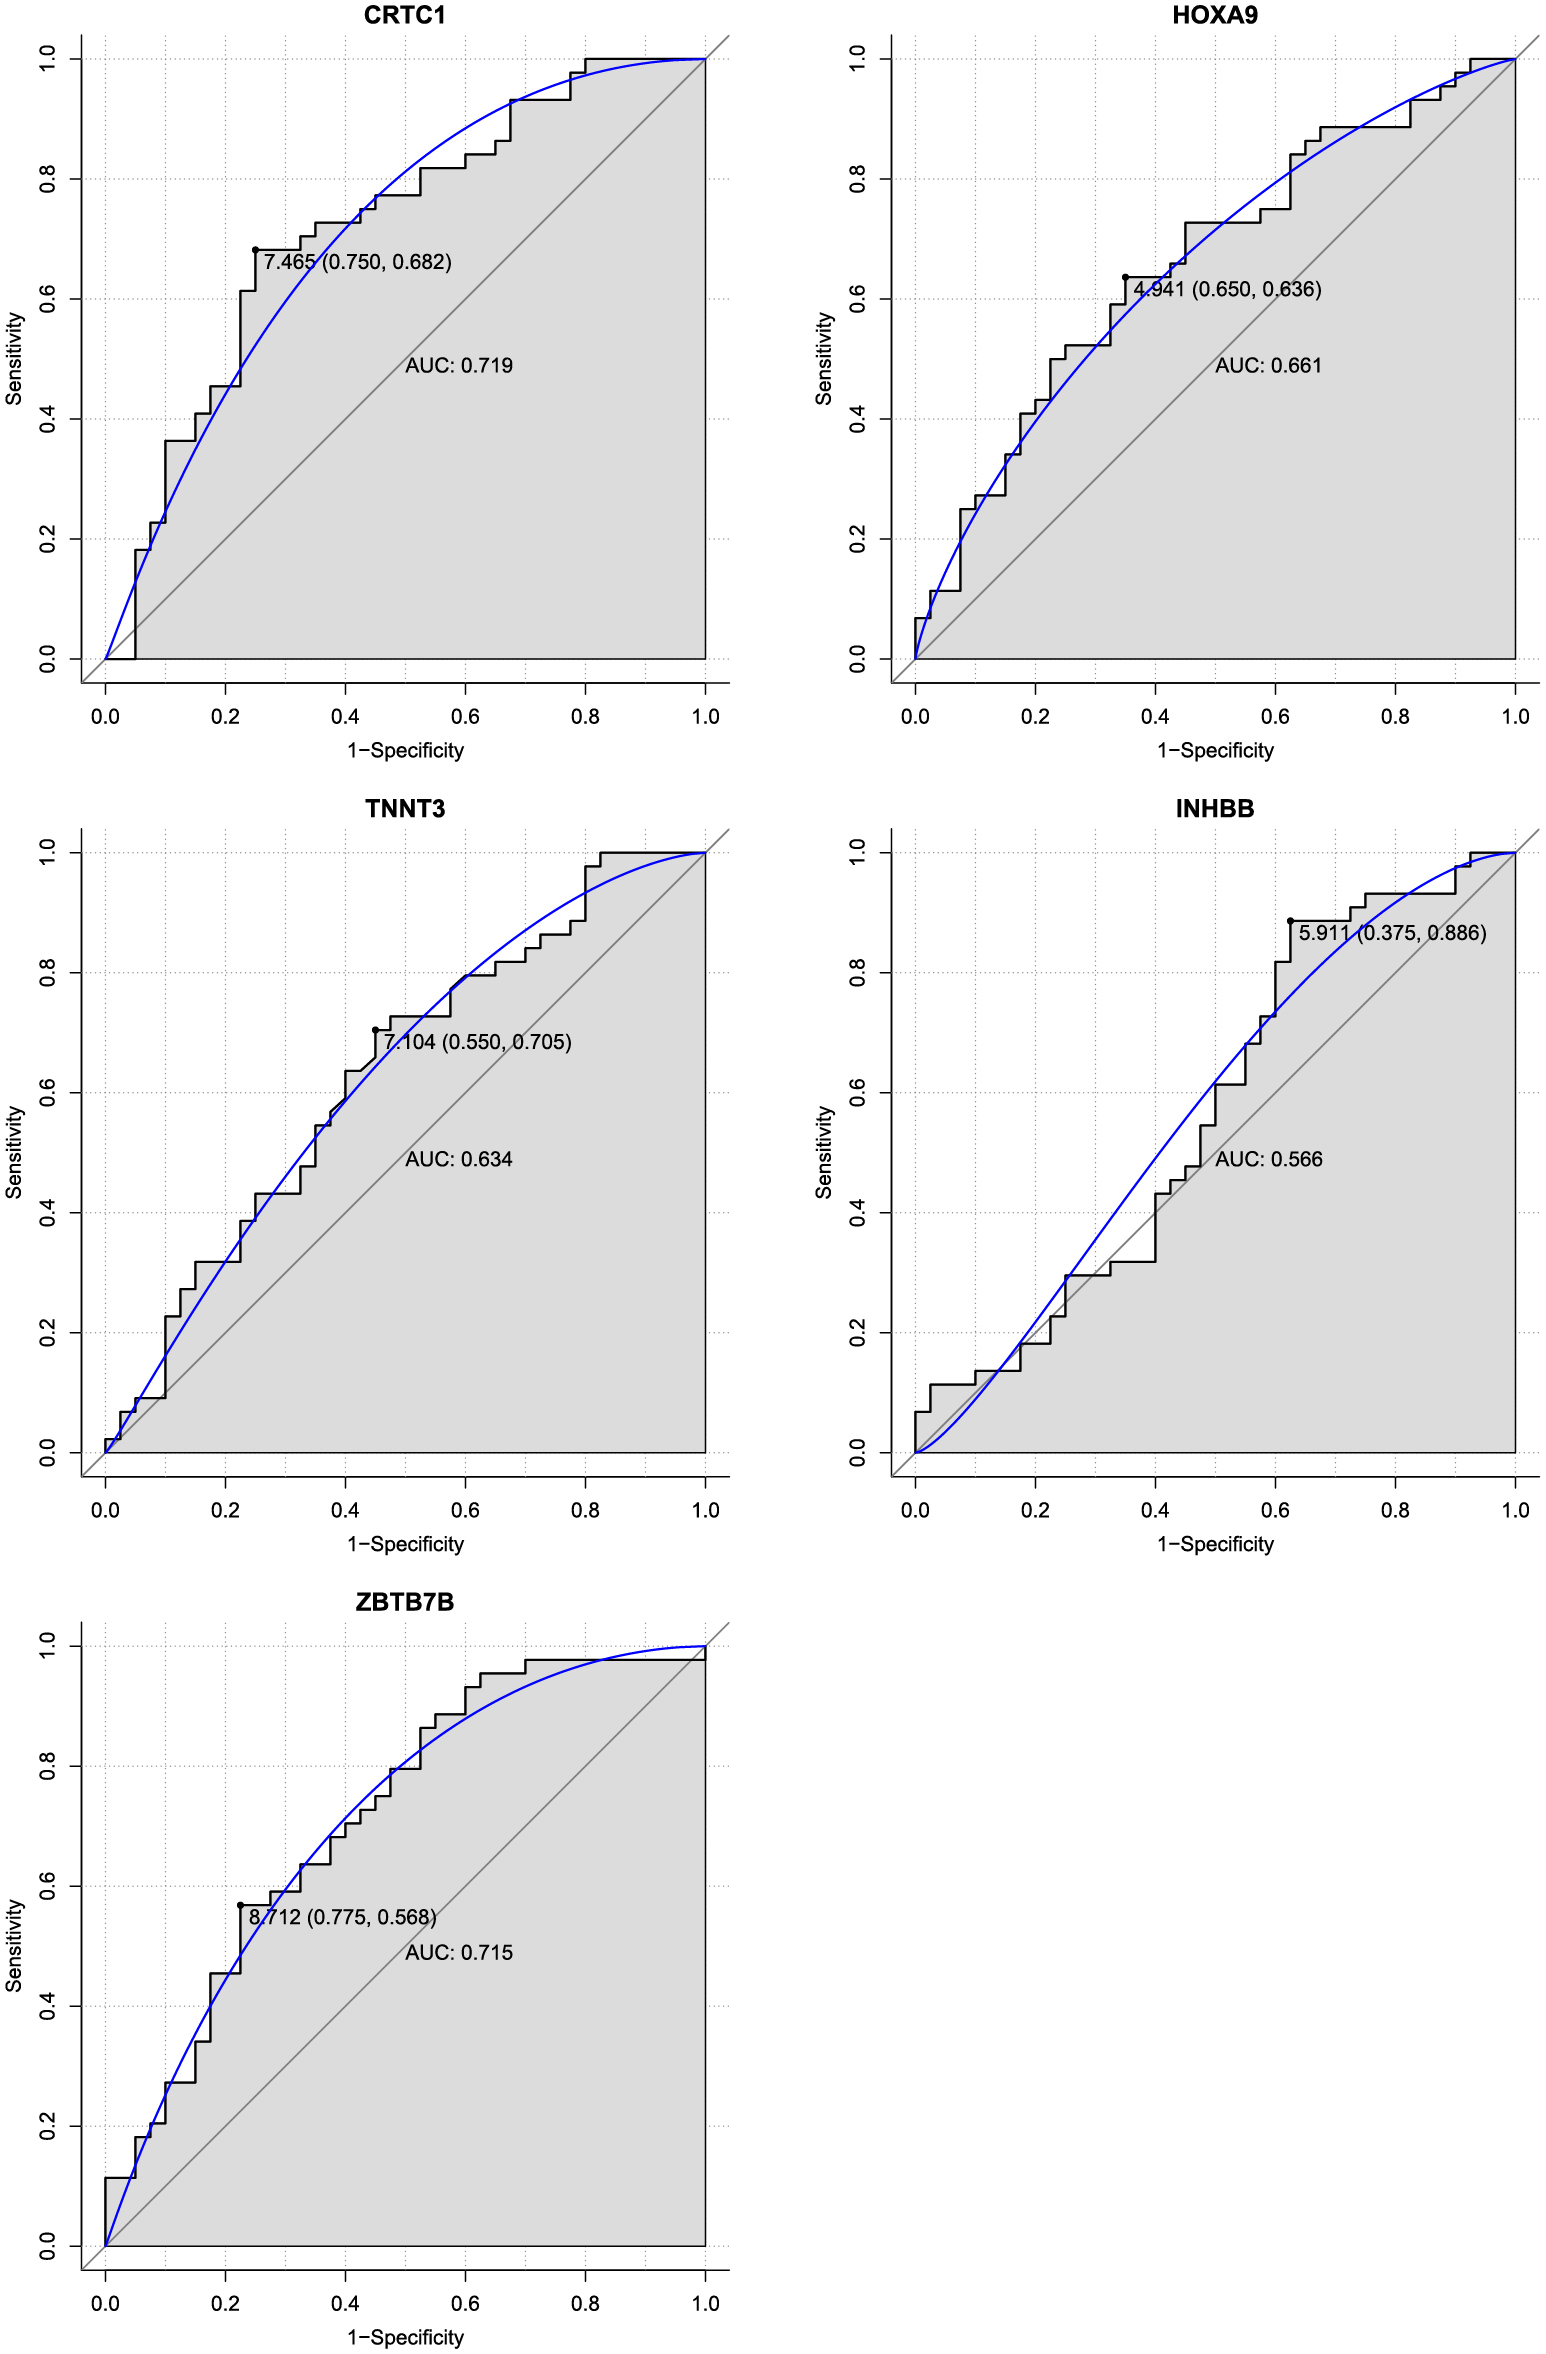
ROC analysis.
The AUC was analyzed to evaluate the performance of each gene. The X-axis indicates 1-specificity and Y-axis indicates sensitivity.
To confirm the DNA methylation results, the expression of three genes (HOXA9, ZBTB7B and CRTC1) was measured by RT-qPCR in blood samples collected from patients with obesity (n = 5) and normal controls (n = 5). As shown in Fig. 7, HOXA9 was upregulated, whereas ZBTB7B and CRTC1 were downregulated in patients with obesity compared with normal controls. RT-qPCR results of ZBTB7B and CRTC1 were consistent with our DNA methylation profile results.

Expression validation of genes by RT-qPCR.
The expression of genes was detected by RT-qPCR analysis. * p < 0.05.
To further confirm our results, the methylation levels of three genes (ZBTB7B, CRTC1 and INHBB) were measured in blood samples from patients with obesity (n = 30) and normal controls (n = 30) by pyrosequencing. As demonstrated in Fig. 8, there was a significant difference in methylation levels of two CRTC1 CpG sites (CpG1 and CpG2-cg11660071) and one INHBB CpG site (CpG2) between the two groups. However, there was no significant difference in methylation of the ZBTB7B CpG site (CpG1-cg01782486) and INHBB CpG site (CpG1-cg09174690). Among these, the methylation levels of two CRTC1 CpG sites (CpG1 and CpG2-cg11660071) were significantly downregulated in patients with obesity compared with normal controls, which was consistent with our DNA methylation profiles and RT-qPCR results. The methylation level at INHBB CpG sites (CpG2) was significantly upregulated between patients with obesity and normal controls, which was consistent with our DNA methylation profile results.
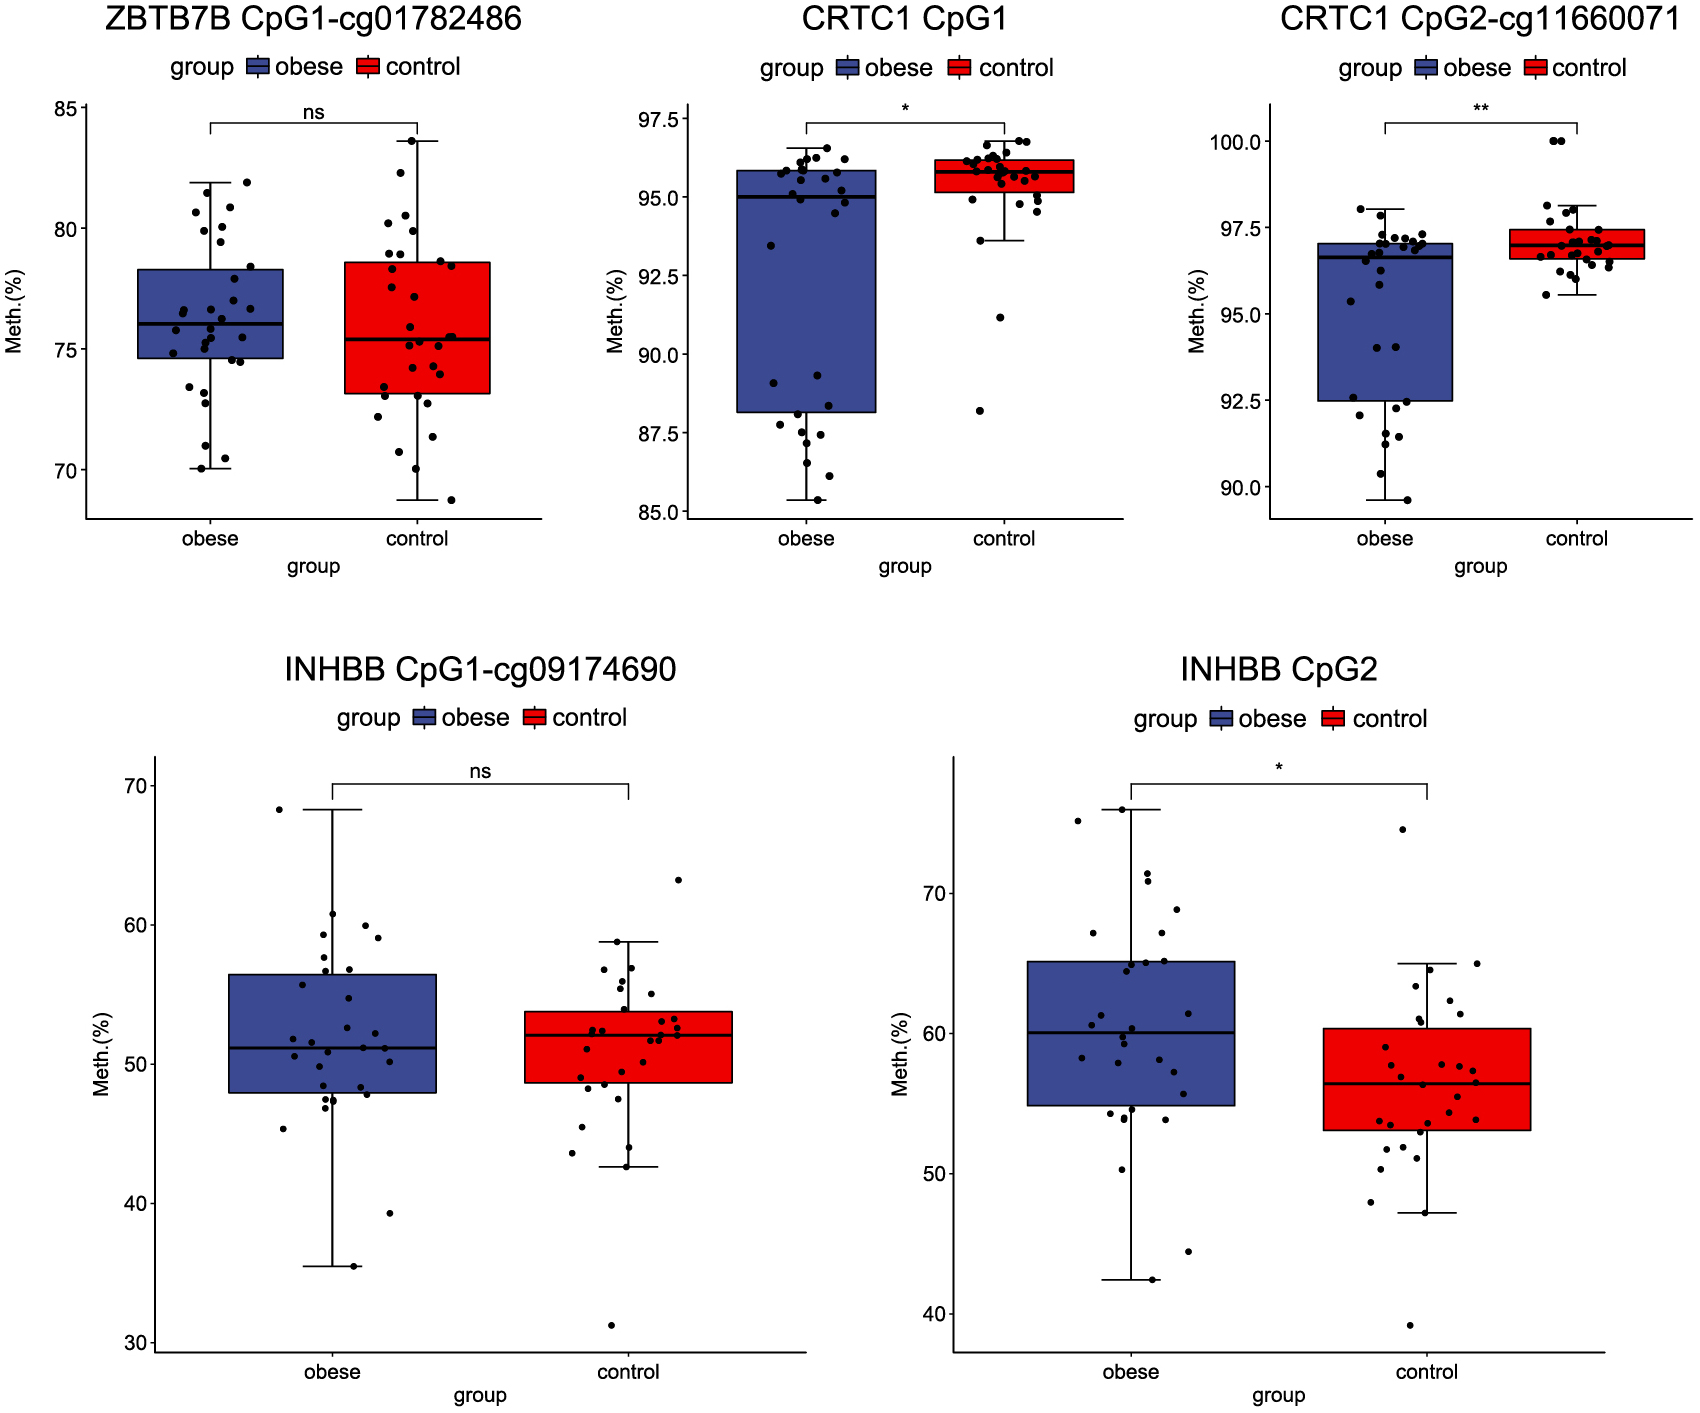
Methylation validation of genes by pyrosequencing.
The X-axis represents patients with obesity and normal controls and the Y-axis represents the percentages of methylation. * p < 0.05.
Obesity is a pathological state that is highly correlated with lifestyle. Epigenetics has been proposed as a molecular mechanism that can affect the expression of genes by environmental influences [15]. In the present study, DNA methylation profiles of patients with obesity were performed to uncover the epigenetic mechanisms of this disease. A total of 9,371 significantly differentially methylated sites were identified, including 7,974 hypermethylated sites and 1,397 hypomethylated sites, which correspond to 4,571 genes (3,648 hypermethylated, 671 hypomethylated and 252 both hypermethylated and hypomethylated). Genomic features of the differentially methylated sites were analyzed followed by functional enrichment analysis. Through ROC analysis, five differentially methylated genes with diagnostic value were identified, including INHBB, HOXA9, TNNT3, CRTC1 and ZBTB7B. To our knowledge, this is the first report of INHBB, HOXA9, TNNT3 and ZBTB7B as hypermethylated genes in obesity.
DNA methylation, the most studied epigenetic mechanism, is thought to be involved in the progression of obesity [17]. Recently, several studies have examined whether blood methylation levels are associated with the progression of obesity. Demetriou et al. have reported a significant association between BMI/obesity and DNA methylation in peripheral blood of children or adolescents [16]. A large multicenter epigenomic association study by Dick et al. has found that increased methylation of the HIF3α gene in blood cells and adipose tissue is significantly associated with increased BMI [10]. However, unlike the results from the study by Dick et al., in the present study, we did not find a difference in methylation level of HIF3α between patients with obesity and normal controls. This discrepancy can be explained in part by genetic differences in ethnic groups and a smaller sample size used in our study.
INHBB is a protein-coding gene belonging to the growth factor-beta (TGF-β) superfamily. INHBB is overexpressed and plays key a role in adipose tissue [17, 18]. INHBB is a key gene that regulates lipid secretion in mature adipocytes [19]. HOXA9, located on chromosome 7p15.2, is a member of the homeobox family. Abnormal expression of HOXA9 is associated with the occurrence of a variety of cancers [20-22]. Several recent studies have shown that hypermethylation of the HOXA9 promoter causes transcriptional inactivation in many malignant tumors [23-25]. In our study, INHBB and HOXA9 were hypermethylated in patients with obesity. The AUC value of INHBB and HOXA9 was 0.566 and 0.661, respectively, and the specificity and sensitivity of INHBB and HOXA9 was 37.5% and 88.6% and 65.0% and 63.6%, respectively. These results suggest that IINHBB and HOXA9 may have a diagnostic value in patients with obesity. Methylation levels at the INHBB CpG sites (CpG2) were significantly upregulated between patients with obesity and normal controls, which was consistent with our DNA methylation profile results. The above results show that INHBB and HOXA9 may play important roles in the development of obesity.
TNNT3 encodes skeletal troponin-Tfast and is associated with autosomal dominant distal arthrogryposis [26]. The expression level of TNNT3 is negatively correlated with total body fat [27]. In our study, TNNT3 was hypermethylated in patients with obesity. The ROC results showed that the AUC value of TNNT3 was 0.634, with a specificity and sensitivity of 55.0% and 70.5%, respectively, suggesting that TNNT3 could be used to diagnose obesity. These results demonstrate that hypermethylation of TNNT3 may be associated with the development of obesity. The CRCT1 is a member of the CREB transcriptional coactivators family and plays a key role in a wide range of biological processes including energy metabolism [28, 29]. CRTC1 regulates gene transcription by mediating its binding to cAMP response elements on target gene promoters [30]. A previous study shows that CRCT1 protects mice from the development of non-alcoholic fatty liver disease by inhibiting the expression of genes related to lipid accumulation in the liver [28]. Another study has reported that there is a regulatory feedback loop between CRTC1 and miR-212/miR-132, which affects glucose-dependent insulin secretion in beta cells [31]. Studies have also reported that genetic variants at the CRTC1 loci are associated with the percentage of body fat [32, 33]. Genotypic distribution and/or DNA methylation level at rs7256986 correlate with CRTC1 gene expression, which is related to BMI, fat distribution and metabolic traits [34]. Taken together, these findings implicate CRTC1 as a crucial candidate gene for metabolic disorders. Therefore, studying epigenetic regulation of CRTC1 in obesity and fat distribution is of great significance. In this study, CRTC1 was hypermethylated in patients with obesity compared to normal controls. The ROC results showed that the AUC value of CRTC1 was 0.719, with a specificity and sensitivity of 75.0% and 68.2%, respectively, suggesting that CRTC1 could be used to diagnose obesity. In addition, the methylation level of two CRTC1 CpG sites (CpG1 and CpG2-cg11660071) was significantly decreased in patients with obesity compared with normal controls, which was consistent with our DNA methylation profiles and RT-qPCR results. Our result indicates that hypermethylation of CRTC1 may be associated with the development of obesity.
ZBTB7B encodes a zinc finger-containing transcription factor and is a potent regulator in the development of brown and beige fats. Genetic ablation of ZBTB7B damages cold-induced transcriptional remodeling in brown fat, rendering mice sensitive to cold temperatures and diminishes browning of inguinal white fat [35]. In both brown and white fat of obese mice, brown fat lncRNA 1 (Blnc1) attenuates pro-inflammatory cytokine signaling and promotes fuel storage in adipocytes through its protein partner ZBTB7B [36]. We found that ZBTB7B was hypermethylated in patients with obesity compared to normal controls. The ROC results showed that the AUC value of ZBTB7B was 0.715, and the specificity and sensitivity was 77.5% and 56.8%, respectively, suggesting that ZBTB7B has diagnostic value in patients with obesity. These findings indicate that ZBTB7B may be involved in regulating the progression of obesity.
To further uncover the functional significance of the extensive changes in DNA methylation in patients with obesity, GO and KEGG analysis were performed. GO analysis revealed that these differentially methylated genes are involved in multiple biological processes, including anatomical structure development, multicellular organism development, cell adhesion, plasma membrane port, neuron port, ion binding and protein binding. It has been reported that the expression of cell adhesion molecules is related to the change in BMI [37]. An increase in cell adhesion molecules, especially in visceral adipose tissue, may directly link obesity with the increased risk of atherosclerotic cardiovascular disease [38]. Changes in cell adhesion molecules can reflect and regulate obesity-related cardiovascular risk [39]. KEGG analysis revealed that these differentially methylated genes are associated with the calcium signaling pathway. The calcium signaling pathway has been reported to be involved in the progression of a variety of diseases, including obesity. Calcium ions can inhibit the progression of obesity by promoting adipocyte differentiation and metabolism to increase energy consumption [40, 41]. Leptin, neuropeptide Y, Nxafatine-1 and other signaling molecules can regulate the feeding center and peripheral satiety system through calcium signaling pathways to reduce food intake and energy acquisition, thereby reducing obesity [42, 43]. Our results show that these differentially methylated genes may play important roles in the development of obesity by regulating key biological processes and pathways.
In summary, this study identified five key methylated genes (INHBB, HOXA9, TNNT3, CRTC1 and ZBTB7B) and five related signaling pathways (calcium signaling pathway, pathways in cancer, inflammatory mediator regulation of TRP channels, thyroid hormone signaling pathway and glutamatergic synapse) in patients with obesity compared with normal controls. The ROC results suggest that INHBB, HOXA9, TNNT3, CRTC1 and ZBTB7B may have diagnostic value in patients with obesity. RT-qPCR results of ZBTB7B and CRTC1 were consistent with our DNA methylation profile results. Pyrosequencing results of CRTC1 and INHBB were consistent with our methylation profile results. Our study highlights a novel molecular mechanism involving DNA methylation in obesity. However, several limitations need to be acknowledged in our study. First, analysis of the methylation profiles in blood does not necessarily reflect the methylation profiles in other tissues, such as adipose tissue and the liver, which are involved in the pathophysiology of obesity. Second, each cell type has a characteristic DNA methylation pattern. Obesity may change leucocyte composition in the blood. Therefore, even if the levels of DNA methylation remain unchanged, this change in blood composition will change the pattern of DNA methylation, which may contribute to the results of this study.