Abstract
Immune-related adverse events in the thyroid glands (thyroid irAEs) during treatment with immune-checkpoint inhibitors (ICIs) are most frequent endocrine irAE. Thyroid irAE can be divided into that requiring continuous therapy for thyroid dysfunction (P-THY), and that requiring only temporal treatment (T-THY). However, predictive factors for those differential outcomes are unknown, and susceptibility of human leukocyte antigen (HLA) to thyroid irAE has never been investigated. This study aimed to elucidate clinical courses and prognosis of P-THY in comparison with T-THY in the aspect of thyroid immunity and HLA. Patients with P-THY (n = 15) that required L-T4 supplemental therapy for hypothyroidism for more than 3 months, and patients with T-THY who required no therapy or therapy within 1 month were enrolled in the study. Lower-value of TSH, higher-value of FT4, and lower value of TSH/FT4 were thought to be predictive markers to estimate P-THY. In addition, anti-thyroglobulin antibody (TgAb) levels were significantly higher in patients with P-THY than those in patients with T-THY. HLA-DPA1*01:03 and HLA-DPB1*02:01 allele, and their haplotype frequencies were significantly higher in patients with P-THY than those in controls. P-THY had better survival rate than T-THY. Pre-existing thyroid autoimmunity, the extent of thyroid dysfunction, and predisposing HLA were associated with the differential course of thyroid irAEs. It was suggested that thyroid function tests, TgAb, and HLA typing tests are useful for prediction of clinical course in thyroid irAEs.
IMMUNE-CHECKPOINT INHIBITORS (ICIs) are used in cancer immunotherapy [1-3]. They promote anti-cancer immunity by inhibiting interaction of immune-checkpoint molecules [1-3]. Meanwhile, immune-related adverse events (irAEs) often occur during ICIs treatment [1-7]. Thyroid dysfunction is the most common endocrine irAE, reported to occur in 5–50% of patients. We recently reported on predictive and sensitive biomarkers for thyroid irAE [5]. We hypothesized that activation of pre-existing autoimmunity to thyroid gland and human leukocyte antigen (HLA) as a molecule for presentation of thyroid autoantigen might be involved in the pathogenesis of thyroid irAE [1]. Thyroid irAEs (thyroid dysfunctions) mostly occur due to destructive mechanisms [3]. Thyroid irAE can be divided into those with persistent thyroid irAE (P-THY), and those with temporary thyroid irAE (T-THY). However, the clinical features of P-THY and T-THY are unknown, and susceptibility of HLA to thyroid irAE has never been investigated.
Positive correlation between thyroid irAEs and anti-tumor effects has been reported [8]. For appropriate use of ICIs, it is important to predict individuals who may be susceptible to persistent or temporary thyroid irAEs.
This study aimed to elucidate clinical features and prognosis between P-THY and T-THY in the aspect of thyroid immunity and HLA. In order to investigate other autoimmunity, antinuclear antibody (ANA), and rheumatoid factor (RF) were also measured.
Methods
Patients
Patients with advanced malignant diseases (malignant melanoma, gastric cancer, renal cell carcinoma, urothelial cancer, non-small cell lung cancer, hypopharyngeal cancer, and Hodgkin lymphoma) who received ICIs treatment were recruited at Wakayama Medical University between 2017 and 2020. Treatment with ICIs included that with anti-PD-1 antibody (nivolumab or pembrolizumab), with anti-CTLA-4 antibody (ipilimumab), with anti-PD-L1 antibody (atezolizumab), or by combination therapy of ipilimumab and nivolumab. ICI agents were intravenously administrated as follows: pembrolizumab, 2 mg/kg every 3 weeks; nivolumab, 3 mg/kg every 2 weeks; atezolizumab, 1,200 mg every 3 weeks; combination therapy, 1 mg/kg nivolumab in combination with 3 mg/kg ipilimumab: every 3 weeks for the first 4 doses, followed by a second phase in which nivolumab monotherapy was administrated, 3 mg/kg, every 2 weeks.
Minimum patient follow-up period was 2 months, the longest was 31 months. Patients who had pituitary metastasis, infectious diseases or who were treated with glucocorticoid within 8 weeks, those who transferred to another hospital within 8 weeks, and those who had iodide contrast enhancement CT immediately before thyroid tests were excluded from the study.
Data and sample collection
Clinical manifestations were recorded at every hospital visit. Peripheral blood samples were collected from patients at baseline (0 w) and at 4-week intervals after first ICIs treatment, and upon occasional examination.
Thyroid function tests and laboratory examinations
Serum free triiodothyronine (FT3), free thyroxine (FT4), thyrotropin (TSH), and thyroglobulin (Tg) levels were measured by chemiluminescent immunoassay (Roche Diagnostics, Germany). Anti-thyrotropin receptor autoantibody (TRAb) was measured by enzyme-linked immunosorbent assay (Cosmic, Tokyo, Japan). Thyroglobulin autoantibodies (TgAb) and thyroid peroxidase autoantibodies (TPOAb) were measured by electrochemiluminescent immunoassay (TOSOH, Tokyo, Japan). Moreover, ANA, was measured by immunofluorescence method, and RF was measured by Latex agglutination turbidimetric Immunoassay (BML, Tokyo, Japan). These factors at baseline and onset of thyroid irAE, and their fold increase were evaluated.
Assessment and definition of irAE
For assessment of irAEs, the description and grading scales of National Cancer Institute (NCI) Common Terminology Criteria for Adverse Events version 3.0 were used. After the follow-up period, patients were divided into two groups: those with P-THY, and those with T-THY, and prospectively analyzed. Patients with anti-PD1-antibody induced isolated ACTH deficiency (PD1-IAD) were individually analyzed in the P-THY group. Written informed consent was obtained from all patients. The study protocol was approved by the Wakayama Medical University Institutional Ethical Review Board, and was conducted in accordance with the principles of the Declaration of Helsinki.
Thyroid irAE was defined as follows: 1) increased serum FT4 and decreased TSH levels: overt thyrotoxicosis [TOX]; 2) normal FT4 and decreased TSH levels: subclinical thyrotoxicosis [S-TOX]; 3) decreased FT4 and increased TSH levels: overt hypothyroidism [HYPO]; and 4) normal FT4 and increased TSH levels: subclinical hypothyroidism [S-HYPO]. Patients with P-THY required therapy (L-T4 supplemental therapy for hypothyroidism or anti-thyroidal therapy for hyperthyroidism) to maintain euthyroid (obtaining normal TSH levels) for more than 3 months until the most recent visit, and those with T-THY required no therapy or therapy within 1 month for thyroid irAE.
HLA-genotyping
DNA was extracted from blood, and HLA-allele genotyping in HLA-A, B, C, DRB1, DRB345, DQA1, DQB1, DPA1, and DPB1 alleles was carried out by next-generation sequence method (GenoDive Pharma, Kanagawa, Japan). Haplotype frequencies were estimated by direct counting [9]. Allele and haplotype frequencies of patients in our study were compared with those of healthy Japanese controls [10, 11]. The controls in the database were employed as in previous reports [4]. Note that it is not clear whether the controls include occult thyroid diseases such as subclinical thyroid dysfunctions and malignancies.
Statistical analysis
Mann–Whitney U-tests were used to compare two individual groups or paired samples between 2 groups. For each factor, receiver operating characteristic curve (ROC) and area under the curve were estimated in a logistic regression model. Cut-off values in the ROC were estimated. Differences including allele or haplotype frequencies between 2 individual groups were analyzed by Fisher’s exact test using 2 × 2 contingency tables.
Kaplan-Meier curves for overall survival in the 2 groups were compared by generalized Wilcoxon test instead of log-rank test because of the small sample size.
Statistical analyses were performed using JMP, version 14 (SAS Institute, Cary, N.C., USA). P value <0.05 was considered to be statistically significant.
Results
Patients
During the follow-up period, 25 patients that developed thyroid irAE (15 of P-THY, and 10 of T-THY) were enrolled in the study. Baseline demographic data, treatments of ICI, and malignancies are described in Table 1, Supplemental Fig. 1, and Supplemental Table 1. All patients with P-THY in the current study required permanent L-T4 supplemental therapy to maintain euthyroid. Among the patients with P-THY, 6 developed thyrotoxicosis (all subsequently became hypothyroid), 5 had hypothyroidism and 4 had subclinical hypothyroidism, they all subsequently underwent L-T4 therapy. Of the patients with T-THY, 4 patients developed thyrotoxicosis, 1 developed subclinical thyrotoxicosis and 5 developed subclinical hypothyroidism, but all spontaneously recovered. Meanwhile, the overall incidence of thyroid irAE was 19.6% in our previous cohort [5].
Table 1
Patients background in the study
|
N |
Age |
Gender
(M, F) |
BH
(cm) |
BW
(kg) |
BMI
(kg/m2) |
Time at onset
(weeks) |
Malignancy |
Treatment |
| P-THY |
15 (60%) |
71.7 ± 12.2 |
11, 4 |
162.5 ± 9.2 |
57.1 ± 12.2 |
21.4 ± 3.7 |
7.5 ± 5.2 |
NSCLC 5, MM 4, GC 2, URO 2, RCC 1, HC 1 |
Nivo 6, Pem 6, Ipi/Nivo 1, Atezo 2 |
| T-THY |
10 (40%) |
64.0 ± 17.4 |
7, 3 |
161.0 ± 10.0 |
53.6 ± 11.4 |
20.8 ± 3.4 |
5.6 ± 2.8 |
MM 3, GC 5, URO 1, HL 1 |
Nivo 8, Pem 1, Ipi/Nivo 1 |
| Total |
25 |
68.6 ± 14.7 |
18, 7 |
161.9 ± 9.3 |
55.7 ± 11.8 |
21.1 ± 3.5 |
6.7 ± 4.4 |
NSCLC 5, MM 7, GC 7, URO 3, RCC 1, HC 1, HL 1 |
Nivo 14, Pem 7, Ipi/Nivo 2, Atezo 2 |
| p |
N/A |
NS |
NS |
NS |
NS |
NS |
NS |
N/A |
N/A |
N, number; BH, body height; BW, body weight; BMI, body mass index; M, male; F, female
P-THY, patients with persistent thyroid irAE; T-THY, patients with temporary thyroid irAE; Age, BH, BW, and BMI are represented in mean ± SD
Malignancy, name of neoplasm; NSCLC, non-small cell lung cancer; MM, malignant melanoma; HC, Hypopharyngeal cancer; GC, gastric cancer; RCC, renal cell carcinoma; URO, urogenital cancer, HL, Hodgkin Lymphoma
Nivo, nivolumab; Pem, pembrolizumab; Ipi/Nivo, combination of ipilimumab and nivolumab; Atezo, atezolizumab
Comparison of the levels between P-THY and T-THY groups using Mann-Whitney U-test except for gender.
Difference of gender was analyzed using Fisher’s exact test with 2 × 2 contingency tables.
p, p-value; NS, not significant; N/A, not applicable.
Regarding other-organ irAEs, anti-PD1-antibody induced isolated ACTH deficiency occurred in 4 patients, interstitial pneumonitis in 2 patients, and 2 patients developed encephalitis. There was no significant difference between the P-THY and T-THY groups in age, gender, body height, body weight, body mass index, or time at onset of thyroid irAE (Table 1).
Differences of thyroid function between the P-THY and T-THY groups
Thyroid function of the patients is shown in Table 2 and Supplemental Table 2. The levels of TSH, FT3, and FT4 at baseline, at onset, and fold increases did not differ between P-THY and T-THY groups (Table 2A). In the comparison of patients with TOX in P-THY group (n = 6, referred to as TOX1), and TOX and S-TOX patients in T-THY group (n = 5, referred to as TOX2), levels of TSH, FT4, and TSH/FT4 ratio at onset did not differ significantly (Fig. 1A, B, and C and Table 2B). Notably, minimum TSH levels in TOX1 patients were significantly lower than those in TOX2 patients (p = 0.0097) (Fig. 1D and Table 2B). Maximum FT3 levels in most of TOX1 and TOX2 patients were elevated (data not shown). Maximum FT4 levels in TOX1 patients were significantly higher than those in TOX2 patients (p = 0.0225) (Fig. 1E and Table 2B). Moreover, the ratio of minimum TSH to maximum FT4 in TOX1 patients was significantly lower than that in TOX2 patients (p = 0.0081) (Fig. 1F and Table 2B). According to the ROC (figure not shown) in a logistic regression model, each cut-off value was determined as follows: minimum TSH as 0.01; AUC, 0.97 (p = 0.0006, 95% confidence interval (CI): 0.622–0.998), with sensitivity 0.83 and specificity 1.0, maximum FT4 as 2.83; AUC 0.93 (p = 0.0035, 95% CI: 0.544–0.994), with sensitivity 0.83 and specificity 1.0, and minimum TSH/FT4 as 0.0048; AUC 1.0 (p < 0.0001), with sensitivity 1.0 and specificity 1.0. The association of FT3 with P-THY and T-THY was unclear because some patients with low T3 syndrome were possibly affected by low nutrition status (data not shown).
Table 2
Thyroid function of the patients who developed thyroid irAE
| A |
|
N |
TSH |
FT3 |
FT4 |
|---|
| 0 w |
at onset |
FI |
0 w |
at onset |
FI |
0 w |
at onset |
FI |
| P-THY |
15 |
1.58
(1.3, 4.27) |
6.03
(0.013, 16.1) |
2.61
(0.01, 8.12) |
2.54
(2.38, 2.81) |
2.82
(1.28, 6.24) |
1.15
(0.52, 2.18) |
1.22
(1.14, 1.38) |
1.1
(0.77, 2.96) |
0.98
(0.48, 2.14) |
| T-THY |
10 |
2.61
(1.05, 3.76) |
2.86
(0.14, 5.56) |
0.87
(0.11, 1.76) |
2.77
(2.5, 3.24) |
2.36
(1.96, 3.19) |
0.86
(0.71, 1.1) |
1.43
(1.22, 1.57) |
1.46
(1.22, 1.92) |
1.02
(0.88, 1.57) |
| Total |
25 |
1.91
(1.2, 3.88) |
5.35
(0.11, 8.0) |
1.48
(0.06, 3.59) |
2.57
(2.43, 3.07) |
2.6
(1.84, 4.18) |
1.05
(0.69, 1.73) |
1.24
(1.56, 1.44) |
1.23
(0.97, 2.21) |
0.99
(0.84, 1.66) |
| p |
N/A |
NS |
NS |
NS |
NS |
NS |
NS |
NS |
NS |
NS |
| B |
|
N |
TSH at onset |
FT4 at onset |
TSH/FT4 at onset |
MIN TSH |
MAX FT4 |
MIN TSH/MAX FT4 |
|---|
| TOX1 |
6 |
0.015 (0.01, 0.244) |
3.55 (2.12, 5.25) |
0.004 (0.003, 0.08) |
0.005 (0.005, 0.013) |
3.85 (2.65, 4.5) |
0.0016 (0.0011, 0.0047) |
| TOX2 |
5 |
0.146 (0.108, 0.281) |
1.79 (1.48, 2.46) |
0.071 (0.051, 0.207) |
0.094 (0.025, 0.265) |
1.79 (1.48, 2.45) |
0.036 (0.013, 0.202) |
| Total |
11 |
0.122 (0.013, 0.153) |
2.29 (1.79, 4.14) |
0.066 (0.004, 0.082) |
0.02 (0.005, 0.094) |
2.63 (1.79, 4.14) |
0.0048 (0.0014, 0.036) |
| p |
N/A |
0.3142 |
0.0547 |
0.1709 |
0.0116 |
0.0225 |
0.0081 |
N, number; P-THY, patients with persistent thyroid irAE; T-THY, patients with temporary thyroid irAE
TOX1, thyrotoxic patients in P-THY group; TOX2, thyrotoxic or subclinical thyrotoxic patients in T-THY group.
TSH, thyrotropin (μU/mL) (normal range, 0.5~5.0); FT3, free triiodothyronine (pg/mL) (2.3~4.0); FT4, free thyroxine (ng/dL) (0.9~1.6)
0 w, value before ICI treatment; FI, Fold increase: the ratio of value at onset/value at 0 w. Median (lower quartile, upper quartile) values are shown.
MIN TSH, minimum value of TSH; MAX FT4, value of FT4 at MIN TSH. MIN TSH/MAX FT4, the ratio of MIN TSH and MAX FT4.
p, p-values in comparison of the levels between P-THY and T-THY groups using Mann-Whitney U-test. P-values less than 0.05 are shown in bold. NS, not significant; N/A, not applicable.

Comparison of thyroid autoantibodies, Tg, and other factors between P-THY and T-THY groups is shown in Fig. 2A–C, Table 3, and Supplemental Table 3. Note that Tg assay was not based on mass spectrometry method.

Table 3
Thyroglobulin, autoantibodies, and rheumatoid factors of the patients who developed thyroid irAE
| A |
|
Tg |
MAX
Tg |
TgAb |
MAX
TgAb |
TPOAb |
MAX
TPOAb |
ANA |
RF |
|---|
| 0 w |
at onset |
FI |
0 w |
at onset |
FI |
0 w |
at onset |
FI |
0 w |
at onset |
FI |
0 w |
at onset |
FI |
| P-THY |
13.5
(3.1, 52.6) |
45
(12.3, 152.3) |
1.46
(1.13, 8.11) |
47.3
(17.1, 152.3) |
87.4
(10, 637.9) |
484.5
(10, 1158.5) |
1
(1, 6.21) |
438.5
(10, 1159) |
15.9
(9, 233.3) |
65.75
(9, 266.8) |
1
(0.83, 1.21) |
15.9
(9, 449.7) |
40
(40, 140) |
40
(40, 120) |
1
(1, 2) |
7.8
(5.2, 17.8) |
8.9
(5, 20.3) |
1
(0.96, 1.51) |
| T-THY |
11.8
(7.5, 20.8) |
19.6
(9.5, 34.2) |
1.39
(0.99, 2.49) |
24.6
(18.6, 35.3) |
10
(10, 10.8) |
10
(10, 17.9) |
1
(1, 1.62) |
10
(10, 18.7) |
9
(9, 9.9) |
9
(9, 12.9) |
1
(0.91, 1.11) |
9.45
(9, 14.4) |
40
(40, 60) |
40
(40, 130) |
1
(1, 1.75) |
5
(5, 5.9) |
5
(5, 8.1) |
1
(1, 1.35) |
| Total |
12.1
(5.4, 27.3) |
23.5
(9.8, 47.3) |
1.46
(1.08, 4.27) |
32.9
(19.3, 51.9) |
10
(10, 158) |
21.8
(10, 662.2) |
1
(1, 2.39) |
22.3
(10, 726) |
9.7
(9, 109.4) |
9.5
(9, 141.7) |
1
(0.9, 1.11) |
10
(9, 198.9) |
40
(40, 80) |
40
(40, 120) |
1
(1, 2) |
5
(5, 10.8) |
5.9
(5, 11.7) |
1
(1, 1.36) |
| p |
NS |
NS |
NS |
NS |
0.035 |
0.015 |
N/A |
0.0177 |
N/A |
N/A |
N/A |
N/A |
N/A |
N/A |
N/A |
0.0244 |
N/A |
N/A |
P-THY, patients with persistent thyroid irAE; T-THY, patients with temporary thyroid irAE
Tg, thyroglobulin (ng/mL) (normal range, <33.7); TgAb, anti-thyroglobulin antibody (IU/mL) (<28.0); TPOAb, anti-thyroperoxidase antibody (IU/mL) (<16.0); ANA, antinuclear antibody (<40); RF, Rheumatoid factor (IU/mL) (<15.0)
0w, value before ICI treatment; FI, Fold increase: the ratio of value at onset/value at 0w. Median (lower quartile, upper quartile) values are shown.
MAX Tg, maximum value of Tg; MAX TgAb, maximum value of TgAb; MAX TPOAb, maximum value of TPOAb
p, p-values in comparison of the levels between P-THY and T-THY groups using Mann-Whitney U-test. P-values less than 0.05 are shown in bold. NS, not significant; N/A, not applicable.
| B |
|
P-THY |
T-THY |
|
|---|
| MAX Tg <33.7 |
9 |
2 |
11 |
| MAX Tg ≥33.7 |
4 |
8 |
12 |
|
13 |
10 |
p = 0.0361 |
The association of MAX Tg levels with numbers in each group was analyzed using Fisher’s exact test with 2 × 2 contingency tables.
Four patients of P-THY (P-1, 7, 8, and 9; 4/15 = 26.7%) and 7 patients of T-THY (T-1, 5, 6, 7, 8, 9, and 10; 7/10 = 70%) were negative for both TgAb and TPOAb (Table 3C and Supplemental Table 3). TRAb levels were normal in all 25 patients. TgAb levels at baseline and also at onset were significantly higher in patients with P-THY than in patients with T-THY (p = 0.0350, and p = 0.0150, respectively) (Fig. 2A and Table 3A). Maximum TgAb levels in the course were also significantly higher in patients with P-THY than in patients with T-THY (p = 0.0177) (Fig. 2B and Table 3A). According to the ROC (figure not shown) in a logistic regression model, each cut-off value was follows: TgAb at baseline as 140; AUC, 0.74 (p = 0.0035, 95% CI: 0.524–0.882), with sensitivity 0.5 and specificity 1.0, TgAb at onset as 241; AUC, 0.79 (p = 0.0018, 95% CI: 0.57–0.91), with sensitivity 0.64 and specificity 0.9, and maximum TgAb as 31.4; AUC, 0.78 (p = 0.0036, 95% CI: 0.562–0.906), with sensitivity 0.71 and specificity 0.8.
Anti-thyroperoxidase antibody (TPOAb) levels are not significantly different in any timing between 2 groups. Moreover, the levels of rheumatoid factor were significantly higher in patients with P-THY than in patients with T-THY (p = 0.0244) (Fig. 2C and Table 3A). There was no association of Tg levels (cut-off value, Tg = 33.7 ng/mL) with either P-THY or T-THY group at onset (Table 3B and Supplemental Table 3). However, significantly more patients with Tg ≥33.7 ng/mL were observed in P-THY group than in T-THY group (p = 0.0361, odds ratio (OR): 9.00, 95% confidence interval (95% CI): 1.29–63.03) (Table 3C and Supplemental Table 3). P-THY patients had higher levels of RF than those in T-THY at baseline (p = 0.0244) (Table 3A and Supplemental Table 3).
HLA-class I alleles in patients with P-THY and T-THY
HLA analysis was done in 13 patients with P-THY (10 without PD1-IAD, 3 with PD1-IAD), and 5 patients with T-THY (Supplemental Table 1). HLA-B*46:01 allele frequencies of patients with P-THY without PD1-IAD were significantly higher than those of controls (20 vs. 4.51%, respectively, p = 0.0413, OR: 4.75, 95%CI: 1.15–19.60) (Supplemental Table 4). HLA-C*14:02 allele frequencies of patients with T-THY were significantly higher than those of controls (30 vs. 6.84%, respectively, p = 0.0467, OR: 5.69, 95% CI: 1.20–26.97) (Supplemental Table 4).
HLA-class II alleles in patients with P-THY and T-THY
HLA-DPA1*01:03 allele frequencies were significantly higher in patients with P-THY without PD1-IAD, than in controls (65 vs. 40.30%, respectively, p = 0.0498, OR: 2.79, 95%CI: 1.02–7.59). More strongly, the allele frequencies were significantly higher in patients with P-THY than in controls (65.38 vs. 40.30%, respectively, p = 0.0269, OR: 2.83, 95%CI: 1.15–6.98), (Fig. 3A, Supplemental Table 4).

HLA-DPB1*02:01 allele frequencies were significantly higher in patients with P-THY, than in controls (46.15 vs. 24.11%, respectively, p = 0.0490, OR: 2.71, 95%CI: 1.11–6.66) (Fig. 3B, Supplemental Table 4). More strongly, the allele frequencies were significantly higher in patients with P-THY without PD1-IAD than in controls (50 vs. 24.11%, respectively, p = 0.0283, OR: 3.17, 95%CI: 1.18–8.52). In contrast, HLA-DPB1*05:01 allele frequencies were significantly lower in patients with P-THY, than in controls (11.54 vs. 38.40%, respectively, p = 0.0099, OR: 0.21, 95%CI: 0.06–0.76) (Fig. 3C, Supplemental Table 4).
HLA-haplotypes in patients with P-THY and T-THY
HLA-DPA1*01:03-DPB1*02:01 haplotype frequencies were significantly higher in P-THY without PD1-IAD than in controls (45 vs. 21.06%, respectively, p = 0.0440, OR: 3.08, 95% CI: 1.13–8.40) (Fig. 4A, Supplemental Table 5).
The haplotype frequencies were also significantly higher in P-THY groups than in controls (42.31 vs. 21.06%, respectively, p = 0.0411, OR: 2.76, 95% CI: 1.11–6.89) (Fig. 4A, Supplemental Table 5).
In contrast, HLA-DPA1*02:02-DPB1*05:01 haplotype frequencies were significantly lower in patients with P-THY without PD1-IAD than in controls (10 vs. 34.24%, respectively, p = 0.0345, OR: 0.22, 95% CI: 0.05–0.98) (Fig. 4B, Supplemental Table 5).
The haplotype frequencies were also significantly lower in patients with P-THY than in controls (7.69 vs. 34.24%, respectively, p = 0.0072, OR: 0.16, 95% CI: 0.04–0.73), (Fig. 4B, Supplemental Table 5).
Total thyroid dysfunctions in HLA-B*46:01 allele, HLA-C*14:02 allele, HLA-DPA1*01:03 allele, HLA-DPB1*02:01 allele, HLA-DPB1*05:01 allele, HLA-DPA1*01:03-DPB1*02:01 haplotype, and HLA-DPA1*02:02-DPB1*05:01 haplotype did not show significant difference from controls (Figs. 3, 4, and Supplemental Tables 4B, 4C, 4H, 4I, and 5C).
To clarify the differences between P-THY and T-THY, we compared HLA-class I and II allele and haplotype frequencies in each entity, and there were no obvious differences.
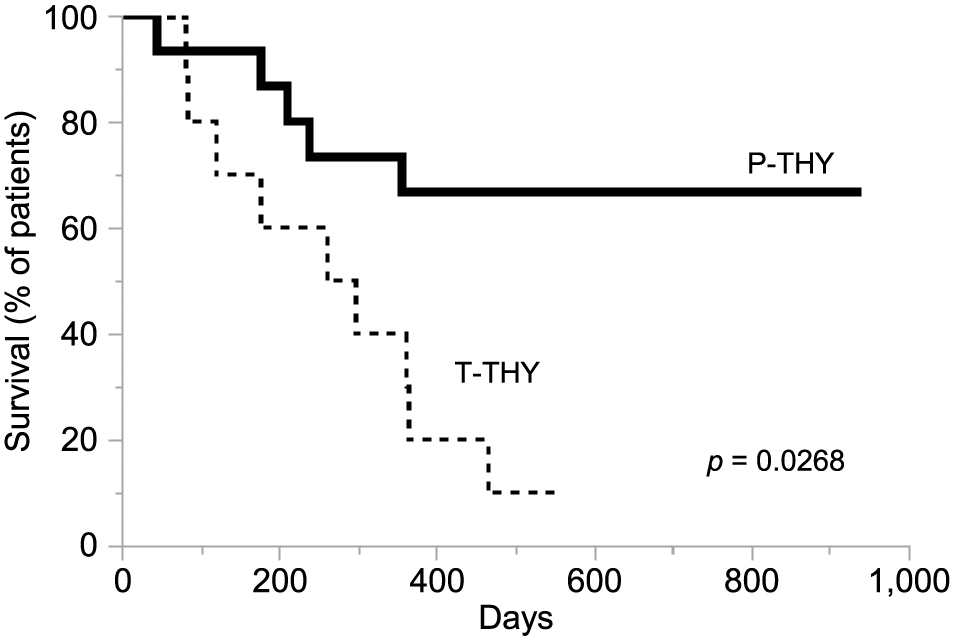
Overall survival of the study groups
Kaplan-Meier curves for overall survival between P-THY and T-THY groups were analyzed. P-THY was significantly correlated with improved overall survival compared with T-THY (p = 0.0268) (Fig. 5). Note that normalization of thyroid function was obtained during the course by treatment of L-T4 in patients with P-THY.
Discussion
In the current study, lower-value of TSH, higher-value of FT4, and lower value of TSH/FT4 were thought to be predictive markers for P-THY estimation. In addition, TgAb levels were significantly higher in patients with P-THY than those in patients with T-THY. HLA-DPA1*01:03, HLA-DPB1*02:01 allele, and their haplotype frequencies were significantly higher in patients with P-THY than those in controls. The survival rate in patients with P-THY was better than in patients with T-THY.
Comparison of thyrotoxic patients in the 2 groups showed that minimum TSH levels (lower in P-THY) and maximum FT4 levels (higher in P-THY) were significantly different. The result suggests more leakage of thyroid hormone occurred following more severe thyroiditis in patients with P-THY. The more severe thyroiditis seemed to be associated with persistent hypothyroidism.
TgAb levels at baseline and also at onset of thyroid irAE were significantly higher in patients with P-THY than those with T-THY. Early increase of TgAb and TPOAb have also been reported to be associated with thyroid irAE [5]. It was also reported that either high titer of TgAb or TPOAb prior to ICI therapy might be related to Thyroid irAE [1-3, 5, 8]. The current study is consistent with those previous studies, suggesting that patients who have thyroid autoantibody are likely to develop P-THY. However, considering the 4 out of the 15 patients (26.7%) with P-THY were negative for both TgAb and TPOAb, thyroid autoantibodies-independent cytotoxic mechanisms might be related to P-THY.
Moreover, a significantly greater number of patients who had serum Tg ≥33.7 ng/mL were observed in the P-THY group than in the T-THY group. Early increase of serum Tg was reported to be associated with thyroid irAE [5]. Therefore, serum Tg elevation may be a reasonable indicator of thyroiditis. However, in the presence of TgAb, there might be decrease in Tg levels.
Taken together, those who have thyroid autoimmunity seem to be prone to be P-THY during ICI treatment, and have a risk of developing persistent hypothyroidism. Considering that P-THY patients had higher levels of RF than those wiht T-THY at baseline, there may be autoimmunity other than thyroid gland involved in P-THY.
Although studies on Hashimoto’s thyroiditis (HT) and Graves’ disease (GD) have described predisposition to human leukocyte antigen (HLA) in Japanese people [12], the current study is the first investigation of HLA in connection with thyroid irAE in Japanese people.
In the P-THY group, HLA-DPA1*01:03 and HLA-DPB1*02:01 allele frequencies and their haplotype frequencies were more significantly increased than those in controls. Notably, P-THY without PD1-IAD was associated with HLA-DPB1*02:01 rather than HLA-DPA1*01:03, and P-THY including PD1-IAD was related to HLA-DPA1*01:03 rather than HLA-DPB1*02:01. The reason for this is unclear, but considering the thyroid and pituitary autoimmunity, thyroid-specific irAE may be related to the thyroid epitope presentation on HLA-DPA1*01:03. The associations of HLA-DPB1*02:01 with acute lymphoblastic leukemia [13] and with chronic beryllium disease [14] have been reported, but the relation between HLA-DPB1*02:01 and thyroid diseases is unclear. Interestingly, HLA-DPB1*02:01 allele is mostly accompanied with HLA-DPA1*01:03 allele, and HLA-DPA1*01:03 allele is often linked to various HLA-DPB1 alleles [9].
On the other hand, HLA-DPB1*05:01 allele and HLA-DPA1*02:02-DPB1*05:01 haplotype were seen less in the P-THY group. These alleles or haplotypes may possess the distinct epitope binding cleft from those in predispose allele or haplotype.
HLA-A*02:07 and HLA-DRB4 were reported to be associated with Japanese HT patients [12]. Moreover, HLA-DR3 was reported to be associated with GD and HT in a Caucasian population [15, 16], but the allele frequencies were not increased in the current study. In cases of GD, HLA-DPB1*05:01 was identified as a predispose allele in Japanese, this is different from other ethnicities [12, 16]. Similarly, susceptible alleles for hypophysitis were different between Caucasian and Japanese [4]. Thus, differences in ethnic background may mean differences in HLA alleles susceptible to diseases.
Increased allele frequencies of HLA-B*46:01 in P-THY without IAD and those of HLA-C*14:02 in T-THY in HLA-class I allele might be associated with the pathogenesis in aspects of thyroid autoimmunity. HLA-B*46:01 allele was reported to be increased in Japanese GD patients [12]. Moreover, a haplotype complex in which both HLA-class I and HLA-class II are involved may explain the relation of HLA-Class I and HLA-class II mediated epitope presentation.
Total thyroid dysfunctions in all HLA alleles and haplotypes did not show significant difference from controls, possibly because total thyroid dysfunctions include P-THY and T-THY which have different predisposed HLA alleles and haplotypes.
Thyroid autoantigen as well as tumor-associated antigen/neoantigen could be presented with HLA on the surface of antigen-presenting cells. Amino acid sequence homologies in tumor-associated antigen and thyroid autoantigens in panels of HLA-class I and class II binding motifs have been reported [17]. Therefore, mechanisms of thyroid irAE can be partly explained by cross presentation of thyroid autoantigen and tumor-associated antigen/neoantigen [16, 17].
Thyroid irAE often occurs during anti-PD-1 antibody treatments, and a causative reason for the thyroid irAE may be the PD-L1 expression in the thyroid gland [8]. In addition, environmental factors may also influence the development of thyroid irAE.
Positive relation between incidence of thyroid irAE and feasible outcome of lung cancer has been reported [8]. Similarly, Kotwal et al. reported that anti-PD-L1 antibody induced thyroiditis was associated with better overall survival in cancer patients [18].
These studies above may suggest that P-THY and T-THY have better prognosis in patients with cancer. The current study suggests that patients with P-THY have better prognosis than those with T-THY. It could be speculated that different kinds of cancer in the 2 groups might explain the difference in survival. Nevertheless, predispose or protective HLA to P-THY or T-THY may explain the difference.
Since our study consists of a small number of patients and includes mixed tumors, further studies are needed to establish clinical features and HLA of P-THY and T-THY, including correlation with anti-tumor activities. The relation of thyroid ultrasounds or scintigraphy to thyroid irAE should also be clarified in detail. Considering the current study was done in one localized region, HLA studies in other regions in Japan, and those in other ethnicities are warranted. Furthermore, although the controls as general population from HLA database may include occult thyroid dysfunctions and malignancies, the number of controls reached sufficient number for statistical analysis. The relation of HLA to the prognosis of the malignancy is also unknown.
In conclusion, peak TSH and FT4 levels in thyroid dysfunction, maximum Tg levels and TgAb titers during treatment with ICI seem to be associated with the development of P-THY. In addition, our results suggest that HLA-DPA1*01:03, HLA-DPB1*02:01, and their haplotype frequencies are susceptible to P-THY. P-THY was significantly correlated with improved overall survival compared with T-THY. Therefore, P-THY may play an important role in cancer immunotherapy. Further investigations are warranted to clarify the detailed mechanisms in P-THY and T-THY.
Abbreviations
ICI, Immune -checkpoint inhibitor; PD-1, Programmed cell death protein 1; CTLA-4, Cytotoxic T lymphocyte-associated antigen 4; irAEs, Immune-related adverse events; NSCLC, Non-small cell lung cancer; RCC, Renal cell carcinoma; MM, malignant melanoma; GC, gastric cancer; HLA, Human Leukocyte Antigen; TSH, thyroid stimulating hormone; Tg, thyroglobulin, TgAb, anti-thyroglobulin antibody; TPOAb, anti-thyroperoxidase antibody; ANA, anti-nuclear anybody
Acknowledgments
We are greatly indebted to Professors Yuki Yamamoto, Masatoshi Jinnin, Nobuyuki Yamamoto, Takashi Sonoki, Isao Hara, and Hiroki Yamaue at Wakayama Medical University. We also thank Dr Hidetoshi Inoko (Tokai University) and Yuko Okudaira (GenoDive Pharma Inc.) for technical advice. Finally, we acknowledge English proofreading and editing by Benjamin Phillis (Wakayama Medical University).
Authors’ Contributions
All authors designed the study, and participated in treatment of the patient, collected data, interpreted the data, and wrote the manuscript. All authors read and approved the final manuscript.
Competing Interests
The authors have no competing interests to disclose.
References
- 1 Inaba H, Ariyasu H, Takeshima K, Iwakura H, Akamizu T (2019) Comprehensive research on thyroid diseases associated with autoimmunity: autoimmune thyroid diseases, thyroid diseases during immune-checkpoint inhibitors therapy, and immunoglobulin-G4-associated thyroid diseases. Endocr J 66: 843–852.
- 2 Inaba H, Ariyasu H, Okuhira H, Yamamoto Y, Akamatsu H, et al. (2018) Endocrine dysfunctions during treatment of immune-checkpoint inhibitors. Trends in Immunotherapy 2: 1–9.
- 3 Arima H, Iwama S, Inaba H, Ariyasu H, Makita N, et al. (2019) Management of immune-related adverse events in endocrine organs induced by immune checkpoint inhibitors: clinical guidelines of the Japan Endocrine Society. Endocr J 66: 581–586.
- 4 Inaba H, Ariyasu H, Iwakura H, Ueda Y, Kurimoto C, et al. (2019) Comparative analysis of HLA between idiopathic and anti-PD-1 antibody induced isolated ACTH deficiency: a pilot study. Clin Endocrinol (Oxf) 91: 786–792.
- 5 Kurimoto C, Inaba H, Ariyasu H, Iwakura H, Ueda Y, et al. (2020) Predictive and sensitive biomarkers for thyroid dysfunctions during treatment with immune-checkpoint inhibitors. Cancer Sci 111: 1468–1477.
- 6 Ariyasu H, Inaba H, Ota T, Yamaoka H, Furukawa Y, et al. (2018) Thyrotoxicosis and adrenocortical hormone deficiency during immune-checkpoint inhibitor treatment for malignant melanoma. In Vivo 32: 345–351.
- 7 Shiba M, Inaba H, Ariyasu H, , Kawai S, Inagaki Y, et al. (2018) Fulminant type 1 diabetes mellitus accompanied by positive conversion of anti-insulin antibody after the administration of anti-CTLA-4 antibody following the discontinuation of anti-PD-1 antibody. Intern Med 57: 2029–2034.
- 8 Yamauchi I, Yasoda A, Matsumoto S, Sakamori Y, Kim YH, et al. (2019) Incidence, features, and prognosis of immune-related adverse events involving the thyroid gland induced by nivolumab. PLoS One 14: e0216954.
- 9 Imanishi T, Akaza T, Kimura A, Tokunaga K, Gojobori T (1991) Allele and haplotype frequencies for HLA and complement loci in various ethnic groups. In: Tsuji K, Aizawa M, Sasazuki T (eds) HLA 1991: Proceedings of the Eleventh International Histocompatibility Workshop and Conference. Vol. 1 Oxford University Press, Oxford, UK, 1992; 1065–1220.
- 10 Japanese Society for Histocompatibility and Immunogenetics: http://jshi.umin.ac.jp/standarization/JSHI-hyokiallele-2019list.pdf : JSHI accessed on March 1, 2020.
- 11 HLA LABORATORY, Japan INC: http://hla.or.jp/med/frequency_search/ja/haplo/ accessed on March 1, 2020.
- 12 Ueda S, Oryoji D, Yamamoto K, Noh JY, Okamura K, et al. (2014) Identification of independent susceptible and protective HLA alleles in Japanese autoimmune thyroid disease and their epistasis. J Clin Endocrinol Metab 99: E379–E383.
- 13 Taylor GM, Dearden S, Ravetto P, Ayres M, Watson P, et al. (2002) Genetic susceptibility to childhood common acute lymphoblastic leukemia is associated with polymorphic peptide-binding pocket profiles in HLA-DPB1*0201. Hum Mol Genet 11: 1585–1597.
- 14 Dai S, Murphy GA, Crawford F, Mack DG, Falta MT, et al. (2010) Crystal structure of HLA-DP2 and implications for chronic beryllium disease. Proc Natl Acad Sci U S A 107: 7425–7430.
- 15 Inaba H, Martin W, Ardito M, De Groot AS, De Groot LJ (2010) The role of glutamic or aspartic acid in position four of the epitope binding motif and thyrotropin receptor-extracellular domain epitope selection in Graves’ disease. J Clin Endocrinol Metab 95: 2909–2916.
- 16 Inaba H, De Groot LJ, Akamizu T (2016) Thyrotropin receptor epitope and human leukocyte antigen in Graves’ disease. Front Endocrinol (Lausanne) 7: 120.
- 17 Vita R, Guarneri F, Agah R, Benvenga S (2014) Autoimmune thyroid disease elicited by NY-ESO-1 vaccination. Thyroid 24: 390–394.
- 18 Kotwal A, Kottschade L, Ryder M (2020) PD-L1 inhibitor-induced thyroiditis is associated with better overall survival in cancer patients. Thyroid 30: 177–184.