Abstract
Fenofibrate is a marketed fibric acid derivative for lipid-lowering in patients with lipid disorders. Numerous studies have proven fenofibrate had a certain effect on serum uric acid, here we conducted this study to quantitatively assess the effect of fenofibrate intervention in modulating serum uric acid concentration and the influence on serum creatinine. The PubMed, Embase and Cochrane were systematically searched for randomized controlled trials update to January, 2020. Primary endpoints focused on serum uric acid concentration and serum creatinine concentration. The pooled effects were calculated as weighted mean difference (WMD) by a random-effects model. Finally, 9 studies representing 487 patients were included in the meta-analysis. The meta-analysis demonstrated that fenofibrate significantly reduced serum uric acid levels (WMD –1.32 mg/dL, 95%CI –1.61 to –1.03, p < 0.001) and an elevated level in serum creatinine (WMD 0.09 mg/dL, 95%CI 0.02 to 0.15, p < 0.001) following fenofibrate therapy compared with placebo. The present study provided strong evidence that fenofibrate intervention exerted a significant reduction on serum uric acid and a mild increase on serum creatinine. Meta-analysis suggested that there were no significant association between the serum uric acid lowering effect with either dose or treatment duration. Overall, our meta-analysis ascertained that fenofibrate have potential therapeutic effects in patients with lipid metabolic abnormalities but with mid nephrotoxicity. There is strong evidence to provide future direction of practical application and clinical researches of fenofibrate.
URIC ACID is the final product of endogenous and ingested purine metabolism mediated by xanthine oxidase. Hyperuricemia is a condition characterized by elevated serum uric acid due to the increase of the production or decrease of the excretion. While hyperuricemia not only been classically associated with gouty arthritis, but also been addressed as a possible risk factor for chronic kidney disease, dyslipidemia, type 2 diabetes mellitus and cardiovascular diseases [1-3]. Fenofibrate is a fibric acid derivative marketed since the mid-1970’s. It activates peroxisome proliferator-activated receptor (PPAR-α) which acts on fatty acid transport and β-oxidation, resulting in a decrease in triglyceride levels and an increase in high-density lipoprotein cholesterol levels [4]. Therefore, fenofibrate was applied its lipid-modifying effects to patients with severe hypertriglyceridemia and mixed dyslipidemia, attributed to its lipid-lowering capacity and relatively good safety profile [5, 6].Preciously, the Fenofibrate Intervention and Event Lowering in Diabetes (FIELD) study ascertained that the fenofibrate was associated with more beneficial changes in the serum lipid profile and the risk of several macrovascular or microvascular outcomes than placebo [7]. The Action to Control Cardiovascular Risk in Diabetes (ACCORD) trials also supported the benefit of the microvascular complications of diabetes on retinopathy progression [8]. The uric acid lowering effect of fenofibrate was reported as early as 1988 [9]. One possible mechanism is that the PPAR activator fenofibrate can also exert an anti-inflammatory effect via inhibiting cyclooxygenase-2 (COX-2) enzyme activity [10]. A recent post-hoc analysis of the FIELD study also showed fenofibrate lowered uric acid concentrations by 20% and almost halved first on-study gout events over 5 years of treatment [11]. Meanwhile, a transient serum creatinine rise during the dose-response part of the therapy was observed [12]. Fibrates have been found to lead to a rise in serum creatinine that is reversible with drug withdrawal and are not able to increase the risk for long-term kidney events [7, 8, 13]. Therefore, the use of fenofibrate was recommended in the 2012 American College of Rheumatology guidelines [14] and the 2016 European League Against Rheumatism Guidelines [15] to assist with lowing serum uric acid concentration by enhancing urinary excretion of uric acid.
A previous meta-analysis in 2015 (including articles published before 2008) indicated a significant reduction in plasma uric acid concentrations following fibrate therapy, but this effect did not seem to be a class effect [16]. And there did not have conclusive analysis of the fenofibrate effect on serum creatinine and the therapy safety. In addition, several studies were performed in the last 5 years, which provided us with more reliable statistics. Therefore, we conducted a meta-analysis of relevant studies to evaluate and to describe the association between fenofibrate and uric acid concentrations or creatinine. Additionally, stratified analyses and meta-regression were also conducted on possible variables.
Materials and Methods
Search strategy
This study was designed according to the guidelines of the Preferred Reporting Items for Systematic Reviews and Meta-Analysis (PRISMA) statement [17]. The PubMed, Embase and Cochrane were searched using following search terms in titles and abstracts (also in combination with Medical Subject Heading [MESH] terms): (fenofibrate OR bezafibrate OR ciprofibrate OR clofibrate OR gemfibrozil) AND (uric OR ‘uric acid’ OR urate OR uricosuric OR hyperuricemia OR hyperuricaemia OR hyperuricemic OR hyperuricaemic OR hyporuricemia OR hyporuricaemia OR hyporuricemic OR hyporuricaemic). The wild-card term “*” was used to increase the sensitivity of the search strategy. All the references of the selected articles were manually searched to identify additional studies. Only the data available in the full-text papers were retrieved. The literature was searched from inception to January 31, 2020.
Study selection
This meta-analysis was conducted according to the preferred reporting items for systematic reviews and meta analyses statement. Original studies were included if they met the following inclusion criteria: (1) intervention, fenofibrate monotherapy or as a supplement to other hypolipidemic therapies at least 2 weeks, (2) comparison, placebo or standard care and there was no difference between two groups except for trial drugs; (3) outcome, presentation of sufficient information on uric acid values or creatinine at baseline and the posttreatment in each group; (4) study design, a randomized controlled trial with either parallel or cross-over design. Exclusion criteria were: drugs affecting uric acid metabolism, observational studies with case-control, cross sectional or cohort design, case reports, reviews, trials that were non-randomized trials or lacking of a control group in the study design were excluded.
Data extraction and quality assessment
Two investigators reviewed study titles and abstracts and independently extracted the trials according to predefined criteria. Any discrepancies were resolved through discussion and consensus between the authors. Full-text articles along with accessible supplementary materials from eligible publications were retrieved for data extraction. The following items were extracted from each selected study: first author’s name, publication year, study design, target population, sample size, intervention (fenofibrate dose), comparison, study duration and outcome. The uric acid and creatinine unit was converted into mg/dL, with 1 mg/dL equivalent to 59.485 μmol/L for uric acid and 1 mg/dL to 88.40 μmol/L for creatinine. The study quality was assessed according to the Jadad Score criteria [18]. According to the Jadad Score criteria, methodological quality of included studies in the meta-analysis was assessed according to three study components: randomization, blinding, withdrawals and dropouts. There were two scores for the randomization and blinding, one score for the withdrawals and dropouts. High quality was assigned as at least 3 scores.
Statistical analysis
We assessed the effect of fenofibrate on serum uric acid and serum creatinine, calculated pooled estimates of mean differences between intervention groups by using a random-effects model (DerSimonian-Laird method) to compensate for the heterogeneity of studies in terms of demographic characteristics of populations being studied and also differences in study design [19]. The risk ratio with 95% confidence interval (CI) was calculated for dichotomous data, and weighted mean difference (WMD) with 95% CI was calculated for continuous data. Heterogeneity between the treatment effects in different trials was assessed by the Cochrane Q or I2 statistics. This statistic quantifies the proportion of total variation across studies that is due to heterogeneity rather than chance. If p > 0.05 or I2 < 50% were applied as no obvious heterogeneity of outcomes [20]. In order to evaluate the influence of each study on the overall effect size, sensitivity analysis was conducted using leave-one-out method. To verify the consistency of the results, subgroup analyses were conducted by publication year, race, trial-duration, dose of fenofibrate, types of trial and the type of the control group. Random effects meta-regression was performed using the unrestricted maximum-likelihood method to evaluate the association between calculated WMD and potential confounders, including duration of treatment with fenofibrate and dose of fenofibrate. We assessed the possibility of publication bias by constructing a funnel plot of each trial’s effect size against the standard error (appendix), and Begg’s rank correlation test and Egger’s linear-regression test were used to evaluate potential publication bias (p < 0.10 were considered to be statistically significant [21]. All the statistical analyses were performed using STATA statistical software (version 14.0). P < 0.05 was considered as statistically significant.
Results
Characteristics of included studies
We preliminarily identified 793 studies by initial electronic search, 3 studies were identified by manual search, of which 220 were duplicated, 516 were not met the inclusion criteria after evaluation of titles and/or abstracts and were all excluded. Therefore, 60 full-text articles were carefully assessed and reviewed in full text of which 51 studies were excluded for not meeting the inclusion criteria. Finally, 9 studies [9, 22-29] were eligible for data synthesis. The process of study selection is shown in Fig. 1.

As summarized in Table 1, the 9 studies were carried out between 1988 and 2017 and recruited 487 subjects undergoing fenofibrate therapy, with a sample size ranging from 10 to 158. Fenofibrate was given at a dosage of 160 to 300 mg/ day, and study duration ranged from 6 weeks to 2 years. There were 4 crossover studies [9, 24, 26, 27] and 5 parallel-group studies [22, 23, 25, 28, 29] involving dyslipidemia [9, 22, 23, 26, 27, 29], overweight/obesity [25], type 2 diabetes mellitus [28] and healthy [24] population. With the exception of two open-label studies [22, 25], two trials [23, 29] didn’t describe the blind method, other five studies [9, 24, 26-28] were double-blind trials. According to the quality scale, eight studies had high-quality, one study defined as low-quality due to lacking the description of blinding and dropouts (Table 1).
Table 1
Characteristics of included studies in the meta-analysis
| Study |
Location |
Design |
Targrt population |
Sample size |
Fenofibrate group/Control group |
Study duration |
Quality |
| Oikawa et al. 201722 |
Japan |
parallel-group study |
Hyperlipidemia |
107 |
Micronised fenofibrate 200 mg/d + ezetimibe 10 mg/d |
52 w |
3 |
| 51 |
Ezetimibe 10 mg/d |
|
|
| Krysiak et al. 201523 |
United Kingdom |
parallel-group study |
Atherogenic dyslipidemia and hypogonadism |
15 |
Micronized fenofibrate 200 mg/d + testosterone120 mg/d |
16 w |
2 |
| 15 |
Testosterone120 mg/d |
|
|
| Ansquer et al. 200824 |
France |
crossover study |
Healthy |
12 |
Fenofibrate 160 mg/d |
6 w |
5 |
| 12 |
Placebo |
|
|
| Filippatos et al. 200525 |
Greece |
parallel-group study |
Overweight and obesity |
28 |
Micronised fenofibrate 200 mg/d + orlistat 360 mg/d |
12 w |
3 |
| 29 |
orlistat 360 mg/d |
|
|
| Kazumi et al. 200326 |
Japan |
crossover study |
Hyperlipidemia and/or hyperuricemia |
21 |
Fenofibrate 300 mg/d |
16 w |
4 |
| 22 |
Placebo |
|
|
| Sasaki et al. 200227 |
Japan |
crossover study |
Hyperlipidemia |
24 |
Fenofibrate 300 mg/d |
8 w |
4 |
| 26 |
Placebo |
|
|
| Playford et al. 200228 |
Australia |
parallel-group study |
Type 2 diabetes mellitus and dyslipidemia |
17 |
Micronised fenofibrate 200 mg/d |
12 w |
3 |
| 18 |
Placebo |
|
|
| Serna et al. 199929 |
Spain |
parallel-group study |
Hypercholesterolemia |
40 |
Fenofibrate 250 mg/d |
2 y |
4 |
| 40 |
Placebo |
|
|
| Bastow et al. 19889 |
United Kingdom |
crossover study |
Primary hypertriglyceridemia |
10 |
Fenofibrate 300 mg/d |
6 w |
4 |
| 10 |
Placebo |
|
|
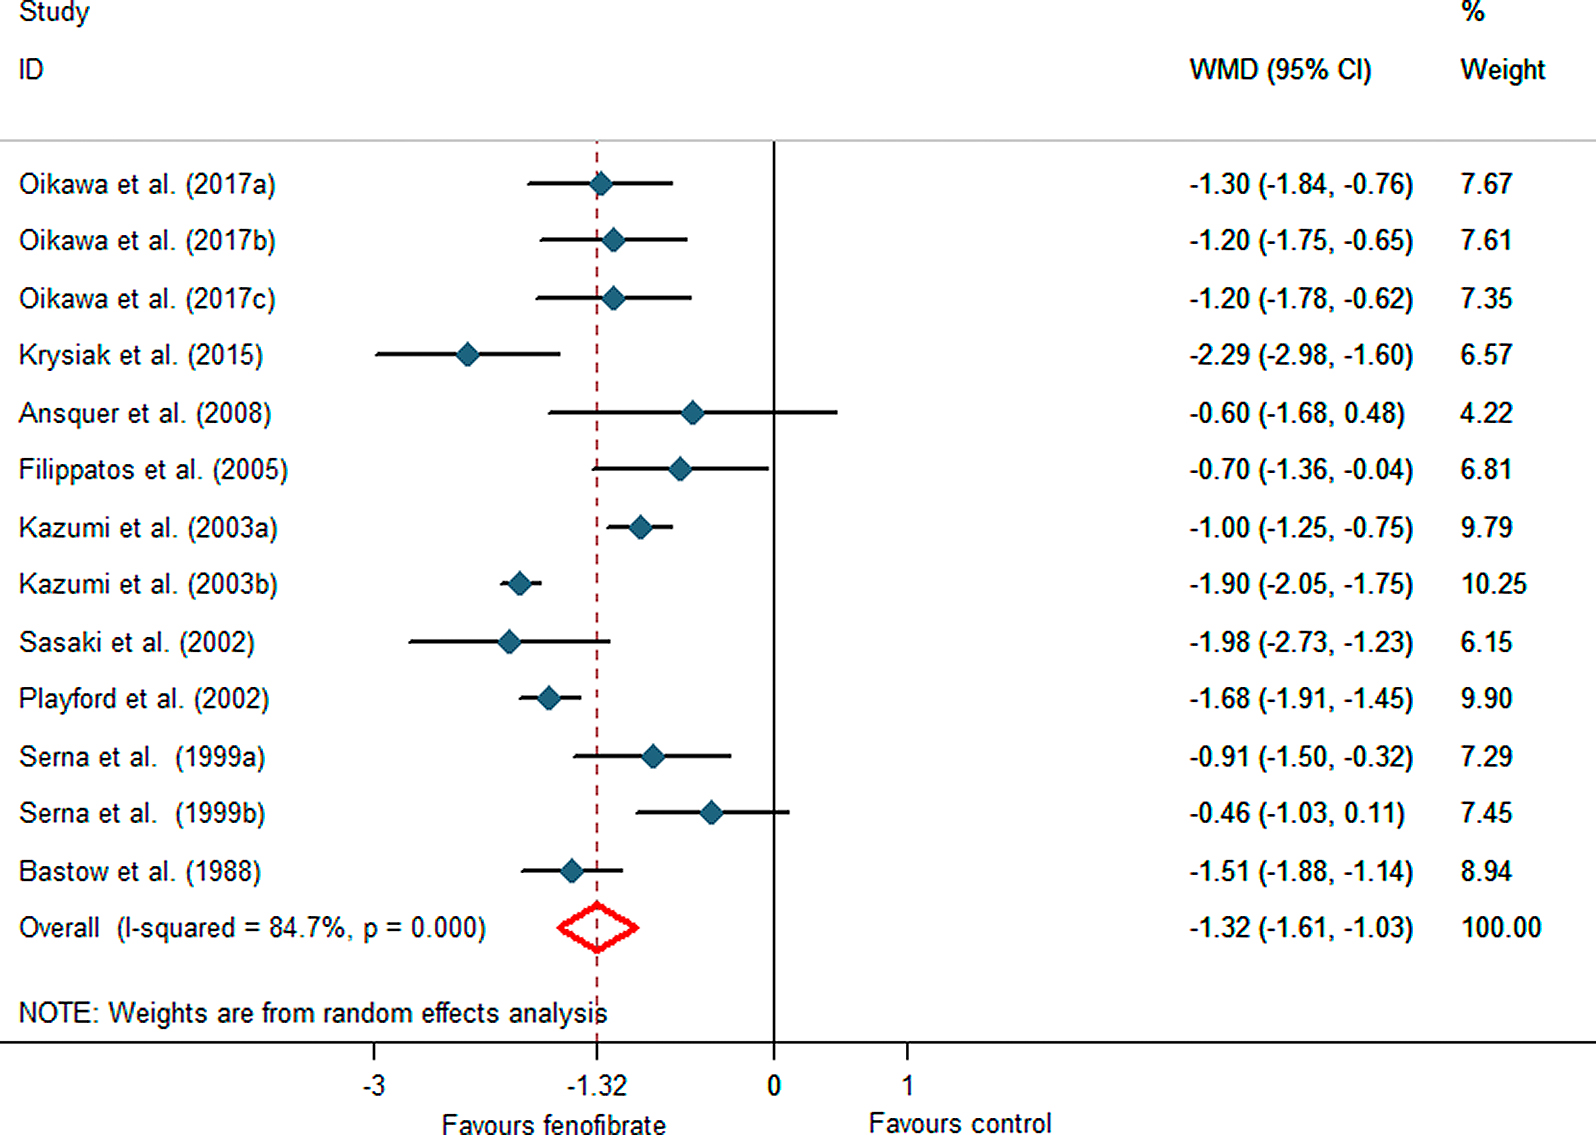
The pooled effect of nine studies showed a significant reduction in serum uric acid concentrations following fenofibrate therapy (WMD –1.32 mg/dL, 95%CI –1.61 to –1.03, p < 0.001), with a between-study heterogeneity (I2 = 84.7%) (Fig. 2).An additional leave-one-out sensitivity analysis showed that the effect size was robust, and non-sensitive to any studies. Subgroup analysis for different treatment duration revealed a pronounced reduction in serum uric acid concentrations with treatment duration ≤8 weeks (WMD –1.43 mg/dL, 95%CI –1.87 to –0.99, p < 0.001) and duration >8 weeks (WMD –1.21 mg/dL, 95%CI –1.65 to –0.78, p < 0.001) versus their baseline values (Fig. 3). When the included studies were categorized according to the type of the control group, although significant reduction of plasma uric acid levels were observed with both subsets of placebo controls (WMD –1.32 mg/dL, 95%CI –1.78 to –0.87, p < 0.022) and non-placebo controls (WMD –1.31 mg/dL, 95%CI –1.68 to –0.94, p < 0.001). Subgroup analysis for different study design also showed a significant reduction of plasma uric acid concentrations in parallel-group studies (WMD –1.23 mg/dL, 95%CI –1.60 to –0.85, p < 0.001) and crossover studies (WMD –1.45 mg/dL, 95%CI –1.96 to –0.95, p < 0.001). The Galbraith plot was used to identify studies that were outside the pooled 95% CI estimate and might serve as potential outliers causing heterogeneity. According to the plot, two studies [26, 29] resided outside the limits of the 95% CI. The second-round analysis excluding these two studies showed a lack of heterogeneity between studies. (I2 = 60.2%), and the pooled effect size remained statistically significant (WMD –1.43 mg/dL, 95%CI –1.71 to –1.16, p = 0.010).
Pooled analysis of five studies (sample number = 283) that assessed the serum creatinine concentration at the intervention of fenofibrate therapy showed a significant effect of increase in serum creatinine than with any other treatment or placebo (WMD 0.09 mg/dL, 95%CI 0.02 to 0.15, p < 0.001). There was obvious between study heterogeneity in five studies (I2 = 88.2) (Fig. 4).
Meta-regression
Random-effects meta-regression was performed to evaluate whether changes in uric acid concentration were dependent on dose or duration of treatment of fenofibrate therapy. There were no significant association revealed between the serum uric acid lowering effect with either dose (slope –0.0023, 95% CI –0.0093 to 0.0048, p = 0.491) or treatment duration (slope 0.0124, 95% CI –0.0086 to 0.0333, p = 0.220) (Fig. 5).
Publication bias
Publication bias was assessed by using funnel plot in the meta-analysis (Fig. 6).The funnel plot of the inverse standard error by effect size (mean difference) was slightly asymmetric and suggested a potential publication bias in the meta-analysis of the efficacy in fenofibrate on serum uric acid concentrations. Neither the Begg’s rank-correlation test (p = 0.066) nor the Egger’s linear-regression test (p = 0.066) showed any evidence of publication bias for the trials.
Safety evaluation
Six of the nine included trials assessed the safety of the fenofibrate [22, 24-28]. Safety was commonly assessed by evaluating serum alanine aminotransferase (ALT), serum aspartate aminotransferase (AST), creatinine concentration and occurrence of any adverse events related to the treatment of fenofibrate during the follow-up periods. None of the included trials reported the occurrence of serious individual adverse events. Two studies did not discover any reported adverse events other than abnormal clinical laboratory values, but most of these abnormal values were mild and transient and not considered clinically significant [25, 27]. Two studies didn’t report any adverse events during the treatment [26, 28]. Fenofibrate-related adverse events reported in one study comprised higher serum ALT (two cases) or AST levels (three cases), stomachache (three cases), liver dysfunction (two cases), higher serum creatinine levels (one case), and gallstone (one case) [22]. One study reported gastrointestinal events in fenofibrate group during the follow period [24].
Discussion
This meta-analysis offers more details on the efficacy and safety of fenofibrate in patients with lipid metabolic disorders. Our results demonstrated a significant reduction in serum uric acid concentrations after fenofibrate therapy compared to the control groups. Fenofibrate decreases serum uric acid concentration by enhancing urinary excretion of uric acid by inhibiting the renal organic anion transporter urate transporter 1 [30], and this lowing-urate effect was independent of serum triglyceride or other lipid parameters [31]. Meanwhile, fenofibrate or its derivatives can also boost the fractional clearance of xanthine, uric acid and oxypurinol via stimulating on their common renal pathways [32]. Of note, the lowing-urate effect was reversed after the withdrawal of the drug [33]. For the increased creatinine, there were several hypotheses described the mechanism of fenofibrate elevation effect on serum creatinine. First and the most dominant one is that fenofibrate may inhibit the expression of vasodilatory prostaglandins, including COX-2, leading to a decreased renal perfusion and glomerular pressure [34]. Second, the increased serum creatinine levels may result from increase creatinine production by accelerating muscular cell lysis, but except for an increase in creatinine, there were unaffected with glomerular filtration rate and renal blood flow [35]. Third, fenofibrate may decrease the creatinine clearance [36].
The adverse events associated with fenofibrate use encompassed increased ALT and AST levels, liver dysfunction and gastrointestinal events. Since fenofibrate can enhance uricosuric effects, urolithiasis seems to be an undesirable side effect. Therefore, development of urolithiasis should be monitored strictly when fenofibrate is administered, especially in patients with high serum uric acid concentration or with a benzbromarone co-treatment. But these patients universally benefit more from fenofibrate therapy for improved renal function due to its potent suppression of oxidative stress, attenuation of inflammation and inhibition of apoptosis [37].
There are some limitations that should be considered for the interpretation of results. First, there was a significant heterogeneity of the included studies. Sensitivity analysis based on studies showed our results were robust (data not shown). Subgroup analyses and meta-regression investigated the participants in this study didn’t provide additional evidence. We considered the heterogeneity among the studies mainly coming from two aspects, one is the clinical heterogeneity, such as the age, race and target population, the other is method heterogeneity, such as the different intervention in control groups, different included criteria, treatment duration or dose, and so on. Second, the serum uric acid data we calculated from the included trials were posttreatment values without baseline data. However, the analysis of the changing values in serum uric acid will be more convincing and powerful than a comparison of posttreatment values. Third, many patients were diabetic or dyslipidemia, they received other drugs in addition to fenofibrate or placebo that may have an impact on the serum uric acid levels and the information of drugs’ combined affecting was unavailable. Fourth, due to the insufficient sample size and included cases, and deficiency of long-term trials, there were no serious adverse effect during the treatment, but the long-term impact on the body needs to be further evaluated. Fifth, there were not abundant studies assessed the level of serum uric acid and creatinine after the treatment, so we are not able to do a further study to evaluate whether the fenofibrate effect could be reversed after the withdrawal of the treatment.
Fenofibrate exerts a potent uric acid reduction effect and brings mild nephrotoxicity and adverse events in patients with lipid disorders. There is strong evidence to recommend fenofibrate to these patients. However, our finding also reminds us of careful renal function surveillance during fenofibrate administration. Fenofibrate studies with larger sample size and long-term follow-up are urgently needed.
Acknowledgments
Funding: This work was supported by research project grants from National Natural Science Foundation of China (81600601).
Disclosure
None of the authors have any potential conflicts of interest associated with this research.
References
- 1 Bardin T, Richette P (2017) Impact of comorbidities on gout and hyperuricaemia: an update on prevalence and treatment options. BMC Med 15: 123.
- 2 Lytvyn Y, Perkins BA, Cherney DZ (2015) Uric acid as a biomarker and a therapeutic target in diabetes. Can J Diabetes 39: 239–246.
- 3 Maiuolo J, Oppedisano F, Gratteri S, Muscoli C, Mollace V (2016) Regulation of uric acid metabolism and excretion. Int J Cardiol 213: 8–14.
- 4 Inagaki T, Dutchak P, Zhao G, Ding X, Gautron L, et al. (2007) Endocrine regulation of the fasting response by PPARalpha-mediated induction of fibroblast growth factor 21. Cell Metab 5: 415–425.
- 5 Filippatos TD (2012) A review of time courses and predictors of lipid changes with fenofibric acid-statin combination. Cardiovasc Drugs Ther 26: 245–255.
- 6 Kostapanos MS, Florentin M, Elisaf MS (2013) Fenofibrate and the kidney: an overview. Eur J Clin Invest 43: 522–531.
- 7 Keech A, Simes RJ, Barter P, Best J, Scott R, et al. (2005) Effects of long-term fenofibrate therapy on cardiovascular events in 9795 people with type 2 diabetes mellitus (the FIELD study): randomised controlled trial. Lancet 366: 1849–1861.
- 8 ACCORD Study Group, ACCORD Eye Study Group, Chew EY, Ambrosius WT, Davis MD, et al. (2010) Effects of medical therapies on retinopathy progression in type 2 diabetes. N Engl J Med 363: 233–244.
- 9 Bastow MD, Durrington PN, Ishola M (1988) Hypertriglyceridemia and hyperuricemia: effects of two fibric acid derivatives (bezafibrate and fenofibrate) in a double-blind, placebo-controlled trial. Metabolism 37: 217–220.
- 10 Ledwith BJ, Pauley CJ, Wagner LK, Rokos CL, Alberts DW, et al. (1997) Induction of cyclooxygenase-2 expression by peroxisome proliferators and non-tetradecanoylphorbol 12,13-myristate-type tumor promoters in immortalized mouse liver cells. J Biol Chem 272: 3707–3714.
- 11 Waldman B, Ansquer JC, Sullivan DR, Jenkins AJ, McGill N, et al. (2018) Effect of fenofibrate on uric acid and gout in type 2 diabetes: a post-hoc analysis of the randomised, controlled FIELD study. Lancet Diabetes Endocrinol 6: 310–318.
- 12 Rossner S, Oro L (1981) Fenofibrate therapy of hyperlipoproteinaemia. A dose-response study and a comparison with clofibrate. Atherosclerosis 38: 273–282.
- 13 Mychaleckyj JC, Craven T, Nayak U, Buse J, Crouse JR, et al. (2012) Reversibility of fenofibrate therapy-induced renal function impairment in ACCORD type 2 diabetic participants. Diabetes Care 35: 1008–1014.
- 14 Khanna D, Fitzgerald JD, Khanna PP, Bae S, Singh MK, et al. (2012) 2012 American College of Rheumatology guidelines for management of gout. Part 1: systematic nonpharmacologic and pharmacologic therapeutic approaches to hyperuricemia. Arthritis Care Res (Hoboken) 64: 1431–1446.
- 15 Richette P, Doherty M, Pascual E, Barskova V, Becce F, et al. (2017) 2016 updated EULAR evidence-based recommendations for the management of gout. Ann Rheum Dis 76: 29–42.
- 16 Derosa G, Maffioli P, Sahebkar A (2015) Plasma uric acid concentrations are reduced by fenofibrate: A systematic review and meta-analysis of randomized placebo-controlled trials. Pharmacol Res 102: 63–70.
- 17 Moher D, Liberati A, Tetzlaff J, Altman DG, PRISMA Group (2009) Preferred reporting items for systematic reviews and meta-analyses: the PRISMA statement. PLoS Med 6: e1000097.
- 18 Jadad AR, Moore RA, Carroll D, Jenkinson C, Reynolds DJ, et al. (1996) Assessing the quality of reports of randomized clinical trials : is blinding necessary? Control Clin Trials 17: 1–12.
- 19 Dersimonian R, Nan L (1986) Meta-analysis in clinical trials. Control Clin Trials 7: 177–188.
- 20 Higgins JP, Thompson SG (2002) Quantifying heterogeneity in a meta-analysis. Stat Med 21: 1539–1558.
- 21 Egger M, Smith GD, Schneider M, Minder C (1997) Bias in meta-analysis detected by a simple, graphical test. BMJ 315: 629–634.
- 22 Oikawa S, Yamashita S, Nakaya N, Sasaki J, Kono S, et al. (2017) Efficacy and safety of long-term coadministration of fenofibrate and ezetimibe in patients with combined hyperlipidemia: results of the EFECTL study. J Atheroscler Thromb 24: 77–94.
- 23 Krysiak R, Gilowski W, Okopien B (2015) The effect of testosterone and fenofibrate, administered alone or in combination, on cardiometabolic risk factors in men with late-onset hypogonadism and atherogenic dyslipidemia. Cardiovasc Ther 33: 270–274.
- 24 Ansquer JC, Dalton RN, Caussé E, Crimet D, Le Malicot K, et al. (2008) Effect of fenofibrate on kidney function: a 6-week randomized crossover trial in healthy people. Am J Kidney Dis 51: 904–913.
- 25 Filippatos TD, Kiortsis DN, Liberopoulos EN, Georgoula M, Mikhailidis DP, et al. (2005) Effect of orlistat, micronised fenofibrate and their combination on metabolic parameters in overweight and obese patients with the metabolic syndrome: the FenOrli study. Curr Med Res Opin 21: 1997–2006.
- 26 Kazumi T, Hirano T, Yoshino G, For The Fenofibrate Study G (2003) Effects of fenofibrate on albuminuria in patients with hypertriglyceridemia and/or hyperuricemia: a multicenter, randomized, double-blind, placebo-controlled, crossover study. Curr Ther Res Clin Exp 64: 434–446.
- 27 Sasaki J, Yamamoto K, Ageta M (2002) Effects of fenofibrate on high-density lipoprotein particle size in patients with hyperlipidemia: a randomized, double-blind, placebo-controlled, multicenter, crossover study. Clin Ther 24: 1614–1626.
- 28 Playford DA, Watts GF, Best JD, Burke V (2002) Effect of fenofibrate on brachial artery flow-mediated dilatation in type 2 diabetes mellitus. Am J Cardiol 90: 1254–1257.
- 29 de la Serna G, Cadarso C (1999) Fenofibrate decreases plasma fibrinogen, improves lipid profile, and reduces uricemia. Clin Pharmacol Ther 66: 166–172.
- 30 Uetake D, Ohno I, Ichida K, Yamaguchi Y, Saikawa H, et al. (2010) Effect of fenofibrate on uric acid metabolism and urate transporter 1. Intern Med 49: 89–94.
- 31 Daskalopoulou SS, Tzovaras V, Mikhailidis DP, Elisaf M (2005) Effect on serum uric acid levels of drugs prescribed for indications other than treating hyperuricaemia. Curr Pharm Des 11: 4161–4175.
- 32 Yamamoto T, Moriwaki Y, Takahashi S, Tsutsumi Z, Hada T (2001) Effect of fenofibrate on plasma concentration and urinary excretion of purine bases and oxypurinol. J Rheumatol 28: 2294–2297.
- 33 Lee YH, Lee CH, Lee J (2006) Effect of fenofibrate in combination with urate lowering agents in patients with gout. Korean J Intern Med 21: 89–93.
- 34 Mcquade CR, Griego J, Anderson J, Pai AB (2008) Elevated serum creatinine levels associated with fenofibrate therapy. Am J Health Syst Pharm 65: 138–141.
- 35 Hottelart C, El Esper N, Rose F, Achard JM, Fournier A (2002) Fenofibrate increases creatininemia by increasing metabolic production of creatinine. Nephron 92: 536–541.
- 36 Forsblom C, Hiukka A, Leinonen ES, Sundvall J, Groop PH, et al. (2010) Effects of long-term fenofibrate treatment on markers of renal function in type 2 diabetes: the FIELD Helsinki substudy. Diabetes care 33: 215–220.
- 37 Yaribeygi H, Mohammadi MT, Rezaee R, Sahebkar A (2018) Fenofibrate improves renal function by amelioration of NOX-4, IL-18, and p53 expression in an experimental model of diabetic nephropathy. J Cell Biochem 119: 7458–7469.


