Abstract
We did a systematic review and meta-analysis, aiming to examine the association of available polymorphisms in the receptor for advanced glycation end products (AGER) gene with the risk of type 2 diabetes. Literature search, eligibility assessment, and data extraction were independently performed by two authors. Risk was expressed as by odds ratio (OR) and 95% confidence interval (CI) under the random-effects model. A total of 26 publications, involving 29 independent studies (8,318 patients with type 2 diabetes and 5,589 healthy or orthoglycemic controls) were included in this meta-analysis. Six polymorphisms in AGER gene, rs2070600, rs1800624, rs1800625, rs184003, rs3134940, and rs55640627, were eligible for inclusion. Overall analyses indicated that the mutations of rs1800624 (–374A) and rs55640627 (2245A) were associated with a significantly increased risk of type 2 diabetes (OR = 1.17 and 1.55, 95% CI: 1.00 to 1.38 and 1.21 to 1.98, respectively). Subsidiary analyses revealed that the mutation of rs2070600 was associated with 2.13-folded increased risk of type 2 diabetes in Caucasians (95% CI: 1.28 to 3.55), and the mutation of rs1800624 was associated with 1.57-folded increased risk in South Asians (95% CI: 1.09 to 2.25), with no evidence of heterogeneity (I2: 42.5% and 44.5%). There were low probabilities of publication bias for all studied polymorphisms. Taken together, our findings indicate an ethnicity-dependent contribution of AGER gene in the pathogenesis of type 2 diabetes, that is, rs2070600 was a susceptibility locus in Caucasians, yet rs1800624 in South Asians.
AS AN ENDOCRINOLOGICAL DISORDER, diabetes mellitus occurs due to either the pancreas not producing enough insulin, or the body does not respond appropriately to insulin [1]. The prevalence of type 2 diabetes, the most common type of diabetes mellitus, is increasing globally at an alarming rate, and it has reached epidemic proportions [2, 3]. There is a familial clustering of type 2 diabetes, implicating the existence of genetic components in the regulation of blood sugar [4, 5]. Although type 2 diabetes can be largely preventable [6], a comprehensive understanding of its etiology and risk profiles is still necessary.
A long list of genes and polymorphisms have been identified in significant association with type 2 diabetes risk, especially after the appearance of genome-wide scanning techniques [7-10]. Although much efforts have been made to decipher the genetic underpinnings of type 2 diabetes, no definitive consensus has been reached on how many genes and which genetic defects are actually involved in its development [11]. As such, candidate gene approach [12] still represents a useful technique when analyzing genes that have specific physiological or cellular function.
The gene encoding the receptor for advanced glycation end products (AGER) is a promising candidate in the pathogenesis of type 2 diabetes [13, 14]. Experimental and animal studies indicated that AGER signaling plays an important role in regulating oxidative stress and endothelial dysfunction in type 2 diabetes, and abnormally high AGER expression was observed in animal models of diabetes [15-17]. AGER gene is mapped on 6p21.32, and the genomic sequence of this gene is polymorphic. Some polymorphisms in AGER gene have been widely evaluated in association with type 2 diabetes and its complications. For example, Kankova et al. found that the mutation (82Ser) of exonic polymorphism rs2070600 was associated with a significantly increased risk of type 2 diabetes [18], whereas others failed to support this claim [19-21]. The reasons for this non-reproducibility is multiple, possibly involving differences in genetic backgrounds, statistical power, and genotyping methods.
To shed some light on this issue, we did a systematic review and meta-analysis to examine the association of available polymorphisms in AGER gene with the risk of type 2 diabetes.
Methods
This systematic review and meta-analysis is ascribed to the pooled analysis of genetic data between patients with type 2 diabetes and controls, and so its implementation met the guidelines in the Preferred Reporting Items for Systematic Reviews and Meta-analyses (PRISMA) statement [22]. The PRISMA checklist is formulated in Supplementary Table 1.
Search strategy
Public databases including PubMed, EMBASE, Web of Science, and Google Scholar were searched on February 1, 2021 by Hao Cheng and Wenbin Zhu, independently, using the same predefined subject terms: “diabetes” or “diabetic” or “T2D*” in the Title, combined with “receptor for advanced glycation end*” or “RAGE” or “AGER” or “advanced glycosylation end” in the Abstract, along with “polymorphism*” or “SNP*” or “variant*” or “mutation*” or “variation*” in the Abstract. To avoid missing hits, additional search was done in the reference lists of retrieved publications. The consistency in the number of finally retrieved publications was checked, and a 100% consensus was reached.
Eligibility criteria
Publications were deemed eligible for inclusion in this meta-analysis if data on the genotype or allele distributions of any polymorphism in AGER gene were available between patients with clinically diagnosed type 2 diabetes and controls, and genotypes were determined using validated methods. Due to our incapability to reviewing journals in languages other than the English and Chinese languages, to avoid selection bias, only publications written in the English language were retrieved and assessed.
Eligibility assessment was performed by two authors (Hao Cheng and Wenbin Zhu), and any disagreement was discussed and adjudicated by a third author (Chunjing Zhang) if necessary, until coming to an agreement.
Data extraction
To extract data of interest from eligible publications, EpiData software version 3.1 was employed to set up the database. Extracted data included the surname of first author, year of publication, race or ethnicity of study subjects, location of enrolling subjects, diagnosis of type 2 diabetes, source of study subjects, health status of controls, genotyping methods, sample size, age, sex composition, cigarette smoking, alcohol consumption, duration of type 2 diabetes, body mass index (BMI), systolic and diastolic blood pressure (SBP and DBP), hypertension, Hemoglobin A1c (HbA1c), fasting plasma glucose (FPG), creatinine, total cholesterol, triglyceride, high- and low-density lipoprotein cholesterol (HDLC and LDLC), and the genotype and allele counts of any polymorphism in AGER gene.
Data extraction process was done by two authors (Hao Cheng and Wenbin Zhu), and any disagreement was settled until a consensus was reached or was adjudicated by a third author (Chunjing Zhang).
Statistical analyses
Analyses on the association of polymorphisms in AGER gene with type 2 diabetes risk were conducted using the Stata software version 14.1 (Stata Corp, College Station, TX). Disease risk is expressed as odds ratio (OR) and 95% confidence interval (CI).
Another important concern is the probability of publication bias in a meta-analysis. This probability was assessed using the Begg’s and filled funnel plots, and the asymmetry of funnel plots was tested using the Egger’s tests.
Additionally, influential analyses were used to inspect the stability of effect-size estimates by excluding a single publication each time and calculating the estimates of the rest publications. Meantime, cumulative analyses were done to assess the impact of the first publication on subsequent publications after sorting the dates of all publications in an ascending order, which can see the evolution of cumulated effect-size estimates over time.
Diversity of included studies was appraised by the inconsistence index (I2), a percentage denoting the magnitude of between-study heterogeneity. Significant heterogeneity is reported if the I2 exceeds 50%. No matter whether heterogeneity is significant or not, the random-effects model was used to derive OR and its 95% CI.
The reasons for statistically significant heterogeneity in a meta-analysis are usually multiple, and explorations on the causes of between-study heterogeneity can be done by using both subsidiary analyses and meta-regression analyses.
Results
Studies and subjects
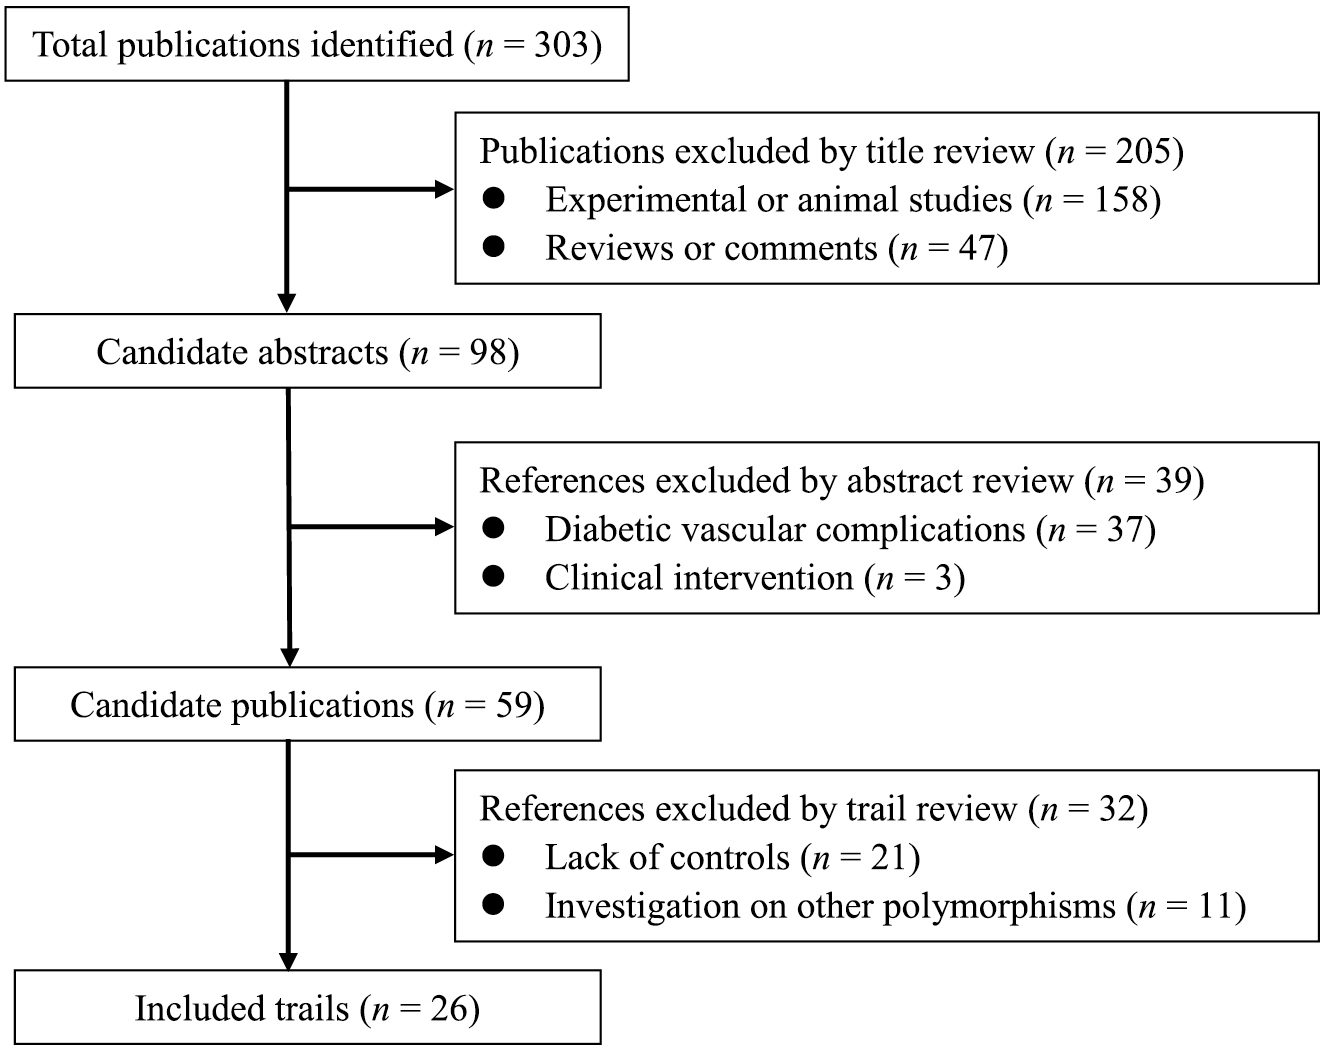
Using pre-specified eligibility criteria, 26 publications [18-21, 23-44], from 303 initially identified publications, were included for this present meta-analysis. The process of publication selection and exclusion with specific reasons is presented in Fig. 1.
As 3 publications involved two independent studies [20, 21, 26], there were a total of 29 independent studies, including 8,318 patients with type 2 diabetes and 5,589 healthy or orthoglycemic controls. The basic characteristics of all qualified studies are shown in Table 1.
Table 1
The baseline characteristics of eligible studies in the current meta-analysis
| First author |
Year |
Ethnicity |
Source |
Control status |
Genotyping method |
Sample size |
Age (years) |
Males (%) |
Smokers (%) |
DM duration (years) |
BMI (kg/m2) |
Hypertensives (%) |
| Cases |
Controls |
Cases |
Controls |
Cases |
Controls |
Cases |
Controls |
Cases |
Controls |
Cases |
Controls |
Cases |
Controls |
| Bala et al. |
2019 |
Indian |
Hospital |
Healthy controls |
PCR-based |
135 |
135 |
44.68 |
43.27 |
0.4444 |
0.5185 |
NA |
NA |
NA |
0 |
NA |
NA |
NA |
NA |
| Zulfiqar et al. |
2018 |
Pakistan |
Hospital |
Healthy controls |
PCR-based |
100 |
50 |
NA |
NA |
NA |
NA |
NA |
NA |
NA |
NA |
NA |
NA |
NA |
NA |
| Yang et al. |
2017 |
Chinese |
Hospital |
Essential hypertensives |
High throughput |
1,252 |
947 |
60.02 |
59.83 |
0.6318 |
0.6663 |
NA |
NA |
NA |
NA |
25.25 |
25.18 |
1.00 |
1.00 |
| Raska et al. |
2017 |
Caucasian |
Hospital |
Healthy controls |
High throughput |
112 |
171 |
65.6 |
64 |
<0.0010 |
<0.0010 |
0.1875 |
0.1287 |
7.1 |
0 |
32.5 |
26.8 |
NA |
NA |
| Wu et al. (Without CP) |
2015 |
Chinese |
Hospital |
Healthy controls |
PCR-based |
58 |
62 |
59.5 |
42.1 |
0.5172 |
0.6452 |
0.2241 |
0.3387 |
NA |
NA |
26.6 |
23.5 |
NA |
NA |
| Wu et al. (With CP) |
2015 |
Chinese |
Hospital |
Patients with chronic periodontitis |
PCR-based |
172 |
202 |
59.2 |
44.7 |
0.5116 |
0.8861 |
0.2791 |
0.4505 |
NA |
NA |
26 |
24.9 |
NA |
NA |
| Haldar et al. |
2015 |
Indian |
Hospital |
Healthy controls |
PCR-based |
145 |
100 |
51 |
63.46 |
0.5655 |
0.2500 |
NA |
NA |
NA |
NA |
18 |
23.4 |
NA |
NA |
| Bansal et al. |
2013 |
Indian |
Hospital |
Healthy controls |
PCR-based |
135 |
171 |
51 |
50 |
0.4741 |
0.5263 |
NA |
NA |
8 |
NA |
25 |
24 |
NA |
NA |
| Bansal et al. |
2013 |
Indian |
Hospital |
Healthy controls |
PCR-based |
130 |
171 |
56 |
50 |
0.5308 |
0.5263 |
NA |
NA |
9 |
NA |
26.3 |
24 |
NA |
NA |
| Ng et al. (DRCP) |
2012 |
Mixed |
Hospital |
Healthy controls |
PCR-based |
171 |
235 |
59.2 |
55.2 |
0.5848 |
0.8426 |
0.1696 |
0.1830 |
10.4 |
NA |
27.2 |
25.6 |
0.7836 |
0.0468 |
| Ng et al. (BJO) |
2012 |
Mixed |
Hospital |
Healthy controls |
PCR-based |
171 |
235 |
59.2 |
55.2 |
0.5848 |
0.8426 |
0.1696 |
0.1830 |
10.4 |
NA |
27.2 |
25.6 |
0.7836 |
0.0468 |
| Kucukhuseyin et al. |
2012 |
Turkish |
Hospital |
Healthy controls |
PCR-based |
52 |
55 |
58.42 |
57.96 |
0.2115 |
0.4909 |
0.7115 |
0.1273 |
NA |
NA |
25.81 |
25.52 |
0.2885 |
<0.0010 |
| Prasad et al. |
2010 |
Indian |
Hospital |
Healthy controls |
PCR-based |
225 |
196 |
60.6 |
57 |
0.3378 |
0.3316 |
NA |
NA |
17.07 |
10.4 |
NA |
NA |
NA |
NA |
| Zhang H et al. |
2009 |
Chinese |
Population |
Healthy controls |
PCR-based |
340 |
182 |
58.1 |
45.8 |
0.5610 |
0.5210 |
NA |
NA |
6.67 |
NA |
24.77 |
24.34 |
NA |
NA |
| Kucukhuseyin et al. |
2009 |
Turkish |
Hospital |
CAD patients |
PCR-based |
62 |
53 |
61.42 |
57.96 |
0.4194 |
0.5094 |
0.3871 |
0.1321 |
NA |
NA |
27.48 |
25.52 |
0.6290 |
<0.0010 |
| Goulart et al. (While) |
2008 |
Caucasian |
Population |
Healthy controls |
PCR-based |
481 |
496 |
60 |
51 |
0.5820 |
0.4400 |
0.1300 |
0.1670 |
NA |
NA |
33.1 |
25.4 |
NA |
NA |
| Goulart et al. (AA) |
2008 |
African-Americans |
Population |
Healthy controls |
PCR-based |
156 |
100 |
54.5 |
48.5 |
0.3720 |
0.5300 |
0.2560 |
0.4400 |
NA |
NA |
33.3 |
26.9 |
NA |
NA |
| Ramprasad et al. |
2007 |
Indian |
Hospital |
Healthy controls |
PCR-based |
189 |
149 |
63 |
59 |
0.6900 |
0.5200 |
NA |
NA |
21 |
NA |
NA |
NA |
NA |
NA |
| Naka et al. |
2006 |
Mixed |
Hospital |
Healthy controls |
PCR-based |
147 |
82 |
55.1 |
58.2 |
0.5155 |
0.8636 |
NA |
NA |
NA |
NA |
NA |
NA |
NA |
NA |
| Lindholm et al. |
2006 |
Caucasian |
Hospital |
Healthy controls |
PCR-based |
2,453 |
205 |
61.25 |
NA |
0.2682 |
NA |
0.0978 |
NA |
6.4 |
NA |
29.55 |
NA |
NA |
NA |
| Yoshioka et al. |
2005 |
Japanese |
Hospital |
Healthy controls |
PCR-based |
189 |
98 |
62 |
58.1 |
0.6561 |
0.6429 |
NA |
NA |
13.7 |
NA |
23.2 |
23.2 |
NA |
NA |
| Kankova et al. |
2005 |
Caucasian |
Population |
Healthy controls |
PCR-based |
179 |
228 |
63.1 |
59.1 |
NA |
NA |
NA |
NA |
5.5 |
NA |
NA |
NA |
0.6310 |
0.3860 |
| Xu et al. |
2003 |
Chinese |
Hospital |
Healthy controls |
PCR-based |
152 |
212 |
NA |
NA |
NA |
NA |
NA |
NA |
NA |
NA |
NA |
NA |
NA |
NA |
| Katerina et al. |
2002 |
Caucasian |
Hospital |
Healthy controls |
PCR-based |
212 |
244 |
63.4 |
60.3 |
0.4906 |
0.3648 |
NA |
NA |
NA |
NA |
NA |
NA |
NA |
NA |
| Kankova et al. |
2001 |
Caucasian |
Hospital |
Healthy controls |
PCR-based |
171 |
159 |
NA |
NA |
NA |
NA |
NA |
NA |
NA |
NA |
NA |
NA |
NA |
NA |
| Hudson et al. |
2001 |
Caucasian |
Hospital |
Healthy controls |
PCR-based |
109 |
113 |
NA |
NA |
NA |
NA |
NA |
NA |
NA |
NA |
NA |
NA |
NA |
NA |
| Pulkkinen et al. |
2000 |
Caucasian |
Hospital |
Healthy controls |
PCR-based |
206 |
82 |
64 |
54 |
0.6845 |
NA |
NA |
NA |
NA |
NA |
NA |
NA |
NA |
NA |
| Liu et al. |
1999 |
Chinese |
Hospital |
Healthy controls |
PCR-based |
156 |
104 |
59.2 |
52.8 |
0.5641 |
0.6731 |
NA |
NA |
NA |
NA |
NA |
NA |
NA |
NA |
| Hudson et al. |
1998 |
Mixed |
Hospital |
Healthy controls |
PCR-based |
258 |
352 |
62.6 |
51.4 |
NA |
NA |
NA |
NA |
NA |
NA |
NA |
NA |
NA |
NA |
| SBP (mmHg) |
DBP (mmHg) |
HbA1c (%) |
FPG (mmol/L) |
Creatinine (μmoI/L) |
TC (mg/dL) |
TG (mg/dL) |
HDLC (mg/dL) |
LDLC (mg/dL) |
| Cases |
Controls |
Cases |
Controls |
Cases |
Controls |
Cases |
Controls |
Cases |
Controls |
Cases |
Controls |
Cases |
Controls |
Cases |
Controls |
Cases |
Controls |
| NA |
NA |
NA |
NA |
NA |
NA |
NA |
NA |
NA |
NA |
NA |
NA |
NA |
NA |
NA |
NA |
NA |
NA |
| NA |
NA |
NA |
NA |
NA |
NA |
NA |
NA |
NA |
NA |
NA |
NA |
NA |
NA |
NA |
NA |
NA |
NA |
| 135.26 |
134.86 |
86.52 |
86.98 |
NA |
NA |
7.8 |
5.5 |
89 |
87 |
148.49 |
145.79 |
226.68 |
225.79 |
56.84 |
64.19 |
93.97 |
91.65 |
| NA |
NA |
NA |
NA |
52.9 |
37.8 |
7.2 |
5.1 |
70.5 |
70.4 |
NA |
NA |
NA |
NA |
NA |
NA |
NA |
NA |
| NA |
NA |
NA |
NA |
8.1 |
5.6 |
8.8 |
5.0 |
NA |
NA |
NA |
NA |
NA |
NA |
NA |
NA |
NA |
NA |
| NA |
NA |
NA |
NA |
8.5 |
5.7 |
8.8 |
5.1 |
NA |
NA |
NA |
NA |
NA |
NA |
NA |
NA |
NA |
NA |
| NA |
NA |
NA |
NA |
9.3 |
10.9 |
8.7 |
4.6 |
NA |
NA |
NA |
NA |
NA |
NA |
NA |
NA |
NA |
NA |
| NA |
NA |
NA |
NA |
7.8 |
5.4 |
8.4 |
4.7 |
NA |
NA |
159 |
148 |
140.00 |
112.00 |
45.00 |
52.00 |
120.00 |
114.00 |
| NA |
NA |
NA |
NA |
9.3 |
5.4 |
9.3 |
4.7 |
NA |
NA |
180 |
148 |
189.00 |
112.00 |
39.00 |
52.00 |
118.00 |
114.00 |
| 136.5 |
124 |
79 |
83 |
7.9 |
5.6 |
NA |
NA |
NA |
NA |
166.5 |
140.6 |
141.76 |
159.48 |
46.39 |
38.66 |
96.65 |
81.19 |
| 136.5 |
124 |
79 |
83 |
7.9 |
5.6 |
NA |
NA |
NA |
NA |
166.5 |
140.6 |
141.76 |
159.48 |
46.39 |
38.66 |
96.65 |
81.19 |
| 127.3 |
123.6 |
79.8 |
76.2 |
NA |
NA |
NA |
NA |
NA |
NA |
220.44 |
192.3 |
145.82 |
145.52 |
44.06 |
36.81 |
133.26 |
134.25 |
| 140 |
150 |
84 |
90 |
7.3 |
7.5 |
NA |
NA |
NA |
NA |
NA |
NA |
NA |
NA |
NA |
NA |
NA |
NA |
| 142.21 |
126.9 |
80 |
80 |
9.28 |
4.94 |
9.4 |
5.0 |
NA |
NA |
191.66 |
182.78 |
150.62 |
141.76 |
NA |
NA |
NA |
NA |
| 135.59 |
123.6 |
85.13 |
76.2 |
NA |
NA |
NA |
NA |
NA |
NA |
196.86 |
192.3 |
158.23 |
145.52 |
41.79 |
43.13 |
117.29 |
134.25 |
| NA |
NA |
NA |
NA |
7.28 |
5.44 |
NA |
NA |
NA |
NA |
NA |
NA |
NA |
NA |
NA |
NA |
NA |
NA |
| NA |
NA |
NA |
NA |
7.6 |
5.56 |
NA |
NA |
NA |
NA |
NA |
NA |
NA |
NA |
NA |
NA |
NA |
NA |
| 133 |
126 |
80 |
77 |
8.1 |
5.8 |
8.6 |
4.8 |
NA |
NA |
184 |
190 |
147.00 |
115.00 |
NA |
NA |
NA |
NA |
| NA |
NA |
NA |
NA |
8.7 |
5.2 |
NA |
NA |
NA |
NA |
NA |
NA |
NA |
NA |
NA |
NA |
NA |
NA |
| 146.35 |
NA |
81.35 |
NA |
6.85 |
NA |
NA |
NA |
84.5 |
NA |
NA |
NA |
NA |
NA |
NA |
NA |
NA |
NA |
| 132 |
121 |
78 |
72 |
7.3 |
5.2 |
NA |
NA |
NA |
NA |
205 |
208 |
130.00 |
134.00 |
57.00 |
57.00 |
NA |
NA |
| NA |
NA |
NA |
NA |
6.25 |
4.67 |
7.0 |
5.0 |
88.36 |
79.56 |
NA |
NA |
NA |
NA |
NA |
NA |
NA |
NA |
| NA |
NA |
NA |
NA |
NA |
NA |
NA |
NA |
NA |
NA |
NA |
NA |
NA |
NA |
NA |
NA |
NA |
NA |
| NA |
NA |
NA |
NA |
NA |
NA |
NA |
NA |
NA |
NA |
NA |
NA |
NA |
NA |
NA |
NA |
NA |
NA |
| NA |
NA |
NA |
NA |
NA |
NA |
NA |
NA |
NA |
NA |
NA |
NA |
NA |
NA |
NA |
NA |
NA |
NA |
| NA |
NA |
NA |
NA |
NA |
NA |
NA |
NA |
NA |
NA |
NA |
NA |
NA |
NA |
NA |
NA |
NA |
NA |
| NA |
NA |
NA |
NA |
NA |
NA |
NA |
NA |
NA |
NA |
NA |
NA |
NA |
NA |
NA |
NA |
NA |
NA |
| NA |
NA |
NA |
NA |
NA |
NA |
NA |
NA |
NA |
NA |
NA |
NA |
NA |
NA |
NA |
NA |
NA |
NA |
| NA |
NA |
NA |
NA |
NA |
NA |
NA |
NA |
NA |
NA |
NA |
NA |
NA |
NA |
NA |
NA |
NA |
NA |
Abbreviations: CP, chronic periodontitis; AA, African-Americans; DRCP, Diabetes Research and Clinical Practice; BJO, British Journal of Ophthalmology; DM, diabetes mellitus; BMI, body mass index; PCR, polymerase chain reaction; SBP, systolic blood pressure; DBP, diastolic blood pressure; HbA1c, Hemoglobin A1c; FPG, fasting plasma glucose; TC, total cholesterol; TG, triglyceride; HDLC, high-density lipoprotein cholesterol; LDLC, low-density lipoprotein cholesterol; NA, not available.
Polymorphisms in AGER gene
A polymorphism in AGER gene was recorded if 3 or more studies had examined the association of this polymorphism with type 2 diabetes. In total, six polymorphisms in AGER gene were recorded in this meta-analysis, including rs2070600 (Gly82Ser in exon 3), rs1800624 (T–374A in the promoter), rs1800625 (T-429C in the promoter), rs184003 (G1704T in intron 7), rs3134940 (A2184G in intron 9), and rs55640627 (G2245A in intron 9), and they were separately examined by 19, 11, 12, 7, 4, and 3 studies. The genomic distributions of six studied polymorphisms in AGER gene are displayed in Fig. 2, and their genotype distributions are presented in Supplementary Table 2.
Overall association analyses
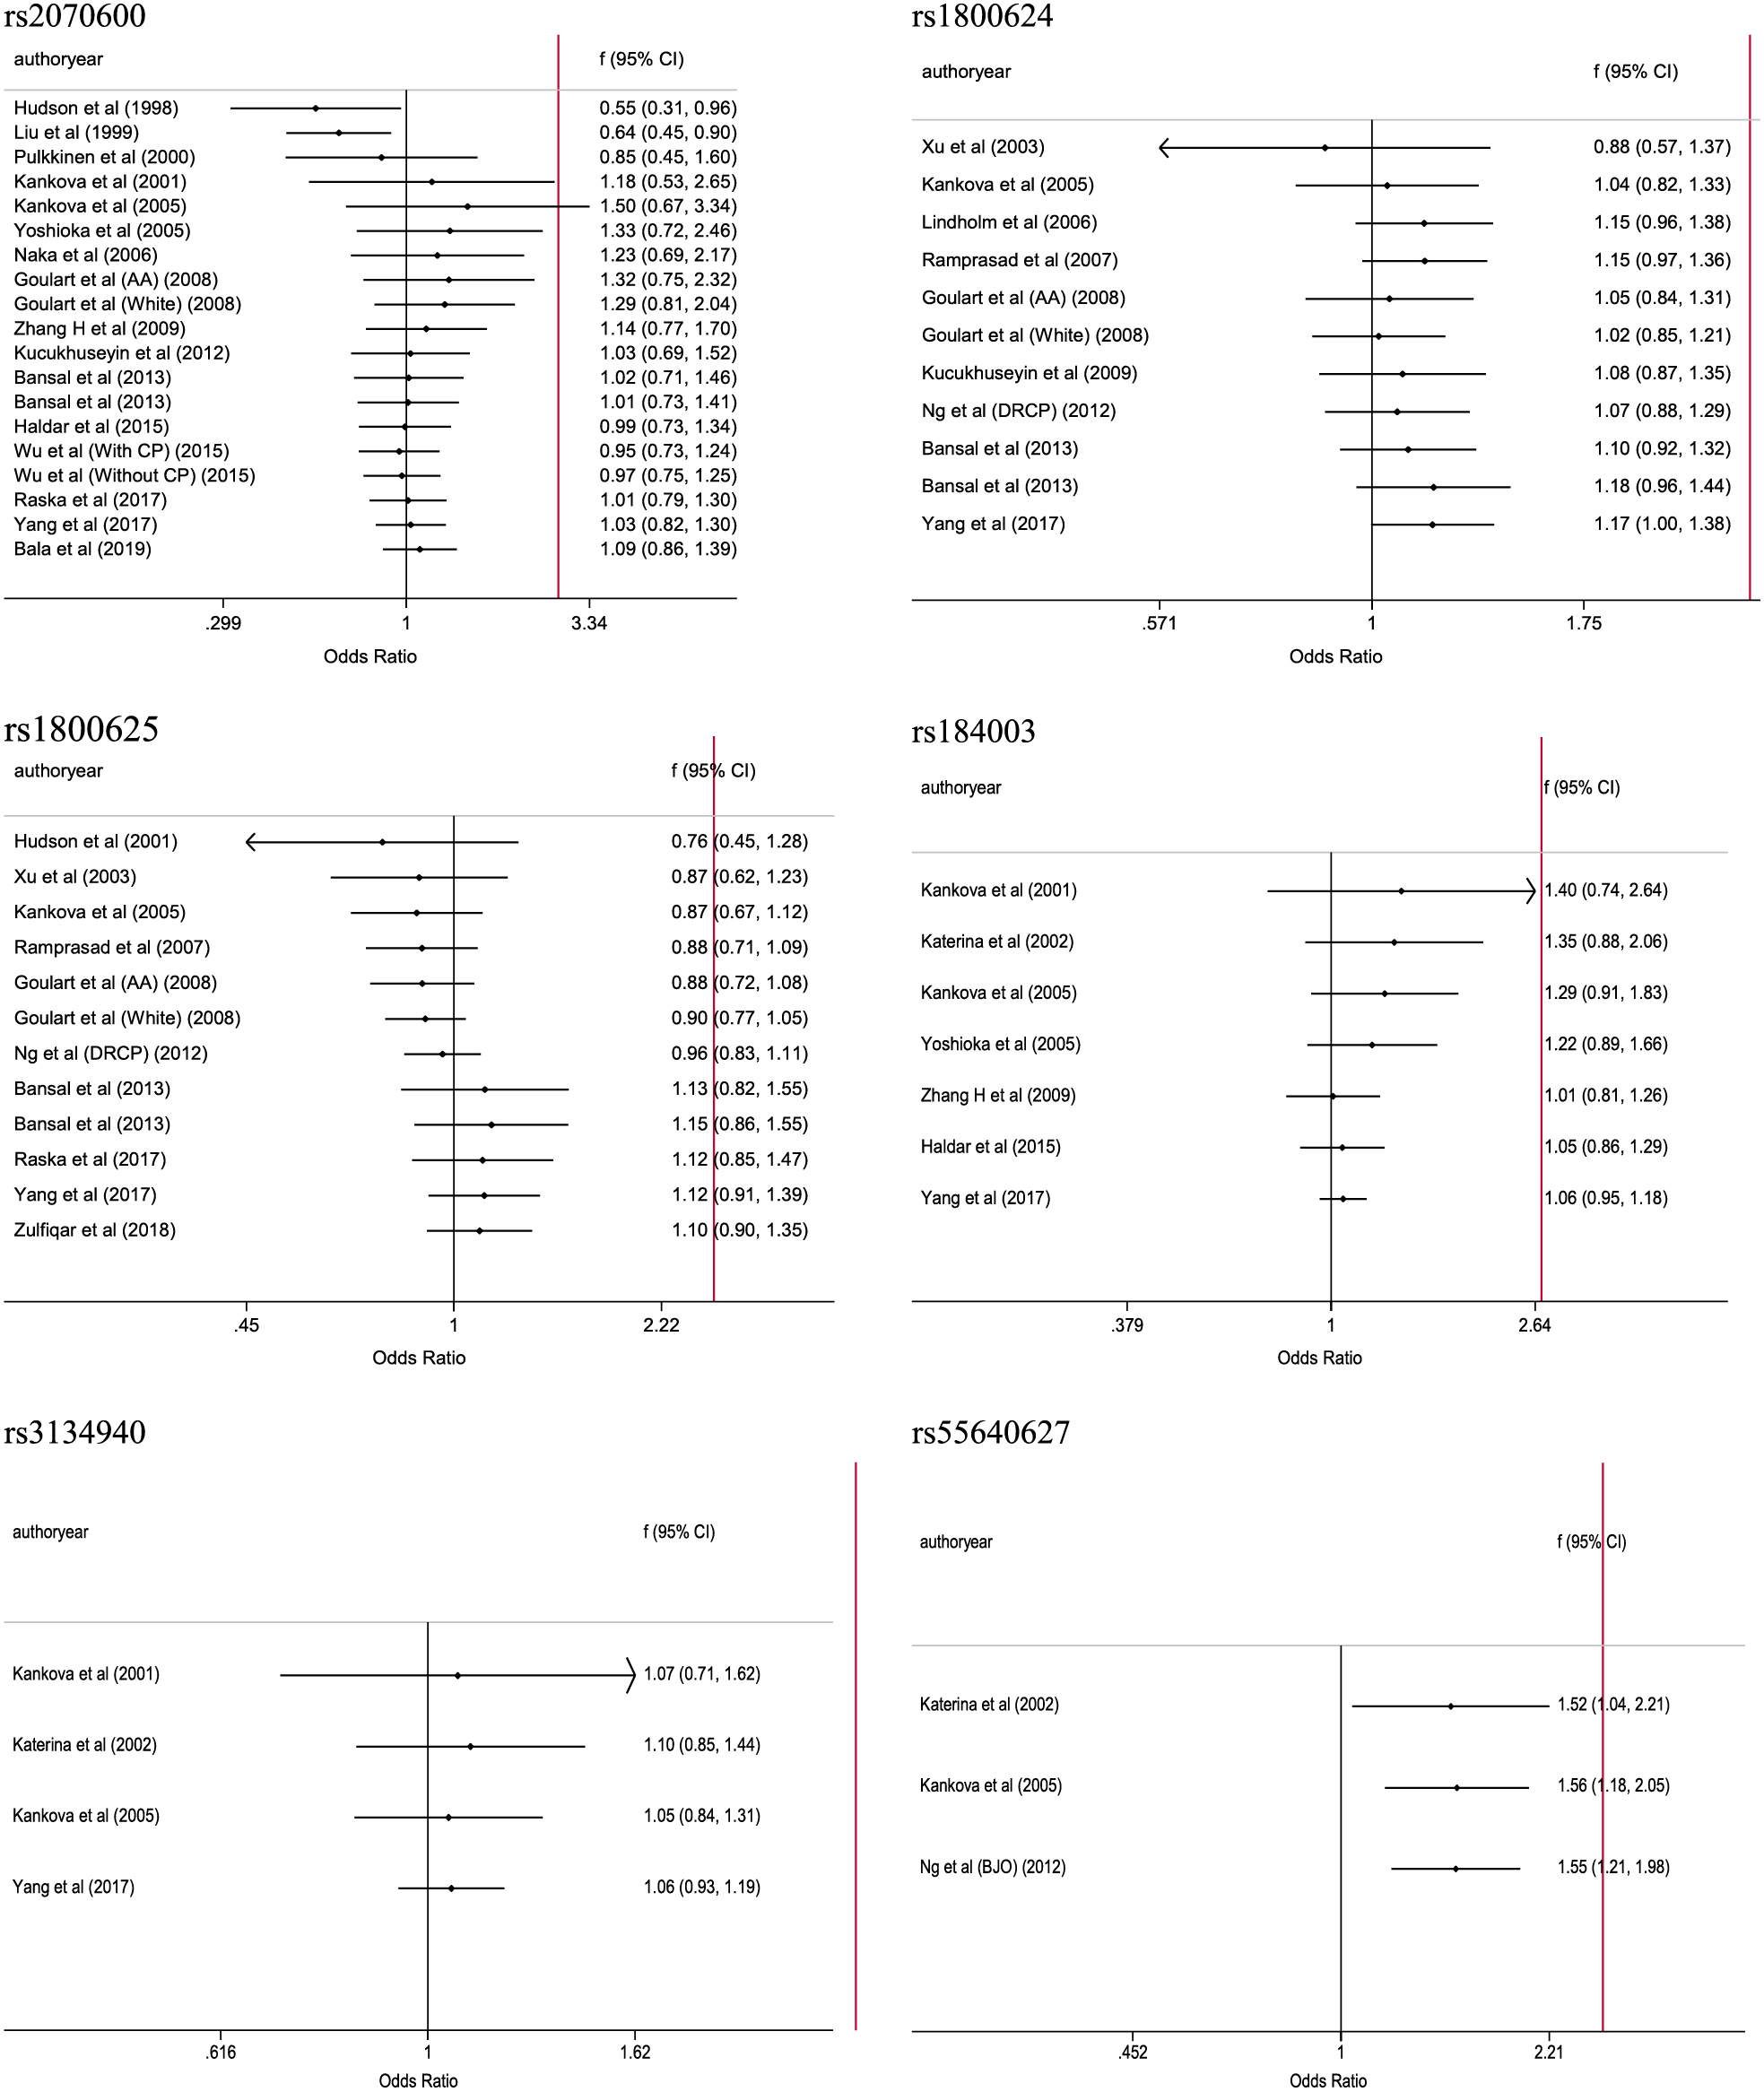
Fig. 3 shows six forest plots illustrating the overall association of 6 studied polymorphisms in AGER gene with the risk of type 2 diabetes. Pooling the results of all eligible studies, the mutations of rs1800624 (–374A) and rs55640627 (2245A) were associated with a significantly increased risk of type 2 diabetes (OR = 1.17 and 1.55, 95% CI: 1.00 to 1.38 and 1.21 to 1.98, respectively), and no hits of significance were noticed for the other four polymorphisms.
There was strong evidence of heterogeneity for rs2070600, rs1800624, and rs1800625 (I2: 73.2%, 63.5%, and 72.2%, respectively).
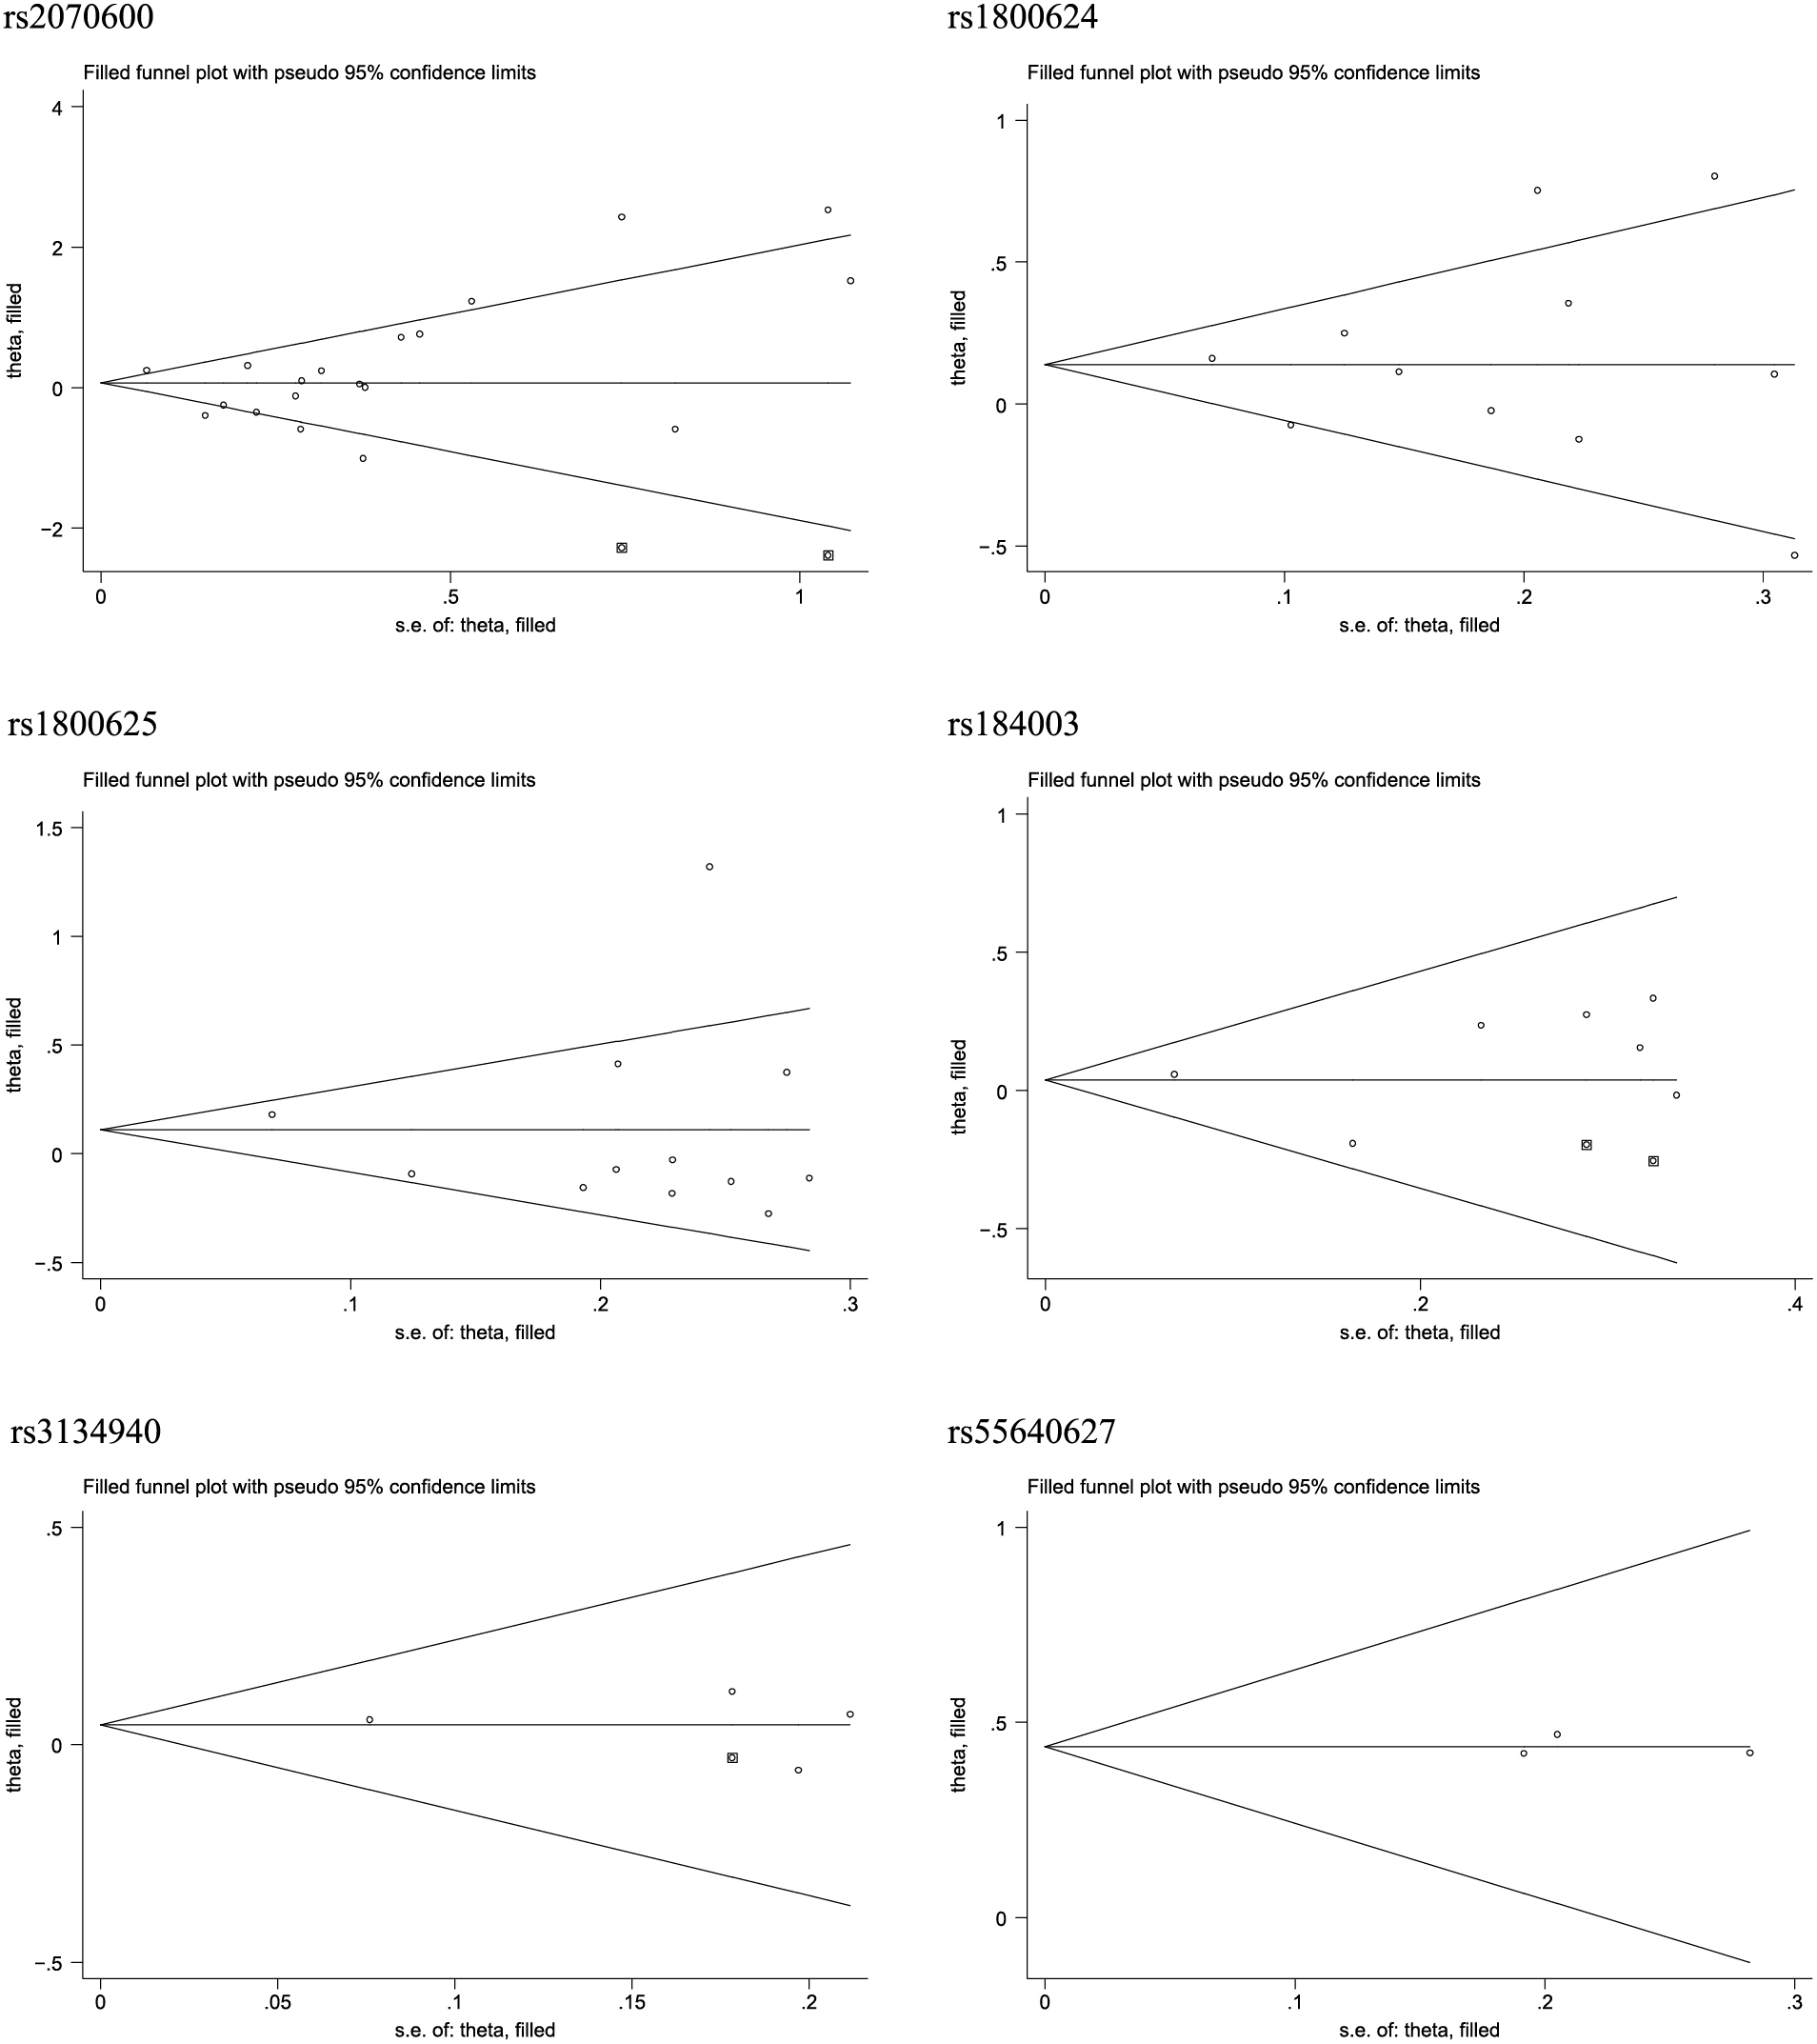
Publication bias
In this meta-analysis, the probabilities of publication bias were appraised from three aspects, viz. Begg’s funnel plots (Supplementary Fig. 1), filled funnel plots (Fig. 4), and Egger’s tests. For six studied polymorphisms in AGER gene, the Begg’s funnel plots seemed symmetrical, and the filled funnel plots revealed that there were an estimated 2 studies, 2 studies, and 1 study that were theoretically missing for rs2070600, rs184003, and rs3134940, respectively. As reflected by the Egger’s tests, the probabilities were 0.787, 0.739, 0.839, 0.513, 0.840, and 0.874 for rs2070600, rs1800624, rs1800625, rs184003, rs3134940, and rs55640627, respectively.
Influential analyses
The impact of any individual publication on overall effect-size estimates of the association between six studied polymorphisms in AGER gene and type 2 diabetes was not significant, as depicted in Supplementary Fig. 2.
Cumulative analyses
There was no evidence on the significant contribution of the first publication on subsequent publications for six studied polymorphisms in AGER gene (Supplementary Fig. 3).
Subsidiary analyses
In light of statistically significant heterogeneity for the majority of studied polymorphisms in AGER gene associated with type 2 diabetes, a panel of subsidiary analyses were performed to seek possible causes of between-study heterogeneity (Table 2). Due to the limited number of qualified studies for rs3134940 and rs55640627, subsidiary analyses were only conducted for the rest 4 polymorphisms in AGER gene in this meta-analysis, and the results were only listed for subgroups involving more than one study.
Table 2
Subsidiary analyses of genetic polymorphisms in
AGER gene associated with type 2 diabetes
| Subgroups |
Studies (n) |
OR |
95% CI |
I2 |
phet |
Studies (n) |
OR |
95% CI |
I2 |
phet |
| Polymorphisms |
rs2070600 (Gly82Ser) |
rs184003 (G1704T) |
| Ethnicity |
| Caucasian |
5 |
2.13 |
1.28–3.55 |
42.5% |
0.138 |
3 |
1.29 |
0.91–1.83 |
0.0% |
0.922 |
| East Asian |
6 |
0.92 |
0.86–1.39 |
79.3% |
<0.001 |
3 |
1.02 |
0.90–1.15 |
0.1% |
0.368 |
| South Asian |
4 |
1.42 |
0.67–3.03 |
72.8% |
0.012 |
NA |
| Mixed |
3 |
0.81 |
0.29–2.28 |
46.3% |
0.155 |
NA |
| Subject source |
| Hospital |
15 |
1.05 |
0.80–1.38 |
71.1% |
<0.001 |
5 |
1.09 |
0.97–1.23 |
0.0% |
0.799 |
| Population |
4 |
1.44 |
0.69–2.99 |
81.8% |
0.001 |
2 |
0.89 |
0.67–1.18 |
0.0% |
0.333 |
| Control status |
| Healthy controls |
17 |
1.15 |
0.85–1.57 |
70.5% |
<0.001 |
6 |
1.05 |
0.86–1.29 |
0.0% |
0.506 |
| Orthoglycemic controls |
2 |
1.03 |
0.64–1.65 |
85.4% |
0.009 |
NA |
| Genotyping method |
| High throughput |
2 |
1.33 |
1.02–1.76 |
15.6% |
0.276 |
NA |
| PCR-based |
16 |
1.06 |
0.80–1.40 |
68.9% |
<0.001 |
6 |
1.05 |
0.86–1.29 |
0.0% |
0.506 |
| Sample size |
| <320 |
12 |
1.14 |
0.79–1.65 |
62.9% |
0.002 |
2 |
1.17 |
0.80–1.70 |
0.0% |
0.541 |
| ≥320 |
7 |
1.07 |
0.74–1.55 |
83.7% |
<0.001 |
5 |
1.05 |
0.93–1.18 |
0.0% |
0.454 |
| Polymorphisms |
rs1800624 (T–374A) |
rs1800625 (T-429C) |
| Ethnicity |
| Caucasian |
3 |
1.09 |
0.89–1.33 |
51.0% |
0.130 |
4 |
0.87 |
0.73–1.04 |
0.0% |
0.931 |
| East Asian |
2 |
1.10 |
0.87–1.39 |
33.0% |
0.222 |
2 |
1.18 |
1.03–1.34 |
0.0% |
0.382 |
| South Asian |
3 |
1.57 |
1.09–2.25 |
44.5% |
0.165 |
3 |
1.71 |
0.74–3.97 |
89.6% |
<0.001 |
| Mixed |
2 |
0.81 |
0.50–1.31 |
48.7% |
0.163 |
2 |
1.20 |
0.72–2.00 |
55.0% |
0.136 |
| Subject source |
| Hospital |
8 |
1.30 |
1.08–1.56 |
57.2% |
0.022 |
9 |
1.19 |
0.92–1.55 |
75.7% |
<0.001 |
| Population |
3 |
0.94 |
0.73–1.20 |
44.9% |
0.163 |
3 |
0.90 |
0.74–1.09 |
0.0% |
0.964 |
| Control status |
| Healthy |
9 |
1.12 |
0.92–1.36 |
62.3% |
0.007 |
11 |
1.09 |
0.85–1.41 |
73.6% |
<0.001 |
| Orthoglycemic controls |
2 |
1.53 |
0.83–2.83 |
79.7% |
0.026 |
NA |
| Genotyping method |
| High throughput |
NA |
2 |
1.07 |
0.76–1.48 |
56.7% |
0.129 |
| PCR-based |
10 |
1.18 |
0.96–1.44 |
67.0% |
0.001 |
10 |
1.13 |
0.86–1.48 |
75.4% |
<0.001 |
| Sample size |
| <320 |
4 |
1.45 |
0.86–2.45 |
78.2% |
0.003 |
6 |
1.18 |
0.71–1.96 |
83.5% |
<0.001 |
| ≥320 |
7 |
1.10 |
0.99–1.21 |
7.8% |
0.369 |
6 |
1.06 |
0.90–1.24 |
42.7% |
0.120 |
Abbreviations: OR, odds ratio; 95% CI, 95% confidence interval; I2, inconsistence index; Phet, p value for heterogeneity test.
For rs2070600, the mutation of this polymorphism was associated with 2.13-folded increased risk of type 2 diabetes in Caucasians (95% CI: 1.28 to 3.55), and between-study heterogeneity was nonsignificant (I2: 42.5%). By contrast, the mutation of rs1800624 was associated with 1.57-folded increased risk in South Asians (95% CI: 1.09 to 2.25), with no evidence of heterogeneity (I2: 44.5%), and significance was also observed in studies with subjects enrolled from hospitals (OR = 1.30, 95% CI: 1.08 to 1.56), yet with marginal significance of heterogeneity (I2: 57.2%). No significance was identified for the other subgroups in this meta-analysis.
Meta-regression analyses
To further seek other causes of between-study heterogeneity, meta-regression analyses were undertaken by modeling averaged age and BMI, male composition, the percentages of smokers and hypertensives, and duration of type 2 diabetes, as well as the mean concentrations of HbA1c, creatinine, total cholesterol, triglyceride, HDLC, LDLC, when available. Due to the limited power of meta-regression analyses, we failed to find any significant contributions of above factors to the association of six studied polymorphisms in AGER gene with the risk of type 2 diabetes (all p > 0.05).
Discussion
The aim of this systematic review and meta-analysis was to examine the association between eligible polymorphisms in AGER gene and type 2 diabetes risk. The key finding was an ethnicity-dependent contribution of AGER gene in the pathogenesis of type 2 diabetes, that is, rs2070600 was a susceptibility locus in Caucasians, yet rs1800624 in South Asians. Besides ethnicity, source of study subjects was identified as another possible cause of significant heterogeneity. To the best of our knowledge, this is thus far the largest systematic review and meta-analysis that has evaluated the association between AGER genetic polymorphisms and type 2 diabetes in the medical literature.
In 2012, Niu et al. performed a meta-analysis on the association of four widely-evaluated polymorphisms in AGER gene with diabetes mellitus, as well as their vascular complications [45]. Considering the possible clinical heterogeneity of pooling all forms of diabetes together and the high prevalence of type 2 diabetes globally, we, in this present meta-analysis, focused merely on the susceptibility of reported polymorphisms in AGER gene to type 2 diabetes in the literature. Relative to the meta-analysis by Niu et al. (12 studies eligible for type 2 diabetes) [45], we synthesized the results from 29 independent studies, which permitted us to seek potential causes of between-study heterogeneity by both subsidiary analyses and meta-regression analyses. Although our overall analyses only revealed two polymorphisms in statistically significant association with type 2 diabetes, the findings from subsequent subsidiary analyses are interesting. Extending the findings of previous studies [45-47], we observed an ethnicity-dependent association of genetic alterations in AGER gene with type 2 diabetes risk. It is worth noting in this systematic review and meta-analysis that the mutation carriers of an exonic polymorphism, rs2070600 (Gly82Ser), in AGER gene were over two times more likely to have type 2 diabetes in populations of Caucasian descent, and another promoter polymorphism, rs1800624 (T-374A) was a promising candidate locus in populations from South Asia. In light of the potentially functional nature of both polymorphisms, it is reasonable to speculate that their mutations might alter AGER gene expression on transcription level or change AGER protein structure on translation level, which will further precipitate the abnormal blood sugar control and further the development of type 2 diabetes. As this is a systematic review and meta-analysis, explorations on these functional aspects are beyond our capabilities, and we agree that further experimental studies are warranted to decipher the etiological role of these functional defects in AGER gene in the pathogenesis of type 2 diabetes.
Another important finding is the identification of two factors, ethnicity and source of study subjects as possible causes of between-study heterogeneity, which can help, at least in part, explain the previously unrepeatable association between AGER gene and type 2 diabetes. Although we made great endeavors to explore heterogeneity, we must admit that meta-regression analyses does not have the methodological rigor, like a properly designed study that is prepared to examine the impact of confounding factors formally [48]. To overcome this shortcoming, it is necessary to do a meta-analysis of individual participant data that is not always feasible, especially in case of genetic-disease data.
Limitations
Several limitations merit consideration for this present meta-analysis. Firstly, only publications in the English language were retrieved, meaning that a possible selection bias cannot be ruled out. Secondly, some polymorphisms in AGER gene were rarely reported in association with type 2 diabetes (such as insertion/deletion polymorphism [25]), and so only six polymorphisms in this gene were examined. Besides the significance of genetic association, it is of added interest to interrogate the contribution of these polymorphisms to endocrinological changes, which is beyond the capability of the present meta-analysis. Thirdly, although 29 studies were synthesized in this meta-analysis, for some polymorphisms and in the majority of subgroups, the number of eligible studies was not large enough to derive a reliable estimate. Fourthly, for some polymorphisms or comparisons, the number of studies is less than 10 in this meta-analysis, and so the power to detect statistical significance is low [49]. Fifthly, to seek other possible causes of between-study heterogeneity such as physical activity and to explore the relationship between AGER genetic polymorphisms and endocrinology-related biomarkers, one usually needs to perform a meta-analysis of individual participant data, which is not always feasible.
Conclusions
Via a systematic review and meta-analysis of 29 independent studies, our findings indicate an ethnicity-dependent contribution of AGER gene in the pathogenesis of type 2 diabetes, that is, rs2070600 was a susceptibility locus in Caucasians, yet rs1800624 in South Asians. For practical reasons, our hope is that more well-designed and soundly-prepared studies from genetic (AGER gene and other relevant genes) and experimental aspects (in vitro and in vivo) are necessary to unveil the complex picture of AGER gene in the development of type 2 diabetes, as well as the possible gene-to-gene and gene-to-environment interactions.
Specific Author Contributions
Haitao Yu and Chunjing Zhang planned and designed the study and directed its implementation.
Hao Cheng and Wenbin Zhu drafted the protocol.
Hao Cheng and Wenbin Zhu contributed to data acquisition.
Hao Cheng, Mou Zhu, Yan Sun, and Xiaojie Sun conducted statistical analyses.
Hao Cheng, Wenbin Zhu, Di Jia, and Chao Yang did the data preparation and quality control.
Haitao Yu and Chunjing Zhang wrote the manuscript.
All authors read and approved the final manuscript prior to submission.
Acknowledgement
The work was supported by the Natural Science Foundation of Heilongjiang Province (Grant No: LH2020H129) and Research Projects of Basic Scientific Research of Provincial Universities in Heilongjiang Province (Grant No: 2017-QYKYYWF-0747).
Disclosure
The authors declare that they have no conflicts of interest.
Data Availability Statement
Data involved in this study are available upon reasonable request.
Supplementary Table 1
The checklist of the Preferred Reporting Items for Systematic Reviews and Meta-analyses (PRISMA)
| Section/topic |
# |
Checklist item |
Reported on page # |
| TITLE |
| Title |
1 |
Identify the report as a systematic review, meta-analysis, or both. |
1 |
| ABSTRACT |
| Structured summary |
2 |
Provide a structured summary including, as applicable: background; objectives; data sources; study eligibility criteria, participants, and interventions; study appraisal and synthesis methods; results; limitations; conclusions and implications of key findings; systematic review registration number. |
3 |
| INTRODUCTION |
| Rationale |
3 |
Describe the rationale for the review in the context of what is already known. |
4 |
| Objectives |
4 |
Provide an explicit statement of questions being addressed with reference to participants, interventions, comparisons, outcomes, and study design (PICOS). |
5 |
| METHODS |
| Protocol and registration |
5 |
Indicate if a review protocol exists, if and where it can be accessed (e.g., Web address), and, if available, provide registration information including registration number. |
5 |
| Eligibility criteria |
6 |
Specify study characteristics (e.g., PICOS, length of follow-up) and report characteristics (e.g., years considered, language, publication status) used as criteria for eligibility, giving rationale. |
6 |
| Information sources |
7 |
Describe all information sources (e.g., databases with dates of coverage, contact with study authors to identify additional studies) in the search and date last searched. |
5 |
| Search |
8 |
Present full electronic search strategy for at least one database, including any limits used, such that it could be repeated. |
5–6, Fig. 1 |
| Study selection |
9 |
State the process for selecting studies (i.e., screening, eligibility, included in systematic review, and, if applicable, included in the meta-analysis). |
6–7 |
| Data collection process |
10 |
Describe method of data extraction from reports (e.g., piloted forms, independently, in duplicate) and any processes for obtaining and confirming data from investigators. |
6–7 |
| Data items |
11 |
List and define all variables for which data were sought (e.g., PICOS, funding sources) and any assumptions and simplifications made. |
6–7 |
| Risk of bias in individual studies |
12 |
Describe methods used for assessing risk of bias of individual studies (including specification of whether this was done at the study or outcome level), and how this information is to be used in any data synthesis. |
7 |
| Summary measures |
13 |
State the principal summary measures (e.g., risk ratio, difference in means). |
7 |
| Synthesis of results |
14 |
Describe the methods of handling data and combining results of studies, if done, including measures of consistency (e.g., I2) for each meta-analysis. |
6-7 |
| Risk of bias across studies |
15 |
Specify any assessment of risk of bias that may affect the cumulative evidence (e.g., publication bias, selective reporting within studies). |
6–7 |
| Additional analyses |
16 |
Describe methods of additional analyses (e.g., sensitivity or subgroup analyses, meta-regression), if done, indicating which were pre-specified. |
6–7 |
| RESULTS |
| Study selection |
17 |
Give numbers of studies screened, assessed for eligibility, and included in the review, with reasons for exclusions at each stage, ideally with a flow diagram. |
8, Fig. 1 |
| Study characteristics |
18 |
For each study, present characteristics for which data were extracted (e.g., study size, PICOS, follow-up period) and provide the citations. |
Table 1 |
| Risk of bias within studies |
19 |
Present data on risk of bias of each study and, if available, any outcome level assessment (see item 12). |
8–9 |
| Results of individual studies |
20 |
For all outcomes considered (benefits or harms), present, for each study: (a) simple summary data for each intervention group (b) effect estimates and confidence intervals, ideally with a forest plot. |
Fig. 3 |
| Synthesis of results |
21 |
Present results of each meta-analysis done, including confidence intervals and measures of consistency. |
Fig. 3, Table 2 |
| Risk of bias across studies |
22 |
Present results of any assessment of risk of bias across studies (see Item 15). |
Supplementary Fig. 1, Fig. 4 |
| Additional analysis |
23 |
Give results of additional analyses, if done (e.g., sensitivity or subgroup analyses, meta-regression [see Item 16]). |
Supplementary Fig. 2, Supplementary Fig. 3. |
| DISCUSSION |
| Summary of evidence |
24 |
Summarize the main findings including the strength of evidence for each main outcome; consider their relevance to key groups (e.g., healthcare providers, users, and policy makers). |
11 |
| Limitations |
25 |
Discuss limitations at study and outcome level (e.g., risk of bias), and at review-level (e.g., incomplete retrieval of identified research, reporting bias). |
13–14 |
| Conclusions |
26 |
Provide a general interpretation of the results in the context of other evidence, and implications for future research. |
14–15 |
| FUNDING |
| Funding |
27 |
Describe sources of funding for the systematic review and other support (e.g., supply of data); role of funders for the systematic review. |
15 |
From: Moher D, Liberati A, Tetzlaff J, Altman DG, The PRISMA Group (2009). Preferred Reporting Items for Systematic Reviews and Meta-Analyses: The PRISMA Statement. PLoS Med 6(6): e1000097. doi:10.1371/journal.pmed1000097
For more information, visit: www.prisma-statement.org.
Supplementary Table 2
The genotypes of six studied polymorphisms in
AGER gene in this meta-analysis
| First author |
rs2070600 |
rs1800624 |
rs1800625 |
rs184003 |
rs3134940 |
rs55640627 |
| Patients |
Controls |
Patients |
Controls |
Patients |
Controls |
Patients |
Controls |
Patients |
Controls |
Patients |
Controls |
| GG |
GA |
AA |
GG |
GA |
AA |
TT |
TA |
AA |
TT |
TA |
AA |
TT |
TC |
CC |
TT |
TC |
CC |
GG |
GT |
TT |
GG |
GT |
TT |
AA |
AG |
GG |
AA |
AG |
GG |
GG |
GA |
AA |
GG |
GA |
AA |
| Bala et al. |
118 |
13 |
4 |
133 |
2 |
0 |
NA |
NA |
NA |
NA |
NA |
NA |
NA |
NA |
NA |
NA |
NA |
NA |
NA |
NA |
NA |
NA |
NA |
NA |
NA |
NA |
NA |
NA |
NA |
NA |
NA |
NA |
NA |
NA |
NA |
NA |
| Zulfiqar et al. |
NA |
NA |
NA |
NA |
NA |
NA |
NA |
NA |
NA |
NA |
NA |
NA |
51 |
26 |
23 |
25 |
11 |
14 |
NA |
NA |
NA |
NA |
NA |
NA |
NA |
NA |
NA |
NA |
NA |
NA |
NA |
NA |
NA |
NA |
NA |
NA |
| Yang et al. |
524 |
553 |
175 |
459 |
395 |
93 |
690 |
441 |
121 |
551 |
334 |
62 |
688 |
398 |
166 |
533 |
343 |
71 |
638 |
535 |
79 |
504 |
384 |
59 |
821 |
347 |
84 |
620 |
282 |
45 |
NA |
NA |
NA |
NA |
NA |
NA |
| Raska et al. |
99 |
13 |
0 |
161 |
10 |
0 |
NA |
NA |
NA |
NA |
NA |
NA |
80 |
28 |
4 |
112 |
54 |
5 |
NA |
NA |
NA |
NA |
NA |
NA |
NA |
NA |
NA |
NA |
NA |
NA |
NA |
NA |
NA |
NA |
NA |
NA |
| Wu et al. (Without CP) |
36 |
17 |
5 |
43 |
14 |
5 |
NA |
NA |
NA |
NA |
NA |
NA |
NA |
NA |
NA |
NA |
NA |
NA |
NA |
NA |
NA |
NA |
NA |
NA |
NA |
NA |
NA |
NA |
NA |
NA |
NA |
NA |
NA |
NA |
NA |
NA |
| Wu et al. (With CP) |
110 |
53 |
9 |
109 |
85 |
8 |
NA |
NA |
NA |
NA |
NA |
NA |
NA |
NA |
NA |
NA |
NA |
NA |
NA |
NA |
NA |
NA |
NA |
NA |
NA |
NA |
NA |
NA |
NA |
NA |
NA |
NA |
NA |
NA |
NA |
NA |
| Haldar et al. |
112 |
32 |
1 |
74 |
26 |
0 |
NA |
NA |
NA |
NA |
NA |
NA |
NA |
NA |
NA |
NA |
NA |
NA |
85 |
57 |
3 |
64 |
36 |
0 |
NA |
NA |
NA |
NA |
NA |
NA |
NA |
NA |
NA |
NA |
NA |
NA |
| Bansal et al. |
122 |
12 |
1 |
154 |
17 |
0 |
72 |
54 |
9 |
124 |
44 |
3 |
105 |
29 |
1 |
144 |
26 |
1 |
NA |
NA |
NA |
NA |
NA |
NA |
NA |
NA |
NA |
NA |
NA |
NA |
NA |
NA |
NA |
NA |
NA |
NA |
| Bansal et al. |
118 |
11 |
1 |
154 |
17 |
0 |
85 |
39 |
6 |
124 |
44 |
3 |
70 |
55 |
5 |
144 |
26 |
1 |
NA |
NA |
NA |
NA |
NA |
NA |
NA |
NA |
NA |
NA |
NA |
NA |
NA |
NA |
NA |
NA |
NA |
NA |
| Ng et al. (DRCP) |
NA |
NA |
NA |
NA |
NA |
NA |
NA |
NA |
NA |
NA |
NA |
NA |
NA |
NA |
NA |
NA |
NA |
NA |
NA |
NA |
NA |
NA |
NA |
NA |
NA |
NA |
NA |
NA |
NA |
NA |
143 |
28 |
0 |
209 |
26 |
0 |
| Ng et al. (BJO) |
NA |
NA |
NA |
NA |
NA |
NA |
113 |
56 |
2 |
154 |
78 |
3 |
120 |
47 |
4 |
186 |
45 |
4 |
NA |
NA |
NA |
NA |
NA |
NA |
NA |
NA |
NA |
NA |
NA |
NA |
NA |
NA |
NA |
NA |
NA |
NA |
| Kucukhuseyin et al. |
41 |
10 |
1 |
26 |
29 |
0 |
NA |
NA |
NA |
NA |
NA |
NA |
NA |
NA |
NA |
NA |
NA |
NA |
NA |
NA |
NA |
NA |
NA |
NA |
NA |
NA |
NA |
NA |
NA |
NA |
NA |
NA |
NA |
NA |
NA |
NA |
| Prasad et al. |
NA |
NA |
NA |
NA |
NA |
NA |
NA |
NA |
NA |
NA |
NA |
NA |
NA |
NA |
NA |
NA |
NA |
NA |
NA |
NA |
NA |
NA |
NA |
NA |
NA |
NA |
NA |
NA |
NA |
NA |
NA |
NA |
NA |
NA |
NA |
NA |
| Zhang H et al. |
208 |
122 |
10 |
93 |
75 |
14 |
NA |
NA |
NA |
NA |
NA |
NA |
NA |
NA |
NA |
NA |
NA |
NA |
230 |
100 |
10 |
120 |
49 |
13 |
NA |
NA |
NA |
NA |
NA |
NA |
NA |
NA |
NA |
NA |
NA |
NA |
| Kucukhuseyin et al. |
NA |
NA |
NA |
NA |
NA |
NA |
14 |
19 |
21 |
21 |
25 |
7 |
NA |
NA |
NA |
NA |
NA |
NA |
NA |
NA |
NA |
NA |
NA |
NA |
NA |
NA |
NA |
NA |
NA |
NA |
NA |
NA |
NA |
NA |
NA |
NA |
| Goulart et al. (While) |
430 |
47 |
4 |
454 |
42 |
0 |
273 |
169 |
39 |
275 |
173 |
48 |
345 |
125 |
10 |
345 |
140 |
11 |
NA |
NA |
NA |
NA |
NA |
NA |
NA |
NA |
NA |
NA |
NA |
NA |
NA |
NA |
NA |
NA |
NA |
NA |
| Goulart et al. (AA) |
149 |
7 |
0 |
99 |
1 |
0 |
137 |
14 |
4 |
82 |
13 |
5 |
129 |
18 |
8 |
76 |
22 |
1 |
NA |
NA |
NA |
NA |
NA |
NA |
NA |
NA |
NA |
NA |
NA |
NA |
NA |
NA |
NA |
NA |
NA |
NA |
| Ramprasad et al. |
NA |
NA |
NA |
NA |
NA |
NA |
148 |
24 |
2 |
117 |
20 |
0 |
130 |
56 |
3 |
97 |
52 |
0 |
NA |
NA |
NA |
NA |
NA |
NA |
NA |
NA |
NA |
NA |
NA |
NA |
NA |
NA |
NA |
NA |
NA |
NA |
| Naka et al. |
144 |
3 |
0 |
79 |
3 |
0 |
NA |
NA |
NA |
NA |
NA |
NA |
NA |
NA |
NA |
NA |
NA |
NA |
NA |
NA |
NA |
NA |
NA |
NA |
NA |
NA |
NA |
NA |
NA |
NA |
NA |
NA |
NA |
NA |
NA |
NA |
| Lindholm et al. |
NA |
NA |
NA |
NA |
NA |
NA |
1,353 |
941 |
159 |
128 |
67 |
10 |
NA |
NA |
NA |
NA |
NA |
NA |
NA |
NA |
NA |
NA |
NA |
NA |
NA |
NA |
NA |
NA |
NA |
NA |
NA |
NA |
NA |
NA |
NA |
NA |
| Yoshioka et al. |
147 |
42 |
0 |
78 |
20 |
0 |
NA |
NA |
NA |
NA |
NA |
NA |
NA |
NA |
NA |
NA |
NA |
NA |
95 |
21 |
0 |
80 |
18 |
0 |
NA |
NA |
NA |
NA |
NA |
NA |
NA |
NA |
NA |
NA |
NA |
NA |
| Kankova et al. |
166 |
13 |
0 |
223 |
5 |
0 |
65 |
90 |
21 |
90 |
113 |
22 |
129 |
46 |
4 |
158 |
60 |
9 |
159 |
20 |
0 |
207 |
20 |
1 |
131 |
43 |
5 |
164 |
57 |
7 |
124 |
50 |
5 |
179 |
47 |
2 |
| Xu et al. |
NA |
NA |
NA |
NA |
NA |
NA |
116 |
34 |
2 |
157 |
51 |
4 |
117 |
33 |
2 |
162 |
47 |
3 |
NA |
NA |
NA |
NA |
NA |
NA |
NA |
NA |
NA |
NA |
NA |
NA |
NA |
NA |
NA |
NA |
NA |
NA |
| Katerina et al. |
NA |
NA |
NA |
NA |
NA |
NA |
NA |
NA |
NA |
NA |
NA |
NA |
NA |
NA |
NA |
NA |
NA |
NA |
186 |
25 |
1 |
221 |
22 |
1 |
146 |
58 |
8 |
175 |
61 |
8 |
147 |
59 |
6 |
191 |
49 |
4 |
| Kankova et al. |
158 |
13 |
0 |
158 |
1 |
0 |
NA |
NA |
NA |
NA |
NA |
NA |
NA |
NA |
NA |
NA |
NA |
NA |
147 |
23 |
1 |
142 |
17 |
0 |
121 |
43 |
7 |
113 |
42 |
4 |
NA |
NA |
NA |
NA |
NA |
NA |
| Hudson et al. |
NA |
NA |
NA |
NA |
NA |
NA |
NA |
NA |
NA |
NA |
NA |
NA |
80 |
29 |
0 |
75 |
38 |
0 |
NA |
NA |
NA |
NA |
NA |
NA |
NA |
NA |
NA |
NA |
NA |
NA |
NA |
NA |
NA |
NA |
NA |
NA |
| Pulkkinen et al. |
175 |
31 |
0 |
76 |
6 |
0 |
NA |
NA |
NA |
NA |
NA |
NA |
NA |
NA |
NA |
NA |
NA |
NA |
NA |
NA |
NA |
NA |
NA |
NA |
NA |
NA |
NA |
NA |
NA |
NA |
NA |
NA |
NA |
NA |
NA |
NA |
| Liu et al. |
103 |
50 |
2 |
59 |
42 |
3 |
NA |
NA |
NA |
NA |
NA |
NA |
NA |
NA |
NA |
NA |
NA |
NA |
NA |
NA |
NA |
NA |
NA |
NA |
NA |
NA |
NA |
NA |
NA |
NA |
NA |
NA |
NA |
NA |
NA |
NA |
| Hudson et al. |
237 |
18 |
0 |
311 |
40 |
2 |
NA |
NA |
NA |
NA |
NA |
NA |
NA |
NA |
NA |
NA |
NA |
NA |
NA |
NA |
NA |
NA |
NA |
NA |
NA |
NA |
NA |
NA |
NA |
NA |
NA |
NA |
NA |
NA |
NA |
NA |
Abbreviations: NA, not available.

References
- 1 Deshpande AD, Harris-Hayes M, Schootman M (2008) Epidemiology of diabetes and diabetes-related complications. Phys Ther 88: 1254–1264.
- 2 Shaw JE, Sicree RA, Zimmet PZ (2010) Global estimates of the prevalence of diabetes for 2010 and 2030. Diabetes Res Clin Pract 87: 4–14.
- 3 Saeedi P, Petersohn I, Salpea P, Malanda B, Karuranga S, et al. (2019) Global and regional diabetes prevalence estimates for 2019 and projections for 2030 and 2045: results from the International Diabetes Federation Diabetes Atlas, 9(th) edition. Diabetes Res Clin Pract 157: 107843.
- 4 Lee SC, Pu YB, Chow CC, Yeung VT, Ko GT, et al. (2000) Diabetes in Hong Kong Chinese: evidence for familial clustering and parental effects. Diabetes Care 23: 1365–1368.
- 5 Hemminki K, Li X, Sundquist K, Sundquist J (2010) Familial risks for type 2 diabetes in Sweden. Diabetes Care 33: 293–297.
- 6 Ried-Larsen M, MacDonald CS, Johansen MY, Hansen KB, Christensen R, et al. (2018) Why prescribe exercise as therapy in type 2 diabetes? We have a pill for that! Diabetes Metab Res Rev 34: e2999.
- 7 Cole JB, Florez JC (2020) Genetics of diabetes mellitus and diabetes complications. Nat Rev Nephrol 16: 377–390.
- 8 Cai L, Wheeler E, Kerrison ND, Luan J, Deloukas P, et al. (2020) Genome-wide association analysis of type 2 diabetes in the EPIC-InterAct study. Sci Data 7: 393.
- 9 Loomis SJ, Li M, Maruthur NM, Baldridge AS, North KE, et al. (2018) Genome-wide association study of serum fructosamine and glycated albumin in adults without diagnosed diabetes: results from the atherosclerosis risk in communities study. Diabetes 67: 1684–1696.
- 10 van Zuydam NR, Ahlqvist E, Sandholm N, Deshmukh H, Rayner NW, et al. (2018) A genome-wide association study of diabetic kidney disease in subjects with type 2 diabetes. Diabetes 67: 1414–1427.
- 11 Bowman P, Flanagan SE, Hattersley AT (2018) Future roadmaps for precision medicine applied to diabetes: rising to the challenge of heterogeneity. J Diabetes Res 2018: 3061620.
- 12 Kwon JM, Goate AM (2000) The candidate gene approach. Alcohol Res Health 24: 164–168.
- 13 Egaña-Gorroño L, López-Díez R, Yepuri G, Ramirez LS, Reverdatto S, et al. (2020) Receptor for advanced glycation end products (RAGE) and mechanisms and therapeutic opportunities in diabetes and cardiovascular disease: insights from human subjects and animal models. Front Cardiovasc Med 7: 37.
- 14 Ramasamy R, Yan SF, Schmidt AM (2011) Receptor for AGE (RAGE): signaling mechanisms in the pathogenesis of diabetes and its complications. Ann N Y Acad Sci 1243: 88–102.
- 15 Santilli F, Vazzana N, Bucciarelli LG, Davi G (2009) Soluble forms of RAGE in human diseases: clinical and therapeutical implications. Curr Med Chem 16: 940–952.
- 16 Ramasamy R, Yan SF, Schmidt AM (2005) The RAGE axis and endothelial dysfunction: maladaptive roles in the diabetic vasculature and beyond. Trends Cardiovasc Med 15: 237–243.
- 17 Liu Y, Yu M, Zhang L, Cao Q, Song Y, et al. (2016) Soluble receptor for advanced glycation end products mitigates vascular dysfunction in spontaneously hypertensive rats. Mol Cell Biochem 419: 165–176.
- 18 Kanková K, Stejskalová A, Hertlová M, Znojil V (2005) Haplotype analysis of the RAGE gene: identification of a haplotype marker for diabetic nephropathy in type 2 diabetes mellitus. Nephrol Dial Transplant 20: 1093–1102.
- 19 Raška I Jr., Rašková M, Zikán V, Škrha J (2017) Prevalence and risk factors of osteoporosis in postmenopausal women with type 2 diabetes mellitus. Cent Eur J Public Health 25: 3–10.
- 20 Goulart AC, Germer S, Rexrode KM, Martin M, Zee RY (2008) Polymorphisms in advanced glycosylation end product-specific receptor (AGER) gene, insulin resistance, and type 2 diabetes mellitus. Clin Chim Acta 398: 95–98.
- 21 Bansal S, Chawla D, Banerjee BD, Madhu SV, Tripathi AK (2013) Association of RAGE gene polymorphism with circulating AGEs level and paraoxonase activity in relation to macro-vascular complications in Indian type 2 diabetes mellitus patients. Gene 526: 325–330.
- 22 Moher D, Liberati A, Tetzlaff J, Altman DG (2009) Preferred reporting items for systematic reviews and meta-analyses: the PRISMA statement. BMJ 339: b2535.
- 23 Bala SV, Appukuttan D, Subramaniam S, Prakash PSG, Cholan PK, et al. (2019) Association of receptor for advanced glycation end products G82S polymorphism with chronic periodontitis in type II diabetic and non-diabetic South Indians. Gene 708: 30–37.
- 24 Zulfiqar S, Hussain F, Jamil A, Ahmed N (2018) Association of RAGE gene polymorphism with Type-2 diabetes mellitus in local population. Pak J Med Sci 34: 226–229.
- 25 Yang H, Nie Y, Chen Z, Ye L, Wang Q, et al. (2017) Genetic variants of the receptor for advanced glycation end-products in susceptibility to type 2 diabetes mellitus in primary hypertensive patients. Sci Rep 7: 17207.
- 26 Wu TL, Tsai CC, Wang YY, Ho KY, Wu YM, et al. (2015) The association between the RAGE G82S polymorphism, sRAGE and chronic periodontitis in Taiwanese individuals with and without diabetes. J Periodontal Res 50: 881–889.
- 27 Haldar SR, Chakrabarty A, Chowdhury S, Haldar A, Sengupta S, et al. (2015) Oxidative stress-related genes in type 2 diabetes: association analysis and their clinical impact. Biochem Genet 53: 93–119.
- 28 Ng ZX, Kuppusamy UR, Tajunisah I, Fong KC, Koay AC, et al. (2012) 2245G/A polymorphism of the receptor for advanced glycation end-products (RAGE) gene is associated with diabetic retinopathy in the Malaysian population. Br J Ophthalmol 96: 289–292.
- 29 Ng ZX, Kuppusamy UR, Tajunisah I, Fong KC, Chua KH (2012) Association analysis of –429T/C and –374T/A polymorphisms of receptor of advanced glycation end products (RAGE) gene in Malaysian with type 2 diabetic retinopathy. Diabetes Res Clin Pract 95: 372–377.
- 30 Kucukhuseyin O, Yilmaz-Aydogan H, Isbir CS, Isbir T (2012) Is there any association between GLY82 ser polymorphism of rage gene and Turkish diabetic and non diabetic patients with coronary artery disease? Mol Biol Rep 39: 4423–4428.
- 31 Prasad P, Tiwari AK, Kumar KM, Ammini AC, Gupta A, et al. (2010) Association analysis of ADPRT1, AKR1B1, RAGE, GFPT2 and PAI-1 gene polymorphisms with chronic renal insufficiency among Asian Indians with type-2 diabetes. BMC Med Genet 11: 52.
- 32 Zhang HM, Chen LL, Wang L, Liao YF, Wu ZH, et al. (2009) Association of 1704G/T and G82S polymorphisms in the receptor for advanced glycation end products gene with diabetic retinopathy in Chinese population. J Endocrinol Invest 32: 258–262.
- 33 Kucukhuseyin O, Aydogan HY, Isbir CS, Isbir T (2009) Associations of -374T/A polymorphism of receptor for advanced glycation end products (RAGE) gene in Turkish diabetic and non-diabetic patients with coronary artery disease. In Vivo 23: 949–954.
- 34 Ramprasad S, Radha V, Mathias RA, Majumder PP, Rao MR, et al. (2007) Rage gene promoter polymorphisms and diabetic retinopathy in a clinic-based population from South India. Eye (Lond) 21: 395–401.
- 35 Naka CL, Picheth G, Alcântera VM, Réa RR, Chautard-Freire-Maia EA, et al. (2006) The Gly82Ser polymorphism of the receptor of advanced glycation end product (RAGE) gene is not associated with type 1 or type 2 diabetes in a Brazilian population. Diabetes Care 29: 712–713.
- 36 Lindholm E, Bakhtadze E, Sjögren M, Cilio CM, Agardh E, et al. (2006) The –374 T/A polymorphism in the gene encoding RAGE is associated with diabetic nephropathy and retinopathy in type 1 diabetic patients. Diabetologia 49: 2745–2755.
- 37 Yoshioka K, Yoshida T, Takakura Y, Umekawa T, Kogure A, et al. (2005) Relation between polymorphisms G1704T and G82S of rage gene and diabetic retinopathy in Japanese type 2 diabetic patients. Intern Med 44: 417–421.
- 38 JiXiong X, BiLin X, MingGong Y, ShuQin L (2003) –429T/C and –374T/A polymorphisms of RAGE gene promoter are not associated with diabetic retinopathy in Chinese patients with type 2 diabetes. Diabetes Care 26: 2696–2697.
- 39 Kanková K, Beránek M, Hájek D, Vlková E (2002) Polymorphisms 1704G/T, 2184A/G, and 2245G/A in the rage gene are not associated with diabetic retinopathy in NIDDM: pilot study. Retina 22: 119–121.
- 40 Kanková K, Záhejský J, Márová I, Muzík J, Kuhrová V, et al. (2001) Polymorphisms in the RAGE gene influence susceptibility to diabetes-associated microvascular dermatoses in NIDDM. J Diabetes Complications 15: 185–192.
- 41 Hudson BI, Stickland MH, Futers TS, Grant PJ (2001) Effects of novel polymorphisms in the RAGE gene on transcriptional regulation and their association with diabetic retinopathy. Diabetes 50: 1505–1511.
- 42 Pulkkinen A, Viitanen L, Kareinen A, Lehto S, Laakso M (2000) Gly82Ser polymorphism of the receptor of advanced glycation end product gene is not associated with coronary heart disease in Finnish nondiabetic subjects or in patients with type 2 diabetes. Diabetes Care 23: 864.
- 43 Liu L, Xiang K (1999) RAGE Gly82Ser polymorphism in diabetic microangiopathy. Diabetes Care 22: 646.
- 44 Hudson BI, Stickland MH, Grant PJ (1998) Identification of polymorphisms in the receptor for advanced glycation end products (RAGE) gene: prevalence in type 2 diabetes and ethnic groups. Diabetes 47: 1155–1157.
- 45 Niu W, Qi Y, Wu Z, Liu Y, Zhu D, et al. (2012) A meta-analysis of receptor for advanced glycation end products gene: four well-evaluated polymorphisms with diabetes mellitus. Mol Cell Endocrinol 358: 9–17.
- 46 Lu W, Feng B (2010) The -374A allele of the RAGE gene as a potential protective factor for vascular complications in type 2 diabetes: a meta-analysis. Tohoku J Exp Med 220: 291–297.
- 47 Kang P, Tian C, Jia C (2012) Association of RAGE gene polymorphisms with type 2 diabetes mellitus, diabetic retinopathy and diabetic nephropathy. Gene 500: 1–9.
- 48 Munafo MR, Flint J (2004) Meta-analysis of genetic association studies. Trends Genet 20: 439–444.
- 49 (2021) Recommendations on testing for funnel plot asymmetry. https://handbook-5-1.cochrane.org/chapter_10/10_4_3_1_recommendations_on_testing_for_funnel_plot_asymmetry.htm accessed on March 11, 2021.