Abstract
Exercise has beneficial effects on metabolic syndrome (MS). However, the exercise prescriptions that best support plasma glucose and lipid control remain unknown. We evaluated the effects of different combinations of aerobic and resistance training programs on plasma glucose and lipid metabolism and sleep quality in elderly MS patients. Eighty-five elderly MS patients were randomly assigned to five groups: aerobic training (AT), resistance training (RT), high aerobic with low resistance training (HALRT), high resistance with low aerobic training (HRLAT), or control. The exercise groups performed supervised moderate-intensity exercise during three 50-min sessions per week for 12 weeks. Body mass index (BMI), waist circumference (WC), systolic blood pressure (SBP), diastolic blood pressure (DBP), handgrip strength (HGS), fasting plasma glucose (FPG), 2-hour postprandial blood glucose (2hPG), total cholesterol (TC), triglyceride (TG), low-density lipoprotein cholesterol (LDL-C), high-density lipoprotein cholesterol (HDL-C) levels and sleep quality were evaluated at baseline and after 12 weeks. All intervention groups showed significant improvements in SBP, HGS, FPG, 2hPG, and Pittsburgh Sleep Quality Index (PSQI) scores compared to baseline (all p < 0.05), while DBP, TC, TG, and LDL-C levels were significantly improved only in the HRLAT and HALRT groups (p < 0.05). The HALRT group showed the largest improvements in WC, SBP, DBP, HGS, FPG, 2hPG, and PSQI score (p < 0.001). The largest improvements in BMI, TC, and LDL-C were observed in the HRLAT group (p < 0.001). The combined exercise prescriptions were more effective than aerobic or resistance training alone at improving plasma glucose and lipid metabolism and sleep quality in elderly MS patients.
METABOLIC SYNDROME (MS) is a cluster of risk factors for metabolic disorder, and the most prevalent factors include abdominal obesity, dyslipidemia, hypertension, and insulin resistance [1, 2]. These risk factors collectively increase the risks of developing sleep disorders [3], type 2 diabetes mellitus (T2DM) [4] and cardiovascular disease [5], all conditions that decrease patients’ quality of life [6]. It is estimated that over 25% of adults worldwide suffer from MS [7], and the overall prevalence of MS in China was reported to be 24.5% in 2015 [8]. The continually increasing prevalence of MS has become a serious global public health problem, as MS poses a heavy economic burden to patients, families, and societies [9]. Good glycemic and lipid control can reduce the exacerbation of MS to T2DM [10] as well as the risk of CVD [11], improve patients’ quality of life, and reduce healthcare costs [12].
Exercise is recognized as an effective non-pharmacological treatment for MS patients [13, 14], with various studies demonstrating that exercise can improve glycemic control, blood lipid levels (e.g., total cholesterol, triglycerides, and low-density lipoprotein cholesterol), body composition [15, 16], and sleep quality [17] in MS patients. Individualized exercise prescriptions are strongly recommended in all exercise guidelines [18, 19]. Such interventions require clear definitions of the modality, intensity, frequency, and duration of exercise, because different components of exercise prescriptions possibly confer different health benefits. The World Health Organization recommends adults ages >65 years of age should perform both aerobic and resistance exercise of moderate-to-vigorous intensity each week [20]. However, there are no guidelines for recommended exercise prescriptions for elderly MS patients. Although accumulating research has shown that combined exercise regimens are more beneficial for reducing some components of MS than either aerobic or resistance exercise alone [15, 16, 21, 22], the intensity, frequency, and duration of exercise applied in these studies varied. Therefore, the present study aimed to evaluate the effects of different combinations of aerobic and resistance exercise on plasma glucose and lipid metabolism and sleep quality in elderly MS patients when prescribed at the same intensity, frequency and duration, and to determine the preferable exercise prescriptions for these patients.
Methods
Study design and participants
For this 12-week randomized controlled trial, a total of 91 elderly MS patients were recruited using advertisements posted in the Taikang Yueyuan Nursing Home in Guangzhou between July 2018 and October 2019. Of these 91 participants, six were excluded, including four who did not meet the inclusion criteria and two who declined to participate in this study. The inclusion criteria included a confirmed diagnosis of MS [2], age ≥60 years, and the ability to communicate and collaborate with researchers. The exclusion criteria were: cardiac function grade ≥2 that might preclude moderate-intensity exercise, an acute infectious disease, vision loss, diabetic foot, and inability to complete the aerobic and resistance exercise prescribed in the present study. All participants were screened by physical testing that involved walking or bicycling. The experimental protocol was approved by the institutional review board of the First Affiliated Hospital of Guangdong Pharmaceutical University (no. 2018-56) and registered with the Chinese Clinical Trial Registry (ChiCTR2100052169), and all participants provided written informed consent prior to participation.
Randomization
After the baseline assessment, participants were randomly assigned to the aerobic training (AT) group, the resistance training (RT) group, the high aerobic combined with low resistance training (HALRT) group, the high resistance combined with low aerobic training (HRLAT) group, or the control group in a 1:1:1:1:1 ratio using random numbers tables. The individual group allocation information was placed in sealed, opaque, and consecutively numbered envelopes. The fitness instructor opened the envelopes in front of participants and assigned them to the groups, while the participants remained blinded to their allocation.
Intervention
Before the intervention officially started, each participant met with the registered dietitian for nutrition assessment and counseling, and an individualized nutrition intervention plan was developed in accordance with each participant’s daily caloric goals and participant preferences for various food items. To ensure participants followed the diet assigned, the registered dietician met weekly with them for individual counseling and to address possible concerns. During the intervention period, all participants continued to take their usual medication. Each participant received follow-up and clinical evaluations through a face-to-face interview by the same physicians once a week, and the medication was adjusted according to their disease condition. Participants in the control group received no exercise intervention and were asked to maintain their current lifestyle. Participants in the four intervention groups performed moderate-intensity exercise for 50 minutes (not including 10-minute warm-up and stretching periods) three times a week (on nonconsecutive days) for 12 weeks at the Fitness Centre of the Taikang Yueyuan Nursing Home. The fitness instructors assessed each participant’s fitness level and prescribed individualized exercise programs consistent with the participant’s group allocation and also adhering to the guidelines for the prevention and treatment of type 2 diabetes in China (2017 edition) [23]. All exercise programs were performed under the supervision of a certified fitness instructor.
The AT group engaged in a series of aerobic exercises. In each session, participants were instructed to run on a treadmill for 15 minutes followed by 10 minutes of walking on a treadmill. Next, these participants performed 15 minutes of cycling followed by 10 minutes of elliptical training. The aerobic exercise load was 40%–60% of the patient’s maximum heart rate (MHR) [MHR = 220 – age]. While keeping the heart rate in this standard range, the participants could adjust the sequence of the exercise programs according to their comfort and personal preferences.
The RT group performed different resistance exercises using weight machines and free weights, specifically including chest press, back extension, shoulder press, leg press, leg extension/leg flexion, bicep curls/triceps extension, abdominal crunch, lat pull-down, and seated overhead press using dumbbells. These exercises involve the major muscle groups, alternating upper body, core, and lower body exercises. Resistance exercise was performed at 45%–65% of the one-repetition maximum (1-RM) for each exercise, with three sets of 10–13 repetitions on each machine or free weight set (with a 2-minute rest between sets).
The HALRT group was prescribed two sessions of aerobic exercises and one session of resistance exercise per week, according to the order of aerobic, resistance, and aerobic exercise on alternating days. The HRLAT group was prescribed two sessions of resistance exercises and one session of aerobic exercise each week, according to the order of resistance, aerobic, and resistance exercise on alternating days. The requirements for aerobic and resistance exercise for both groups were the same those for the AT group and RT groups, respectively.
Before initiation of the formal study, fitness instructors guided participants in moderate-to-low intensity exercise for 1 week. Aerobic exercise was performed at 40%–60% of MHR; resistance exercise was performed at 70%–80% 1-RM. During exercise, participants wore sports bracelets that allowed real-time heart rate monitoring, and their fatigue level was evaluated using the Borg self-contained subjective fatigue (RPE) scale at the end of training [24]. RPE scores between 12 and 14 indicated that the exercise intensity was appropriate.
Measurements
Demographic data were collected via self-reporting before the start of the study (baseline). Participants’ physical fitness indicators, blood biochemical parameters and sleep quality index were assessed at baseline and again after 12 weeks. All data collection was performed by the same researcher, and data accuracy was ensured by double entry and rechecking of the data.
Physical fitness
Physical fitness included body mass index (BMI), waist circumference (WC), systolic blood pressure (SBP), diastolic blood pressure (DBP), and handgrip strength (HGS). BMI was calculated from measured weight and height [BMI = weight/height2 (kg/m2)]. Participants were asked to remove their shoes and thick clothing for measurement of weight and height. WC was measured using a nonelastic measuring tape at the midpoint between the lower rib and the iliac crest with participants standing and breathing normally. SBP and DBP were measured using an electronic sphygmomanometer (Yuyue, Jiangsu, China) on the left or right arm in a sitting position after at least 10-min rest. We measured HGS using a digital grip strength meter (Xiangshan, Zhejiang, China).
Plasma glucose and lipid metabolism indexes
Following an 8- to 12-hour overnight fasting period, venous blood samples (10 mL) were obtained from an antecubital vein while participants remained in seated position after a 20-minute rest between 07:00 a.m. and 09:00 a.m. Hematological parameters including fasting plasma glucose (FPG), total cholesterol (TC), triglycerides (TG), low-density lipoprotein cholesterol (LDL-C), and high-density lipoprotein cholesterol (HDL-C) levels were measured using an automated biochemical analyzer (Roche COBAS C501, Indianapolis, IN). The 2-hour postprandial blood glucose (2hPG) test was performed using a hand-held glucose meter (Yuyue, Jiangsu, China) that was applied on the fingertip for measurement of the 2hPG level for each participant 2 hours after breakfast.
Sleep score
The Chinese version of the Pittsburgh Sleep Quality Index (PSQI) was used to assess participants’ sleep quality during the previous month [25]. The PSQI contains seven dimensions: sleep quality, sleep latency, sleep duration, habitual sleep efficiency, sleep disturbances, use of sleep medications, and daytime dysfunction. Each of these seven domains is equally weighted based on a 0–3 scale; the global PSQI score ranges from 0 to 21, with a higher score indicating poorer sleep quality and a global score >7 points defined as poor sleep quality. The Chinese version of the PSQI previously showed good reliability and validity (Cronbach’s alpha = 0.84) [25].
Statistical analysis
Statistical analyses were performed using SPSS, version 23.0 (IBM). The normality of the data was tested using the Shapiro-Wilks test. Descriptive characteristics are presented using mean and standard deviation values for normally distributed quantitative variables, median and interquartile range values for non-normally distributed quantitative variables, and number and frequency values for categorical variables. We compared the demographic profiles and pre-test data among the five groups using one-way analysis of variance (ANOVA) for normally distributed variables and Wilcoxon rank-sum test for non-normally distributed variables. The chi-square test was used to compare categorical variables among the five groups. Paired samples t-tests were used to identify significant changes in physical fitness indicators, plasma glucose and lipid metabolism indexes, and sleep quality scores from pre- to post-intervention for each group. The Kruskal-Wallis rank-sum test was used to identify significant differences in the changes in physical fitness indicators, plasma glucose and lipid metabolism indexes, and sleep quality score from baseline to 12 weeks among the five groups. For those variables with significant inter-group differences, the Kruskal-Wallis one-way ANOVA was used to conduct pairwise comparisons between groups. Values of p less than 0.05 were considered significant.
Results
Participants and baseline characteristics
A total of 85 elderly MS patients met the inclusion criteria and were enrolled in the study, and 83 (98%) completed the intervention and were included in the final analysis (Fig. 1). Two participants in the AT group dropped out due to repeated upper respiratory tract infections (n = 1) and opposition by the family (n = 1) during the early intervention period. No significant differences in demographic data, physical fitness, plasma glucose and lipid metabolism, and PSQI scores at baseline were detected among the groups (Table 1). The participants’ mean (SD) age was 79.83 (5.13) years; 68.7% of the participants were female; 73.5% had a college education or above; and 30.6% were widowed.

Table 1
Baseline characteristics of study participants
| Characteristics |
AT group
(n = 15) |
RT group
(n = 17) |
HALRT group
(n = 17) |
HRLAT group
(n = 17) |
Control group
(n = 17) |
p |
| Age (years), mean ± SD |
79.46 ± 4.82 |
78.88 ± 5.40 |
82.82 ± 3.81 |
78.41 ± 6.12 |
75.41 ± 19.35 |
0.309 |
| Sex, n (%) |
|
|
|
|
|
0.355 |
| Male |
2 (13.3) |
8 (47.1) |
6 (35.3) |
5 (29.4) |
5 (29.4) |
|
| Female |
13 (86.7) |
9 (52.9) |
11 (64.7) |
12 (70.6) |
12 (70.6) |
|
| Marital status, n (%) |
|
|
|
|
|
0.324 |
| Married |
9 (60.0) |
15 (88.2) |
11 (64.7) |
12 (70.6) |
10 (58.8) |
|
| Divorced/widowed |
6 (40.0) |
2 (11.8) |
6 (35.3) |
5 (29.4) |
7 (41.2) |
|
| Education level, n (%) |
|
|
|
|
|
0.993 |
| ≤Primary school |
1 (6.7) |
1 (5.9) |
3 (17.6) |
3 (17.6) |
1 (5.9) |
|
| Junior middle school |
1 (6.7) |
1 (5.9) |
1 (5.9) |
1 (5.9) |
1 (5.9) |
|
| Senior middle school |
2 (13.3) |
1 (5.9) |
2 (11.8) |
1 (5.9) |
2 (11.8) |
|
| College and above |
11 (73.3) |
14 (82.3) |
11 (64.7) |
12 (70.6) |
13 (76.4) |
|
| Number of comorbid diseases, n (%) |
|
|
|
|
|
0.377 |
| 0~1 |
4 (26.7) |
4 (23.5) |
4 (23.5) |
7 (41.2) |
4 (23.5) |
|
| 1~2 |
7 (46.6) |
9 (53.0) |
5 (29.4) |
2 (11.8) |
7 (41.2) |
|
| ≥3 |
4 (26.7) |
4 (23.5) |
8 (47.1) |
8 (47.1) |
6 (35.3) |
|
| Disease duration (years), median (q1, q3) |
22.0 (6.0, 30.0) |
24.0 (4.5, 25.0) |
25.0 (5.0, 34.5) |
15.0 (9.5, 34.5) |
20.0 (13.0, 30.0) |
0.606 |
| Current Medications, n (%) |
|
|
|
|
|
|
| antihypertensive agents |
14 (93.3) |
13 (76.5) |
14 (93.3) |
11 (64.7) |
12 (70.6) |
0.361 |
| hypoglycemic agents/insulin |
4 (26.7) |
9 (52.9) |
8 (47.1) |
8 (47.1) |
6 (35.3) |
0.572 |
| statins |
14 (93.3) |
15 (88.2) |
13 (76.5) |
15 (88.2) |
17 (100) |
0.274 |
| BMI (kg/m2), mean ± SD |
24.05 ± 3.00 |
26.09 ± 3.05 |
24.54 ± 3.97 |
24.82 ± 2.92 |
24.77 ± 4.27 |
0.553 |
| WC (cm), mean ± SD |
92.40 ± 7.74 |
94.53 ± 8.98 |
91.71 ± 12.43 |
92.15 ± 8.26 |
89.80 ± 11.85 |
0.753 |
| SBP (mmHg), mean ± SD |
137.73 ± 17.68 |
130.47 ± 12.59 |
136.41 ± 10.83 |
130.58 ± 14.60 |
131.64 ± 14.55 |
0.435 |
| DBP (mmHg), mean ± SD |
71.13 ± 11.51 |
72.35 ± 5.94 |
73.05 ± 6.06 |
71.58 ± 7.81 |
69.29 ± 6.57 |
0.523 |
| HGS (kg), mean ± SD |
21.86 ± 5.95 |
26.42 ± 5.70 |
22.48 ± 7.43 |
23.92 ± 5.47 |
21.88 ± 4.72 |
0.142 |
| FPG (mmol/L), mean ± SD |
6.13 ± 0.81 |
6.19 ± 0.92 |
6.57 ± 1.46 |
6.57 ± 1.05 |
6.19 ± 1.42 |
0.676 |
| 2hPG (mmol/L), mean ± SD |
7.78 ± 2.20 |
8.27 ± 2.53 |
8.30 ± 2.12 |
7.78 ± 2.17 |
7.06 ± 1.62 |
0.457 |
| TC (mmol/L), mean ± SD |
4.99 ± 1.14 |
4.40 ± 1.08 |
5.08 ± 1.18 |
4.87 ± 1.16 |
4.70 ± 0.84 |
0.398 |
| TG (mmol/L), mean ± SD |
1.71 ± 1.11 |
1.27 ± 0.72 |
1.72 ± 0.88 |
1.79 ± 1.02 |
1.67 ± 0.83 |
0.492 |
| HDL-C (mmol/L), mean ± SD |
1.43 ± 0.36 |
1.39 ± 0.30 |
1.43 ± 0.35 |
1.42 ± 0.39 |
1.38 ± 0.25 |
0.991 |
| LDL-C (mmol/L), mean ± SD |
3.45 ± 0.94 |
2.84 ± 0.99 |
3.50 ± 1.23 |
3.21 ± 1.10 |
3.06 ± 0.66 |
0.309 |
| PSQI (points), mean ± SD |
11.66 ± 2.22 |
11.88 ± 2.14 |
13.76 ± 3.46 |
12.58 ± 2.87 |
12.11 ± 3.35 |
0.252 |
Numerical variables are expressed as mean ± SD or median (interquartile range); categorical variables are expressed as %.
One-way analysis of variance (ANOVA) or the Kruskal-Wallis test were used for continuous data, and chi-square tests for categorical data.
AT, aerobic training; RT, resistance training; HALRT, high aerobic and low resistance training; HRLAT, high resistance and low aerobic training; SD, standard deviation; BMI, body mass index; WC, waist circumference; SBP, systolic blood pressure; DBP, diastolic blood pressure; HGS, handgrip strength; FPG, fasting plasma glucose; 2hPG, two-hour postprandial blood glucose; TC, total cholesterol; TG, triglycerides; HDL, high-density lipoprotein cholesterol; LDL, low-density lipoprotein cholesterol; PSQI, Pittsburgh Sleep Quality Index.
Varying degrees of improvement in physical fitness, plasma glucose and lipid metabolism, and sleep quality were observed in all intervention groups (Fig. 2 and Supplemental Table 1), including significant decreases in SBP, HGS, FPG, and 2hPG levels in all four exercise groups (all p < 0.05). In comparison, no significant changes were detected in the control group (p > 0.05). For measured BMI, we also observed a decreasing trend in all four exercise groups, yet significant reduction was observed only in the HRLAT group. For measured WC, we observed significant reductions in the AT, HRLAT, and HALRT groups (all p < 0.05). Decreases in DBP, TC, TG, and LDL-C levels were apparent, but the changes were statistically significant only in HRLAT and HALRT groups. Similarly, sleep quality as measured with the PSQI improved significantly in the four exercise groups (all p < 0.05), but no statistically significant difference was observed in the control group. Notably, no significant change in HDL-C level was observed in any exercise or control group (all p > 0.05).
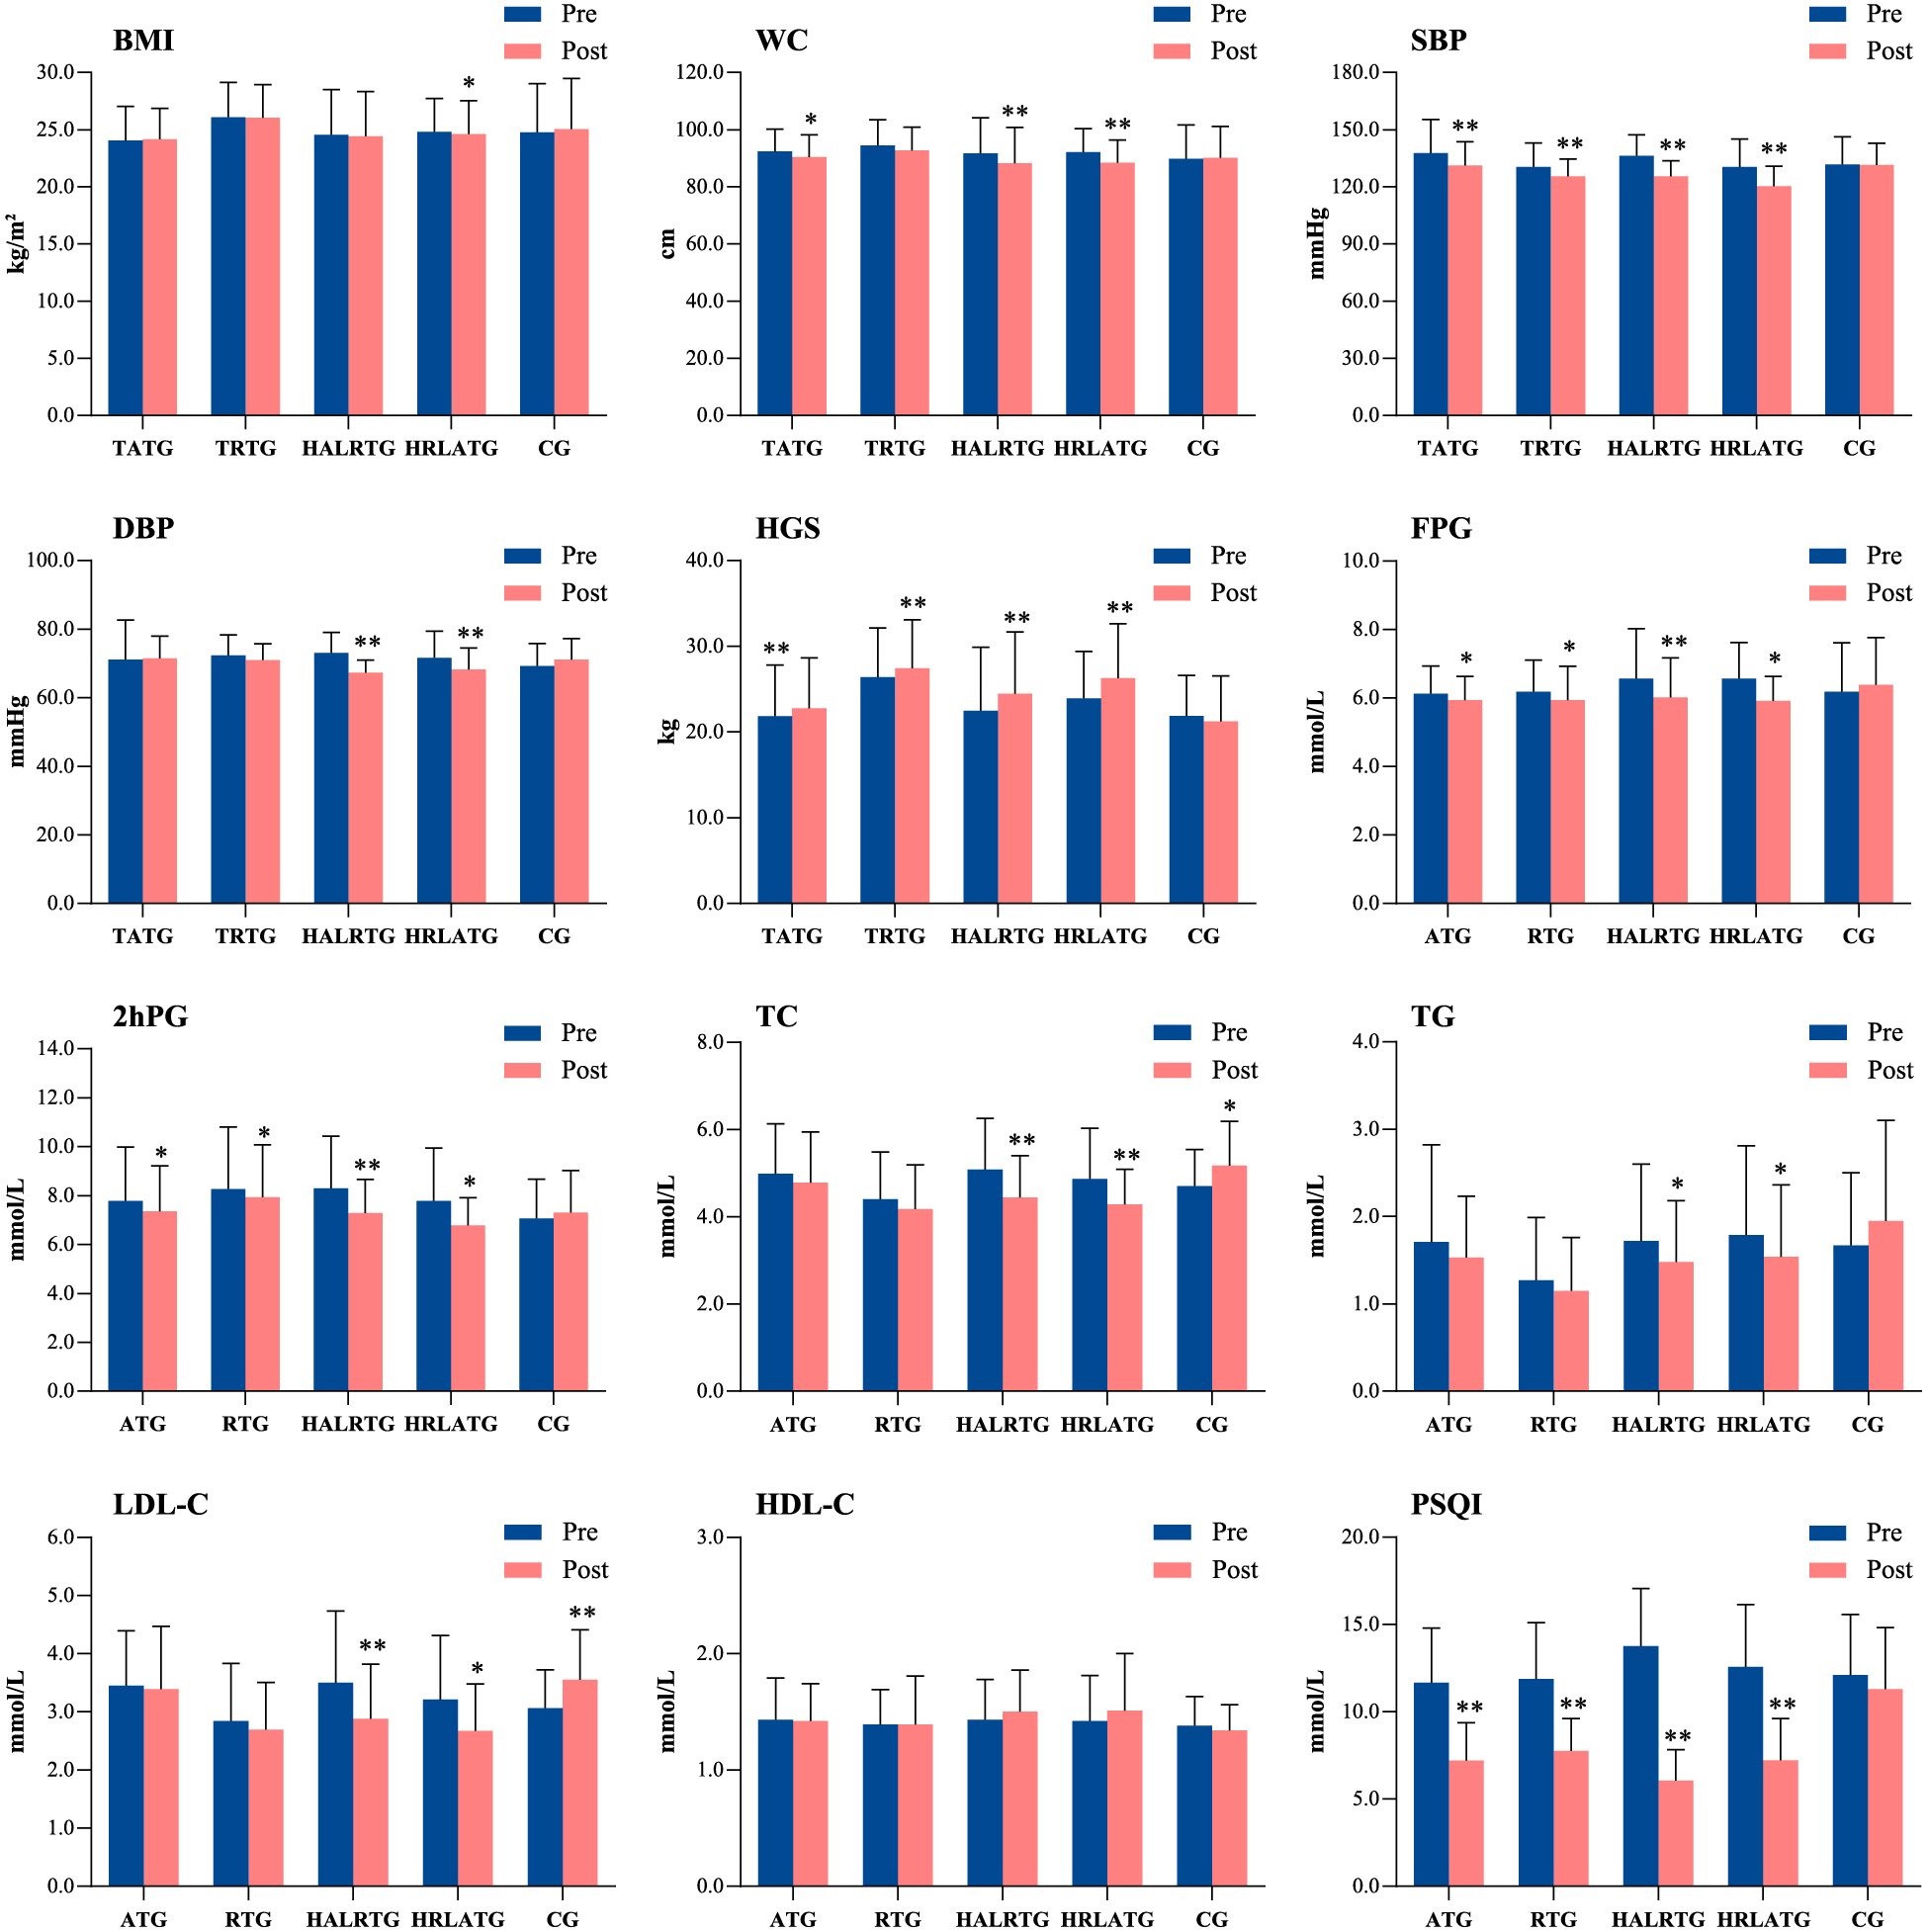
Comparisons of the changes in physical fitness, plasma glucose and lipid metabolism, and sleep scores among the different study groups showed that the largest reductions in WC, SBP, DBP, HGS, FPG, and 2hPG levels were observed in the HALRT group (median [interquartile range]; WC: –4.00 [–5.00, –2.00] cm; SBP: –9.00 [–16.00, –9.00] mmHg; DBP: –5.00 [–8.50, –1.50] mmHg; HGS: 2.00 [1.25, 2.25] kg; FPG: –0.50 [–0.70, –0.24] mmol/L; 2hPG: –0.70 [–1.65, –0.30] mmol/L), with significant differences among the groups (WC: H = 23.47, p < 0.001; SBP: H = 18.44, p = 0.001; DBP: H = 14.76, p = 0.005; handgrip strength: H = 31.04, p < 0.001; FPG: H = 27.89, p < 0.001; 2hPG: H = 24.65, p < 0.001; Table 2 and Supplemental Table 1). The largest decreases in TC and LDL-C levels were observed in the HRLAT group (median [interquartile range]; TC: –0.47 [–0.81, –0.19] mmol/L; LDL-C: –0.36 [–0.86, –0.13] mmol/L), also with significant between-group differences (TC: H = 27.63, p < 0.001; LDL-C: H = 30.60, p < 0.001). However, the change in HDL-C did not differ significantly among the groups (H = 7.779, p = 0.10; Table 2). The largest reduction in PSQI scores was observed in the HALRT group (median –8.0, range –10.5 to –4.5), with a significant between-group difference (H = 8.04, p < 0.001).
Table 2
Changes in physical indicators, plasma glucose and lipid metabolism parameters, and sleep quality scores after 12-week exercise intervention
| Variable |
AT group
(n = 15) |
RT group
(n = 17) |
HALRT group
(n = 17) |
HRLAT group
(n = 17) |
Control group
(n = 17) |
p |
| BMI (kg/m2) |
–0.25 (–0.37, 0.15) |
–0.06 (–0.51, 0.44) |
–0.11 (–0.31, 0.01) |
–0.20 (–0.41, 0.01) |
0.44 (–0.33, 0.76) |
0.265 |
| WC (cm) |
–2.00 (–3.00, –1.00) |
–2.00 (–3.50, –0.20) |
–4.00 (–5.00, –2.00)* |
–3.50 (–5.00, –3.00)* |
1.00 (–0.90, 2.00) |
<0.001 |
| SBP (mmHg) |
–7.00 (–8.00, –5.00) |
–4.0 (–10.00, –6.50) |
–9.0 (–16.00, –9.00)* |
–8.0 (–13.00, –6.50)* |
–2.0 (–5.50, 8.00) |
0.001 |
| DBP (mmHg) |
–4.0 (–5.00, 4.00) |
–2.00 (–4.00, 0.50) |
–5.0 (–8.50, –1.50)* |
–3.0 (–5.50, –1.50) |
2.0 (–2.50, 6.50) |
0.005 |
| HGS (kg) |
0.70 (0.30, 1.50) |
1.10 (0.35, 1.40)* |
2.00 (1.25, 2.25)#△* |
1.70 (1.00, 3.10)#* |
–0.90 (–2.25, 0.85) |
<0.001 |
| FPG (mmol/L) |
–0.20 (–0.30, –0.05) |
–0.20 (–0.31, –0.14) |
–0.50 (–0.70, –0.24)*# |
–0.40 (–0.86, –0.40)*# |
0.10 (–0.23, 0.50) |
<0.001 |
| 2hPG (mmol/L) |
–0.40 (–0.60, 0.05)* |
–0.30 (–0.60, 0.05) |
–0.70 (–1.65, –0.30)* |
–0.40 (–0.86, –0.40)* |
0.20 (–2.00, 0.50) |
<0.001 |
| TC (mmol/L) |
–0.14 (–0.30, 0.09) |
–0.20 (–0.46, 0.12)* |
–0.37 (–0.98, –0.17)* |
–0.47 (–0.81, –0.19)* |
0.34 (–0.08, 0.90) |
<0.001 |
| TG (mmol/L) |
–0.04 (–0.24, 0.04) |
–0.08 (–0.22, 0.06) |
–0.11 (–0.39, –0.06)* |
–0.11 (–0.63, 0.00)* |
0.28 (–0.04, 0.61) |
0.006 |
| HDL-C (mmol/L) |
0.02 (–0.10, 0.06) |
–0.01 (–0.17, 0.20) |
0.06 (0.01, 0.23) |
0.05 (–0.06, 0.11) |
–0.05 (–0.11, 0.11) |
0.100 |
| LDL-C (mmol/L) |
0.00 (–0.43, 0.41) |
–0.05 (–0.28, 0.16)* |
–0.26 (–1.15, –0.16)* |
–0.36 (–0.86, –0.13)* |
0.33 (0.08, 0.97) |
<0.001 |
| PSQI (points) |
–0.20 (–0.30, –0.05)*# |
–0.20 (–0.31, –0.15)*# |
–8.0 (–10.5, –4.5)* |
–6.0 (–9.0, –2.0)*# |
0.00 (–5.0, 3.5) |
<0.001 |
Data are presented as median (25th percentile, 75th percentile); change = post-intervention – baseline.
* indicates a statistically significant difference compared to the control group (p < 0.05); # indicates a statistically significant difference compared to the AT group (p < 0.05); △ indicates a statistically significant difference compared to the RT group (p < 0.05).
AT, aerobic training; RT, resistance training; HALRT, high aerobic and low resistance training; HRLAT, high resistance and low aerobic training; BMI, body mass index; WC, waist circumference; SBP, systolic blood pressure; DBP, diastolic blood pressure; HGS, handgrip strength; FPG, fasting plasma glucose; 2hPG, two-hour postprandial blood glucose; TC, total cholesterol; TG, triglycerides; HDL, high-density lipoprotein cholesterol; LDL, low-density lipoprotein cholesterol; PSQI, Pittsburgh Sleep Quality Index.
Discussion
The present study investigated the effects of two different 12-week combined aerobic and resistance exercise prescriptions with four components on physical fitness, plasma glucose and lipid metabolism, and sleep quality in elderly MS patients. The results indicate that combined exercise regimens with both aerobic and resistance components led to better improvements in physical fitness, plasma glucose and lipid metabolism, and sleep quality than those including only aerobic or resistance training. Furthermore, high aerobic exercise combined with low resistance exercise was most effective at improving WC, SBP, DBP, HGS, glycemic control, and sleep quality in these patients. However, high resistance exercise combined with low aerobic exercise resulted in better regulation of BMI and blood lipid levels. These results suggest that high aerobic exercise combined with low resistance exercise training may be a preferable exercise prescription for elderly MS patients for improving physical fitness, plasma glucose and lipid metabolism and sleep quality.
The experimental results showed that a combined exercise prescription may be more beneficial for WC and HGS. These findings were consistent with the results of a meta-analysis [15] and a RCT study [26], which show that combined aerobic and resistance training may be optimal for reducing WC and increasing HGS in MS patients. However, the BMI change was not statistically significant in all intervention groups, which could be attributed to muscle mass increased due to both resistance training and aerobic excise [27].
Our study found that both exercise consisting of aerobic or resistance training or both forms improved FPG and 2hPG levels in elderly MS patients. However, the combined exercise prescriptions showed the greatest benefits. This observation is in agreement with previous studies in other populations that showed combined exercise interventions had a better positive effect on glycemic control, compared with those involving only one type of exercise [16, 28]. This can be explained by the possibility of the synergistic effect of combined aerobic and resistance training. Firstly, aerobic exercise increases the concentration of glucose transporter type 4 (GLUT-4) in the cell membrane [29] and increases glucose uptake in skeletal muscles [30], thus helping to maintain blood glucose levels in a dynamic equilibrium, whereas resistance training improves insulin sensitivity by increasing muscle mass [31]. Increased muscle mass can then further enhance the basal metabolic rate and promote glucose uptake from the blood [32]. In addition, aerobic exercise can improve fatty acid oxidation (both long- and medium-chain) and promote muscle metabolism, thereby modulating insulin sensitivity [33]. Resistance training not only improves muscle mitochondrial content and function but also results in adaptive responses within mitochondria to cope better with the glucose disposal in the insulin-resistant state [34]. The combination of aerobic and resistance exert greater beneficial effects on glycemic control. These results provide support for the prescription of combination training for the greatest overall benefits from exercise training in elderly MS patients with plasma glucose metabolism disorders. We did not observe statistically significant between-group differences in glycemic variations in the present study. A possible explanation is that our sample size was too small to achieve the statistical power needed to detect differences between groups. Additionally, we only assessed FPG and 2hPG levels within 12 weeks. Notably, better trends in FPG and 2hPG improvement were observed in the group that practiced high aerobic combined with low resistance, which suggested that a combined exercise intervention with a high frequency of aerobic exercise may offer better potential benefit for glycemic control in MS patients. More long-term prospective studies with larger sample sizes are needed to confirm our findings and to clarify the underlying mechanisms.
Previous studies have suggested that a combination of both aerobic and resistance training is superior to either aerobic or resistance training alone for improving blood pressure [35]. Similar results were also obtained in our study, where although the changes in SBP and DBP were not statistically significant among the four intervention groups, greater reductions were seen in the combination groups than in the individual aerobic and resistance groups. Such reduction in blood pressure is of clinical importance, as it has been reported that small reductions in resting SBP and DBP of 3 mmHg can reduce coronary heart disease risk by 5% and all-cause mortality by 4% [36]. In addition, the high aerobic combined with low resistance training group showed the greatest improvements in SBP and DBP after the exercise intervention. We did not observe any significant differences in the changes of TC, TG, LDL-C, and HDL-C levels among the four intervention groups. It is possible that changes in some metabolic indicators are only observed after a longer period of training than the 12-week period used in the present study. Moreover, these observations also could be related to the fact that the intensity, frequency, and duration of the exercise prescriptions were the same in all intervention groups. However, we observed the trends in blood lipid level improvement in the combined exercise groups were superior to those for the aerobic and resistance exercise groups. Aerobic exercise has traditionally been considered the main mode of exercise that effectively increases HDL-C and reduces TG levels [37, 38]; however, an increasing number of studies has confirmed that resistance training can also improve the lipid profile [39, 40] and provide an alternative to aerobic exercise for individuals with mobility [41]. Adding resistance training to an aerobic exercise plan will supplement and possibly even enhance the effects on the lipid profile. This may explain the trends in blood lipid improvement observed in the HRLAT group in the present study. A review by Tambalis et al. [42] also suggested that some combination exercise prescriptions are more effective at lowering LDL-C levels and increasing HDL-C levels. Consequently, based on the data related to the effects of exercise on cholesterol levels, clinicians should encourage individuals with MS to engage in as much physical activity as possible while, where feasible, highlighting the additional impact of combined aerobic and resistance training to obtain optimal benefits [38].
Our data support the results of previous studies that showed that aerobic, resistance or combination exercise regimens can significantly improve sleep quality among older adults [17, 43, 44]. The mechanisms underlying sleep improvements may be related to the ability of exercise to modulate the endocrine system [45], metabolism [46], circadian rhythm, and body core temperature [47] as well as to increase endorphin and melatonin secretion [48]. Moreover, exercise may improve sleep quality by reducing the resting plasma concentrations of pro-inflammatory cytokines and increasing the plasma concentrations of anti-inflammatory cytokines [17]. Given the older age of the study participants, we designed the aerobic and resistance training to be low to moderate in intensity to induce exercise adaptations while keeping exercise volumes moderate. Using these exercise strategies, we found high aerobic combined with low resistance training produced the greatest improvement in sleep quality in the present study, and a possible explanation is that aerobic exercise requires more concentration and thus more neuronal activity, causing greater brain fatigue. The American National Sleep Foundation suggests that elderly populations complete at least 150 min of aerobic exercise per week to improve sleep quality [49]. Additionally, resistance training is proposed to help elderly individuals fall asleep faster and wake up less frequently throughout the night [50]. The results of our study support these exercise guidelines. Therefore, we suggest that elderly MS patients perform combined aerobic and resistance exercise to improve sleep quality, and recommend that they increase the frequency of aerobic exercise if their physical condition allows.
Our study has several strengths including the randomized controlled trial design, supervised exercise sessions, high adherence rate, modest loss to follow-up, and the use of four different components of combined aerobic and resistance exercise in the combination interventions, allowing us to investigate the effects of different exercise prescriptions on glycolipid metabolism and sleep quality in elderly MS patients. However, several limitations must be noted. First, the interpretability and representativeness of our study are limited by the relatively small sample size; future studies with larger populations are needed to confirm our findings. Second, the intervention duration of our study was relatively short, and a longer exercise intervention might lead to better improvements, which could produce greater differences between groups. Third, we did not perform any follow-up measurements to verify the persistence of the benefits of different exercise prescriptions after the exercise intervention was stopped. Fourth, owing to limited conditions, we did not measure HbA1c, fasting plasma insulin, and skeletal muscle mass. These indicators can help us better understand the beneficial effects of different exercise prescriptions in elderly MS patients. Finally, participants were asked to exercise in a supervised setting, which likely improved participants’ engagement and adherence to the exercise plans; therefore, the results might not be generalizable to a non-supervised population.
The results of this study indicated that 12-week moderate-intensity exercise prescriptions, especially those combining aerobic and resistance exercise, can improve physical fitness, plasma glucose and lipid metabolism, and sleep quality in elderly MS patients. High aerobic combined with low resistance exercise was more effective for improving physical fitness, glycemic control, and sleep quality, whereas high resistance combined with low aerobic exercise resulted in better regulation of blood lipid levels. Accordingly, combined aerobic and resistance exercise prescriptions could be incorporated as a main mode of daily exercise programs for elderly MS patients, with an increased frequency of aerobic exercise providing more health benefits. Clinical practitioners should inform patients of the potential benefits of exercise as they could be a motivating factor for exercising among elderly MS patients.
Acknowledgments
A special acknowledgment is made to all study staff at Taikang nursing home who worked extremely hard to make this study successful. We thank Medjaden Inc. for scientific editing of this manuscript.
Author Contributions
YTL, YZ, JSY, WLW, and YQZ: study concept and design; YQZ and JSY: investigation; YZ, YTL, YQZ, and WTH: analysis and interpretation of data; YZ, YTL, WLW, and WTH: writing-original draft preparation; YZ, YTL, SSL, WLW, and WTH: writing-review and editing. All authors have read and approved the final manuscript.
Funding
The study was supported by the Guangdong Scientific and Technological Development Special Fund (Grant number: 2017A020215108). The funder had no role in the study design, data collection, statistical analysis, or manuscript writing.
Conflicts of Interest
The authors declare that they have no conflict of interest regarding the publication of this article.
Ethics Approval
This study was approved by the medical ethics committee of the institutional review board at the First Affiliated Hospital of Guangdong Pharmaceutical University.
Informed Consent
Written informed consent was obtained from nursing home residents who participated in this study.
Supplemental Table 1
Changes in physical indicators, plasma glucose and lipid metabolism parameters, and sleep quality scores before and after the 12-week exercise intervention
| Variables |
Single exercise groups |
Combined exercise groups |
No intervention |
| AT group (n = 15) |
RT group (n = 17) |
HALRT group (n = 17) |
HRLAT group (n = 17) |
Control group (n = 17) |
| Baseline |
12 weeks |
Change |
Baseline |
12 weeks |
Change |
Baseline |
12 weeks |
Change |
Baseline |
12 weeks |
Change |
Baseline |
12 weeks |
Change |
| BMI (kg/m2) |
24.05 ± 3.00 |
24.16 ± 2.70 |
–0.25 (–0.37, 0.15) |
26.09 ± 3.05 |
26.05 ± 2.90 |
–0.06 (–0.51, 0.44) |
24.54 ± 3.97 |
24.41 ± 3.92 |
–0.11 (–0.31, 0.01) |
24.82 ± 2.92 |
24.62 ± 2.92 |
–0.20 (–0.41, 0.01)* |
24.77 ± 4.27 |
25.05 ± 4.43 |
0.44 (–0.33, 0.76) |
| WC (cm) |
92.40 ± 7.74 |
90.44 ± 7.77 |
–2.00 (–3.00, –1.00)* |
94.53 ± 8.98 |
92.75 ± 8.12 |
–2.00 (–3.50, –0.20) |
91.71 ± 12.43 |
88.26 ± 12.49 |
–4.00 (–5.00, –2.00)** |
92.15 ± 8.26 |
88.41 ± 7.96 |
–3.50 (–5.00, –3.00)** |
89.80 ± 11.85 |
90.18 ± 11.05 |
1.00 (–0.90, 2.00) |
| SBP (mmHg) |
137.73 ± 17.68 |
131.33 ± 12.43 |
–7.00 (–8.00, –5.00)** |
130.47 ± 12.59 |
125.52 ± 9.08 |
–4.0 (–10.00, –6.50)** |
136.41 ± 10.83 |
125.52 ± 8.11 |
–9.0 (–16.00, –9.00) ** |
130.58 ± 14.60 |
120.29 ± 10.49 |
–8.0 (–13.00, –6.50)** |
131.64 ± 14.55 |
131.58 ± 11.40 |
–2.0 (–5.50, 8.00) |
| DBP (mmHg) |
71.13 ± 11.51 |
71.53 ± 6.47 |
–4.0 (–5.00, 4.00) |
72.35 ± 5.94 |
71.00 ± 4.73 |
–2.00 (–4.00, 0.50) |
73.05 ± 6.06 |
67.29 ± 3.70 |
–5.0 (–8.50, –1.50) ** |
71.58 ± 7.81 |
68.29 ± 6.23 |
–3.0 (–5.50, –1.50) ** |
69.29 ± 6.57 |
71.11 ± 6.13 |
2.0 (–2.50, 6.50) |
| HGS (kg) |
21.86 ± 5.95 |
22.78 ± 5.86 |
0.70 (0.30, 1.50)** |
26.42 ± 5.70 |
27.43 ± 5.65 |
1.10 (0.35, 1.40)** |
22.48 ± 7.43 |
24.46 ± 7.22 |
2.00 (1.25, 2.25)** |
23.92 ± 5.47 |
26.28 ± 6.35 |
1.70 (1.00, 3.10)** |
21.88 ± 4.72 |
21.26 ± 5.27 |
–0.90 (–2.25, 0.85) |
| FPG (mmol/L) |
6.13 ± 0.81 |
5.94 ± 0.69 |
–0.19 (–0.32, –0.10) * |
6.19 ± 0.92 |
5.94 ± 0.99 |
–0.28 (–0.41, –0.16) * |
6.57 ± 1.46 |
6.02 ± 1.15 |
–0.56 (–0.79, –0.35) ** |
6.57 ± 1.05 |
5.92 ± 0.71 |
–0.64 (–1.02, –0.35) * |
6.19 ± 1.42 |
6.39 ± 1.37 |
0.24 (0.00, 0.51) |
| 2hPG (mmol/L) |
7.78 ± 2.20 |
7.36 ± 1.85 |
–0.42 (–0.63, –0.21) * |
8.27 ± 2.53 |
7.93 ± 2.14 |
–0.37 (–0.66, –0.09) * |
8.30 ± 2.12 |
7.28 ± 1.38 |
–1.11 (–1.56, –0.09) ** |
7.78 ± 2.17 |
6.78 ± 1.14 |
–1.09 (–1.70, –0.58) * |
7.06 ± 1.62 |
7.31 ± 1.71 |
0.34 (–0.01, 0.76) |
| TC (mmol/L) |
4.99 ± 1.14 |
4.78 ± 1.16 |
–0.21 (–0.51, 0.03) |
4.40 ± 1.08 |
4.18 ± 1.01 |
–0.22 (–0.47, 0.01) |
5.08 ± 1.18 |
4.44 ± 0.96 |
–0.64 (–0.97, –0.37) ** |
4.87 ± 1.16 |
4.28 ± 0.81 |
–0.59 (–0.86, –0.35) ** |
4.70 ± 0.84 |
5.18 ± 1.01 |
0.48 (0.18, 0.81) * |
| TG (mmol/L) |
1.71 ± 1.11 |
1.53 ± 0.70 |
–0.18 (–0.49, 0.05) |
1.27 ± 0.72 |
1.15 ± 0.61 |
–0.13 (–0.30, 0.03) |
1.72 ± 0.88 |
1.48 ± 0.70 |
–0.25 (–0.45, –0.08) * |
1.79 ± 1.02 |
1.54 ± 0.82 |
–0.22 (–0.43, –0.01) * |
1.67 ± 0.83 |
1.95 ± 1.15 |
0.29 (–0.05, 0.72) |
| HDL–C (mmol/L) |
1.43 ± 0.36 |
1.42 ± 0.32 |
–0.01 (–0.06, 0.04) |
1.39 ± 0.30 |
1.39 ± 0.42 |
–0.01 (–0.12, 0.12) |
1.43 ± 0.35 |
1.50 ± 0.36 |
0.04 (–0.05, 0.13) |
1.42 ± 0.39 |
1.51 ± 0.49 |
0.07 (–0.02, 0.01) |
1.38 ± 0.25 |
1.34 ± 0.22 |
–0.04 (–0.10, 0.01) |
| LDL-C (mmol/L) |
3.45 ± 0.94 |
3.39 ± 1.08 |
–0.06 (–0.40, 0.24) |
2.84 ± 0.99 |
2.69 ± 0.82 |
–0.21 (–0.49, 0.03) |
3.50 ± 1.23 |
2.88 ± 0.94 |
–0.51 (–0.82, –0.23) * |
3.21 ± 1.10 |
2.67 ± 0.81 |
–0.39 (–0.64, –0.18) * |
3.06 ± 0.66 |
3.55 ± 0.86 |
0.52 (0.23, 0.81) ** |
| PSQI (points) |
11.66 ± 3.13 |
7.20 ± 2.17 |
–4.47 (–6.07, –2.73) ** |
11.88 ± 3.23 |
7.76 ± 1.85 |
–4.20 (–5.07, –3.33) ** |
13.76 ± 3.30 |
6.05 ± 1.78 |
–7.93 (–6.67, –5.93) ** |
12.58 ± 3.57 |
7.23 ± 2.38 |
–5.87 (–7.67, –3.87) ** |
12.11 ± 3.46 |
11.29 ± 3.54 |
–1.47 (–4.00, 1.13) |
Data are presented as mean ± SD.
*p < 0.05, **p < 0.01 for significant difference between pre- and post-intervention results.
AT, aerobic training; RT, resistance training; HALRT, high aerobic and low resistance training; HRLAT, high resistance and low aerobic training; BMI, body mass index; WC, waist circumference; SBP, systolic blood pressure; DBP, diastolic blood pressure; HGS, handgrip strength; FPG, fasting plasma glucose; 2hPG, two-hour postprandial blood glucose; TC, total cholesterol; TG, triglycerides; HDL, high-density lipoprotein cholesterol; LDL, low-density lipoprotein cholesterol; PSQI, Pittsburgh Sleep Quality Index.
References
- 1 Sperling LS, Mechanick JI, Neeland IJ, Herrick CJ, Després JP, et al. (2015) The cardiometabolic health alliance: working toward a new care model for the metabolic syndrome. J Am Coll Cardiol 66: 1050–1067.
- 2 Alberti KG, Eckel RH, Grundy SM, Zimmet PZ, Cleeman JI, et al. (2009) Harmonizing the metabolic syndrome: a joint interim statement of the International Diabetes Federation Task Force on Epidemiology and Prevention; National Heart, Lung, and Blood Institute; American Heart Association; World Heart Federation; International Atherosclerosis Society; and International Association for the Study of Obesity. Circulation 120: 1640–1645.
- 3 Cepeda FX, Toschi-Dias E, Maki-Nunes C, Rondon MU, Alves MJ, et al. (2015) Obstructive sleep apnea impairs postexercise sympathovagal balance in patients with metabolic syndrome. Sleep 38: 1059–1066.
- 4 Hanley AJ, Karter AJ, Williams K, Festa A, D’Agostino RB Jr, et al. (2005) Prediction of type 2 diabetes mellitus with alternative definitions of the metabolic syndrome: the Insulin Resistance Atherosclerosis Study. Circulation 112: 3713–3721.
- 5 Osei K, Gaillard T (2017) Disparities in cardiovascular disease and type 2 diabetes risk factors in blacks and whites: dissecting racial paradox of metabolic syndrome. Front Endocrinol (Lausanne) 8: 204.
- 6 Sasai-Sakuma T, Takeuchi N, Asai Y, Inoue Y, Inoue Y (2020) Prevalence and clinical characteristics of REM sleep behavior disorder in Japanese elderly people. Sleep 43: zsaa024.
- 7 Saklayen MG (2018) The global epidemic of the metabolic syndrome. Curr Hypertens Rep 20: 12.
- 8 Li R, Li W, Lun Z, Zhang H, Sun Z, et al. (2016) Prevalence of metabolic syndrome in Mainland China: a meta-analysis of published studies. BMC Public Health 16: 296.
- 9 Einarson TR, Acs A, Ludwig C, Panton UH (2018) Economic burden of cardiovascular disease in type 2 diabetes: a systematic review. Value Health 21: 881–890.
- 10 Avogaro A (2012) Treating diabetes today with gliclazide MR: a matter of numbers. Diabetes Obes Metab 14 Suppl 1: 14–19.
- 11 Brown BG, Stukovsky KH, Zhao XQ (2006) Simultaneous low-density lipoprotein-C lowering and high-density lipoprotein-C elevation for optimum cardiovascular disease prevention with various drug classes, and their combinations: a meta-analysis of 23 randomized lipid trials. Curr Opin Lipidol 17: 631–636.
- 12 Lee H, Cho J, Shin DW, Lee SP, Hwang SS, et al. (2015) Association of cardiovascular health screening with mortality, clinical outcomes, and health care cost: a nationwide cohort study. Prev Med 70: 19–25.
- 13 Siopi A, Deda O, Manou V, Kosmidis I, Komninou D, et al. (2019) Comparison of the serum metabolic fingerprint of different exercise modes in men with and without metabolic syndrome. Metabolites 9: 116.
- 14 Roberts CK, Hevener AL, Barnard RJ (2013) Metabolic syndrome and insulin resistance: underlying causes and modification by exercise training. Compr Physiol 3: 1–58.
- 15 Ostman C, Smart NA, Morcos D, Duller A, Ridley W, et al. (2017) The effect of exercise training on clinical outcomes in patients with the metabolic syndrome: a systematic review and meta-analysis. Cardiovasc Diabetol 16: 110.
- 16 Sigal RJ, Kenny GP, Boulé NG, Wells GA, Prud’homme D, et al. (2007) Effects of aerobic training, resistance training, or both on glycemic control in type 2 diabetes: a randomized trial. Ann Intern Med 147: 357–369.
- 17 Yang PY, Ho KH, Chen HC, Chien MY (2012) Exercise training improves sleep quality in middle-aged and older adults with sleep problems: a systematic review. J Physiother 58: 157–163.
- 18 Sallis RE (2009) Exercise is medicine and physicians need to prescribe it! Br J Sports Med 43: 3–4.
- 19 Pescatello LS, Arena R, Riebe D, Thompson PD (eds) (2014) ACSM’s guidelines for exercise testing and prescription (9th). Wolters Kluwer/Lippincott Williams & Wilkins Health. Philadelphia, USA.
- 20 WHO Guidelines Approved by the Guidelines Review Committee (2010) In: Global Recommendations on Physical Activity for Health. World Health Organization. Geneva, Switzerland.
- 21 Dieli-Conwright CM, Courneya KS, Demark-Wahnefried W, Sami N, Lee K, et al. (2018) Effects of aerobic and resistance exercise on metabolic syndrome, sarcopenic obesity, and circulating biomarkers in overweight or obese survivors of breast cancer: a randomized controlled trial. J Clin Oncol 36: 875–883.
- 22 Earnest CP, Johannsen NM, Swift DL, Gillison FB, Mikus CR, et al. (2014) Aerobic and strength training in concomitant metabolic syndrome and type 2 diabetes. Med Sci Sports Exerc 46: 1293–1301.
- 23 Chinese Diabetes Society (2018) Prevention and treatment guidelines for type 2 diabetes in China (2017 Edition) Zhonghua Tang Niao Bing Za Zhi 10: 4–67 (In Chinese).
- 24 Borg GA (1982) Psychophysical bases of perceived exertion. Med Sci Sports Exerc 14: 377–381.
- 25 Liu XC, Tang MQ (1996) Reliability and validity of the pittsburgh sleep quality index. Chinese Journal of Psychiatry 29: 103–107 (In Chinese).
- 26 Timmons JF, Minnock D, Hone M, Cogan KE, Murphy JC, et al. (2018) Comparison of time‐matched aerobic, resistance, or concurrent exercise training in older adults. Scand J Med Sci Sports 28: 2272–2283.
- 27 Ziaaldini MM, Marzetti E, Picca A, Murlasits Z (2017) Biochemical pathways of sarcopenia and their modulation by physical exercise: a narrative review. Front Med (Lausanne) 4: 167.
- 28 Ho SS, Dhaliwal SS, Hills AP, Pal S (2012) The effect of 12 weeks of aerobic, resistance or combination exercise training on cardiovascular risk factors in the overweight and obese in a randomized trial. BMC Public Health 12: 704.
- 29 Stuart CA, Howell ME, Baker JD, Dykes RJ, Duffourc MM, et al. (2010) Cycle training increased GLUT4 and activation of mammalian target of rapamycin in fast twitch muscle fibers. Med Sci Sports Exerc 42: 96–106.
- 30 Cartee GD (2015) Mechanisms for greater insulin-stimulated glucose uptake in normal and insulin-resistant skeletal muscle after acute exercise. Am J Physiol Endocrinol Metab 309: E949–E959.
- 31 Šarabon N, Kozinc Ž, Löfler S, Hofer C (2020) Resistance exercise, electrical muscle stimulation, and whole-body vibration in older adults: systematic review and meta-analysis of randomized controlled trials. J Clin Med 9: 2902.
- 32 Evans PL, McMillin SL, Weyrauch LA, Witczak CA (2019) Regulation of skeletal muscle glucose transport and glucose metabolism by exercise training. Nutrients 11: 2432.
- 33 Sparks LM, Johannsen NM, Church TS, Earnest CP, Moonen-Kornips E, et al. (2013) Nine months of combined training improves ex vivo skeletal muscle metabolism in individuals with type 2 diabetes. J Clin Endocrinol Metab 98: 1694–1702.
- 34 Meex RC, Schrauwen-Hinderling VB, Moonen-Kornips E, Schaart G, Mensink M, et al. (2010) Restoration of muscle mitochondrial function and metabolic flexibility in type 2 diabetes by exercise training is paralleled by increased myocellular fat storage and improved insulin sensitivity. Diabetes 59: 572–579.
- 35 Schroeder EC, Franke WD, Sharp RL, Lee DC (2019) Comparative effectiveness of aerobic, resistance, and combined training on cardiovascular disease risk factors: a randomized controlled trial. PLoS One 14: e0210292.
- 36 Lewington S, Clarke R, Qizilbash N, Peto R, Collins R (2002) Age-specific relevance of usual blood pressure to vascular mortality: a meta-analysis of individual data for one million adults in 61 prospective studies. Lancet 360: 1903–1913.
- 37 Leon AS, Sanchez OA (2001) Response of blood lipids to exercise training alone or combined with dietary intervention. Med Sci Sports Exerc 33: S502–S515; discussion S528–S529.
- 38 Mann S, Beedie C, Jimenez A (2014) Differential effects of aerobic exercise, resistance training and combined exercise modalities on cholesterol and the lipid profile: review, synthesis and recommendations. Sports Med 44: 211–221.
- 39 Sheikholeslami Vatani D, Ahmadi S, Ahmadi Dehrashid K, Gharibi F (2011) Changes in cardiovascular risk factors and inflammatory markers of young, healthy, men after six weeks of moderate or high intensity resistance training. J Sports Med Phys Fitness 51: 695–700.
- 40 Lira FS, Yamashita AS, Uchida MC, Zanchi NE, Gualano B, et al. (2010) Low and moderate, rather than high intensity strength exercise induces benefit regarding plasma lipid profile. Diabetol Metab Syndr 2: 31.
- 41 Brooks N, Layne JE, Gordon PL, Roubenoff R, Nelson ME, et al. (2006) Strength training improves muscle quality and insulin sensitivity in Hispanic older adults with type 2 diabetes. Int J Med Sci 4: 19–27.
- 42 Tambalis K, Panagiotakos DB, Kavouras SA, Sidossis LS (2009) Responses of blood lipids to aerobic, resistance, and combined aerobic with resistance exercise training: a systematic review of current evidence. Angiology 60: 614–632.
- 43 Varrasse M, Li J, Gooneratne N (2015) Exercise and Sleep in Community-Dwelling Older Adults. Curr Sleep Med Rep 1: 232–240.
- 44 Akbari Kamrani AA, Shams A, Shamsipour Dehkordi P, Mohajeri R (2014) The effect of low and moderate intensity aerobic exercises on sleep quality in men older adults. Pak J Med Sci 30: 417–421.
- 45 Tuckow AP, Rarick KR, Kraemer WJ, Marx JO, Hymer WC, et al. (2006) Nocturnal growth hormone secretory dynamics are altered after resistance exercise: deconvolution analysis of 12-hour immunofunctional and immunoreactive isoforms. Am J Physiol Regul Integr Comp Physiol 291: R1749–R1755.
- 46 Scheen AJ, Byrne MM, Plat L, Leproult R, Van Cauter E (1996) Relationships between sleep quality and glucose regulation in normal humans. Am J Physiol 271: E261–E270.
- 47 Murphy PJ, Campbell SS (1997) Nighttime drop in body temperature: a physiological trigger for sleep onset? Sleep 20: 505–511.
- 48 Taheri M, Irandoust K (2018) The exercise-induced weight loss improves self-reported quality of sleep in obese elderly women with sleep disorders. Sleep Hypn 20: 54–59.
- 49 Muthy KK, Womack JP (2017) Does exercise promote sleep in the elderly? Evid-Based Pract 20: 10.
- 50 Bonardi JM, Lima LG, Campos GO, Bertani RF, Moriguti JC, et al. (2016) Effect of different types of exercise on sleep quality of elderly subjects. Sleep Med 25: 122–129.
