ORIGINAL
Characteristic gene prognostic model of type 1 diabetes mellitus via machine learning strategy
2023 Volume 70 Issue 3 Pages 281-294

Details
2023 Volume 70 Issue 3 Pages 281-294
The present study was designed to detect possible biomarkers associated with Type 1 diabetes mellitus (T1DM) incidence in an effort to develop novel treatments for this condition. Three mRNA expression datasets of peripheral blood mononuclear cells (PBMCs) were obtained from the GEO database. Differentially expressed genes (DEGs) between T1DM patients and healthy controls were identified by Limma package in R, and using the DEGs to conduct GO and DO pathway enrichment. The LASSO—SVM were used to screen the hub genes. We performed immune correlation analysis of hub genes and established a T1DM prognosis model. CIBERSORT algorithm was used to identify the different immune cells in distribution between T1DM and normal samples. The correlation of the hub genes and immune cells was analyzed by Spearman. ROC curves were used to assess the diagnostic value of genes in T1DM. A total of 60 immune related DEGs were obtained from the T1DM and normal samples. Then, DEGs were further screened to obtain 3 hub genes, ANP32A-IT1, ESCO2 and NBPF1. CIBERSORT analysis revealed the percentage of immune cells in each sample, indicating that there was significant difference in monocytes, T cells CD8+, gamma delta T cells, naive CD4+ T cells and activated memory CD4+ T cells between T1DM and normal samples. The area under curve (AUC) of ESCO2, ANP32A-IT1 and NBPF1 were all greater than 0.8, indicating that these three genes have high diagnostic value for T1DM. Together, the findings of these bioinformatics analyses thus identified key hub genes associated with T1DM development.
ACCORDING TO the International Diabetes Federation (IDF), about 463 million people worldwide had diabetes in 2019, which is forecasted to rise to 578 million by 2030 and 700 million by 2045 [1]. T1DM is one of the most common chronic diseases in children and teenagers which can start at any age. The incidence and prevalence of T1DM continue to rise, accounting for approximately 5% to 10% of people with diabetes [2]. T1DM is an organ-specific autoimmune disease in which progressive damage to islet beta cells is mediated by genetic and environmental factors, resulting in absolute insulin deficiency [3]. Patients need to rely on exogenous insulin throughout their lives [4]. T1DM has the following characteristics: the age is usually less than 30 years old; polydipsia, polyphagia, polyuria and obvious weight loss; frequent onset of ketosis or ketoacidosis; non-obesity; significantly decreased serum C-peptide concentration on fasting or postprandial. Self-immune markers for pancreatic island were found, such as glutamic acid decarboxylase antibody (GADA), islet cell antibody (ICA), islet cell antigen 2 antibody (IA-2A), zinc transporter 8 antibody (ZnT8A), etc. If the treatment is not appropriate or insufficient, serious complications will occur and even lead to death, which may affect the quality of life and aggravate the economic burden.
In order to understand the pathogenesis of T1DM, extensive studies have been conducted. It has been found that immune response might participate in the pathogenesis of T1DM, in which the synergistic action of multiple immune-related genes and multiple immune cells play an important role [5-9].
However, the roles of immune-related genes and immune cells in T1DM and their associations have not been fully studied. The current study aimed to explore early diagnostic biomarker and their biological functions in T1DM via bioinformatics analysis. This study may provide evidence for early diagnosis and treatment of type 1 diabetes.
We obtained a total of 102 samples (61 female/41 male) matched for age, sex and body mass index from 3 datasets. Among them, the T1D group (according to American Diabetes Association criteria [10]), 52 patients with recent-onset T1D (≤6 months after diagnosis), expressed at least one islet autoantibody. And the control group with 50 patients were islet autoantibody-negative healthy controls without inflammation or family history of autoimmune disease or concomitant medications. The raw gene expression profile datasets (GSE55098, GSE156035, GSE193273) were obtained from the National Center of Biotechnology Information (NCBI) GEO database (http://www.ncbi.nlm.nih.gov/geo/).
The samples for these data were the PBMCs. The data of GSE55098 from the GPL570 platform included 12 T1DM patients and 10 normal controls. Similarly, the data of GSE156035 were from GPL20844 platform. The gene microarray data were collected from 20 T1DM patients and 20 healthy controls. The GSE193273 data were obtained from the GPL20844 platform. PBMCs of 20 T1DM patients and 20 healthy controls from the GSE193273 dataset analyzed. To construct the expression matrix, we preprocessed all the data by the affy R package with Robust Multichip Averaging (RMA) algorithm. Then, we used the impute package with k-Nearest Neighbor (KNN) algorithm to calculate missing values and removed batch effects by Sva package with Combat algorithm.
Identification of immune‑related DEGsThe genomic expression data from GSE55098 and GSE156035 were integrated for the analysis, and the TXT format data were processed in R with sva package to identify and remove batch effects of high-throughput data. The Limma package in Bioconductor was used to identify DEGs by comparing the expression values between T1DM patients and normal controls. The corresponding p values of the gene symbols after t test were used, and adjusted p < 0.05 (after false discovery rate correction) and [logFC] >0.58 were used as the selection criteria. We used pheatmap package to draw a heatmap and ggrepel package to draw a volcano plot of the DEGs in R software.
Analyses of the GO and DOGene Ontology (GO; http://www.geneontology.org) is a community-based bioinformatics resource that uses ontologies to provide information about the function of gene products to represent biological knowledge. The Human Disease Ontology (DO; http://www.disease-ontology.org) includes a broad range of common and rare diseases. The DO disease classification includes specific formal-semantic rules to express meaningful disease models, and uses a directed acyclic graph (DAG) to represent disease etiology classes. To further explore the biological significance of DEGs, we used a package called clusterprofler to analyze and visualize data for enrichment analysis of functions and pathways. In GO and DO analysis, we obtained enrichment information of DEGs. In addition, bar graph and bubble charts were plotted by using R software with the ggplot2 package.
Analyses of LASSO and SVMBy constructing a penalty function, the least absolute shrinkage and selection operator (LASSO) can compress variable coefficients and assign some regression coefficients as 0, thereby achieving the purpose of variable selection [11]. To screen the gene signatures, 60 immune-related DEGs (Supplementary Table 1) were subjected to LASSO regression analysis by using the glmnet package in R (Supplementary Table 2). Supervised machine learning techniques by using support vector machines (SVM) were widely used in pattern recognition and classification, which have been used to predict the category of a new gene [12]. SVM was also used to screen the gene signatures (Supplementary Table 3). The overlapping genes after LASSO and SVM analyses were used as the hub genes. Hub gene is a gene that plays a crucial role in biological processes. In related pathways, the regulation of other genes is often affected by this gene.
Validation of hub genesThe key genes were identified as the intersecting genes of the analyses of LASSO and SVM hub genes. These data were obtained from GEO database, and validation was performed by R package. The Venn diagram was drawn by using a venn package in R to overlap the hub genes.
Using GSE193273 to validate gene expression distribution of profilesThe established prognostic prediction model was validated by using a GEO dataset (GSE193273), and the ROC curve. The boxplots were drawn by using ggpubr package and ROC curves were drawn by using ROC package in R.
ROC prognostic model establishmentThe candidate prognostic model was established via different machine learning models and the accuracy of each model was detected by performing the receiver characteristic operator curve (ROC) analysis. Then the model with the highest value of area under curve (AUC) among all candidate models was selected as the prognostic model for further analysis.
CIBERSORT analysisCIBERSORT algorithm could quantify the abundance of specific cell types [13]. To compare the difference in immune cells between T1DM samples and normal samples, the CIBERSORT analysis (https://cibersort.stanford.edu) was used to estimate the percentage of LM22 (22 immune cell types) in each sample. Moreover, the fraction of 22 immune cells was compared between T1DM samples and normal samples, the violin plot and bar plot was drawn by vioplot and barplot package in R.
Correlation analysis of immune cells and the hub genesThe method of correlation test tests the correlation between the expression of our genes and the content of immune cells. If the p value of the correlation test is less than 0.05, it indicates that the expression of our target genes is correlated with the content of immune cells.
Statistical analysisThe Wilcox test was used to compare the fraction of the immune cells between T1DM samples and normal samples in CIBERSORT analysis. ROC curves were used to assess the diagnostic value of genes in T1DM. The higher the AUC value is, the stronger the diagnostic value will be p < 0.05 was considered as statistically significant.
A total of 60 DEGs between the T1DM samples and normal samples were screened out, including 37 up-regulated genes and 23 down-regulated genes. The distribution of the DEGs was displayed by the volcano plot (Fig. 1A), and the expression of the DEGs in each sample were shown in Fig. 1B.

(A) 60 DEGs between the T1DM samples and normal samples. Heatmap; (B) 60 DEGs between the T1DM samples and normal samples. Volcano plot
To further investigate the functions of the immune-related DEGs, GO and DO analyses were performed. Adjust p value <0.05 was considered to be statistically significant, and count value refers to the number of genes enriched in the pathway. The GO terms with the 5 top genes enrichment were response to molecule of bacterial origin (adjust p value = 0. 013, count = 7), response to lipopolysaccharide (adjust p value = 0.028, count = 6), cellular response to lipopolysaccharide (adjust p value = 0.028, count = 5), cellular response to molecule of bacterial origin (adjust p value = 0.028, count = 5) and cellular response to biotic stimulus (adjust p value = 0.031, count = 5) (Fig. 2A and 2B). In addition, the analysis of disease ontology (DO) showed that the top 4 description was associated with autosomal dominant disease (p = 0.009, count = 5), stomach carcinoma (p = 0.013, count = 3), hereditary breast ovarian cancer (p = 0.034, count = 3) and chronic leukemia (p = 0.035, count = 3) (Fig. 2C and 2D).
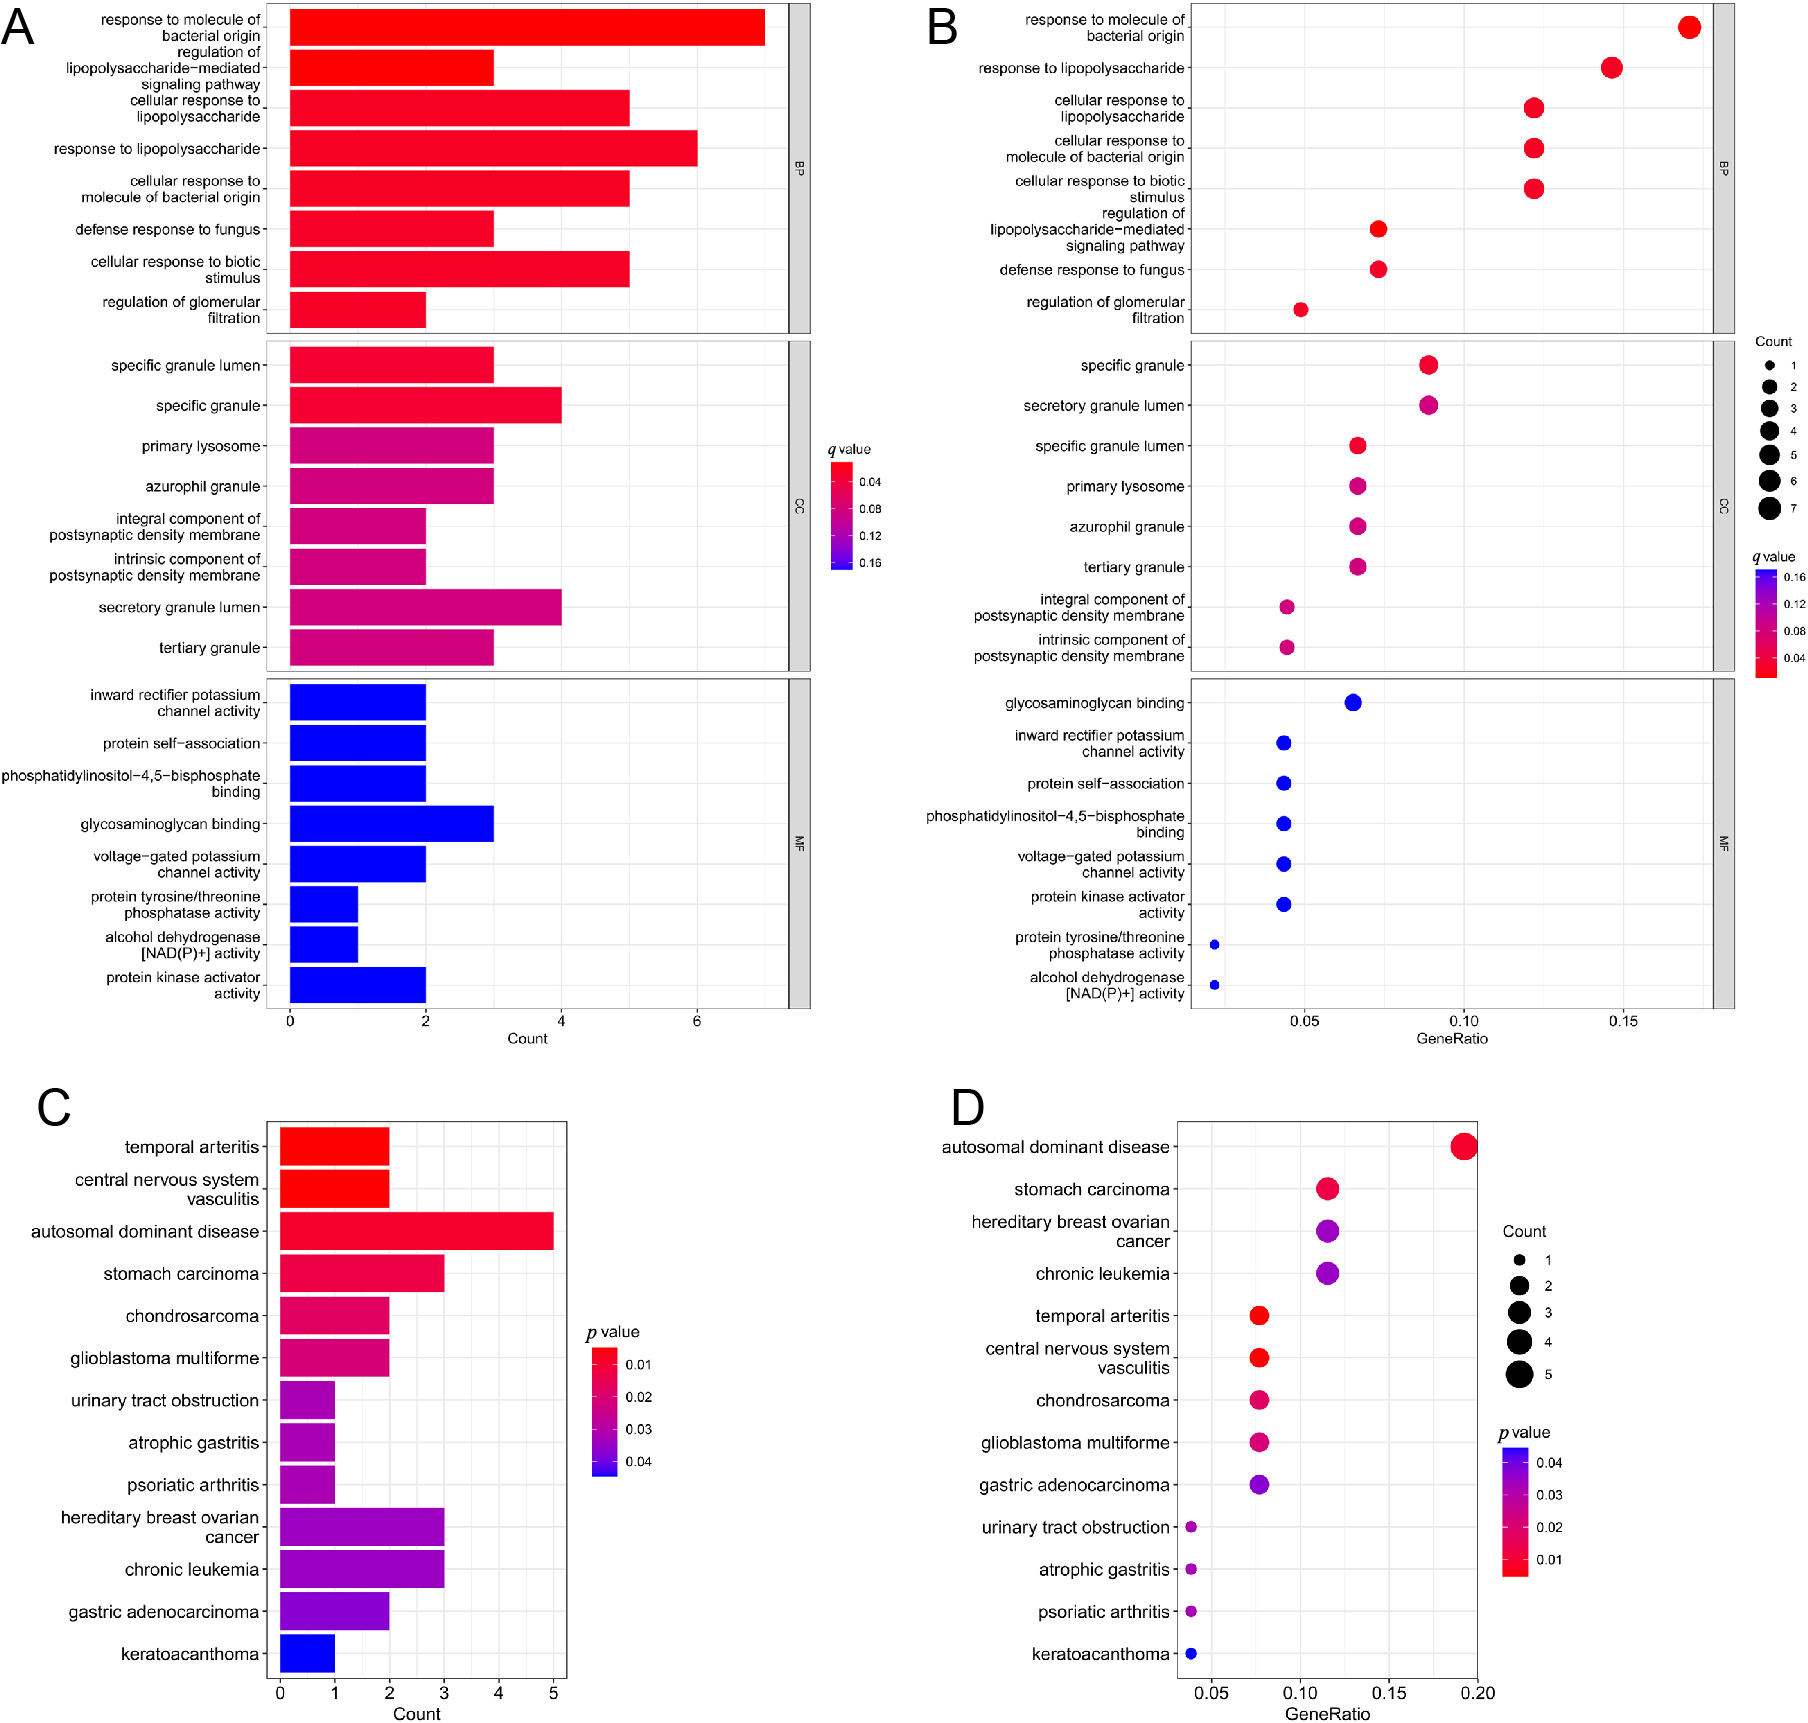
(A) Raw identification and functional enrichment analysis of the immune-related DEGs. GO terms Barplot; (B) Raw identification and functional enrichment analysis of the immune-related DEGs.GO terms bubble; (C) Raw identification and functional enrichment analysis of the immune-related DEGs. DO analysis; (D) DO analysis
To identify immune-related hub genes, the LASSO regression analysis for the 60 immune-related DEGs was performed to screen the gene signatures and 14 gene signatures were found (Fig. 3A). Besides, the SVM for the 60 immune-related DEGs was also used to screen gene signatures, and 6 gene signatures were found (Fig. 3B). Subsequently, the 14 gene signatures identified by LASSO were overlapped with the 6 gene signatures identified by the SVM by using a venn diagram and ultimately were obtained [ANP32AIT1, ESCO2 and NBPF1, Fig. 3C]. The 3 hub genes were considered as the optimal immune-related biomarkers.
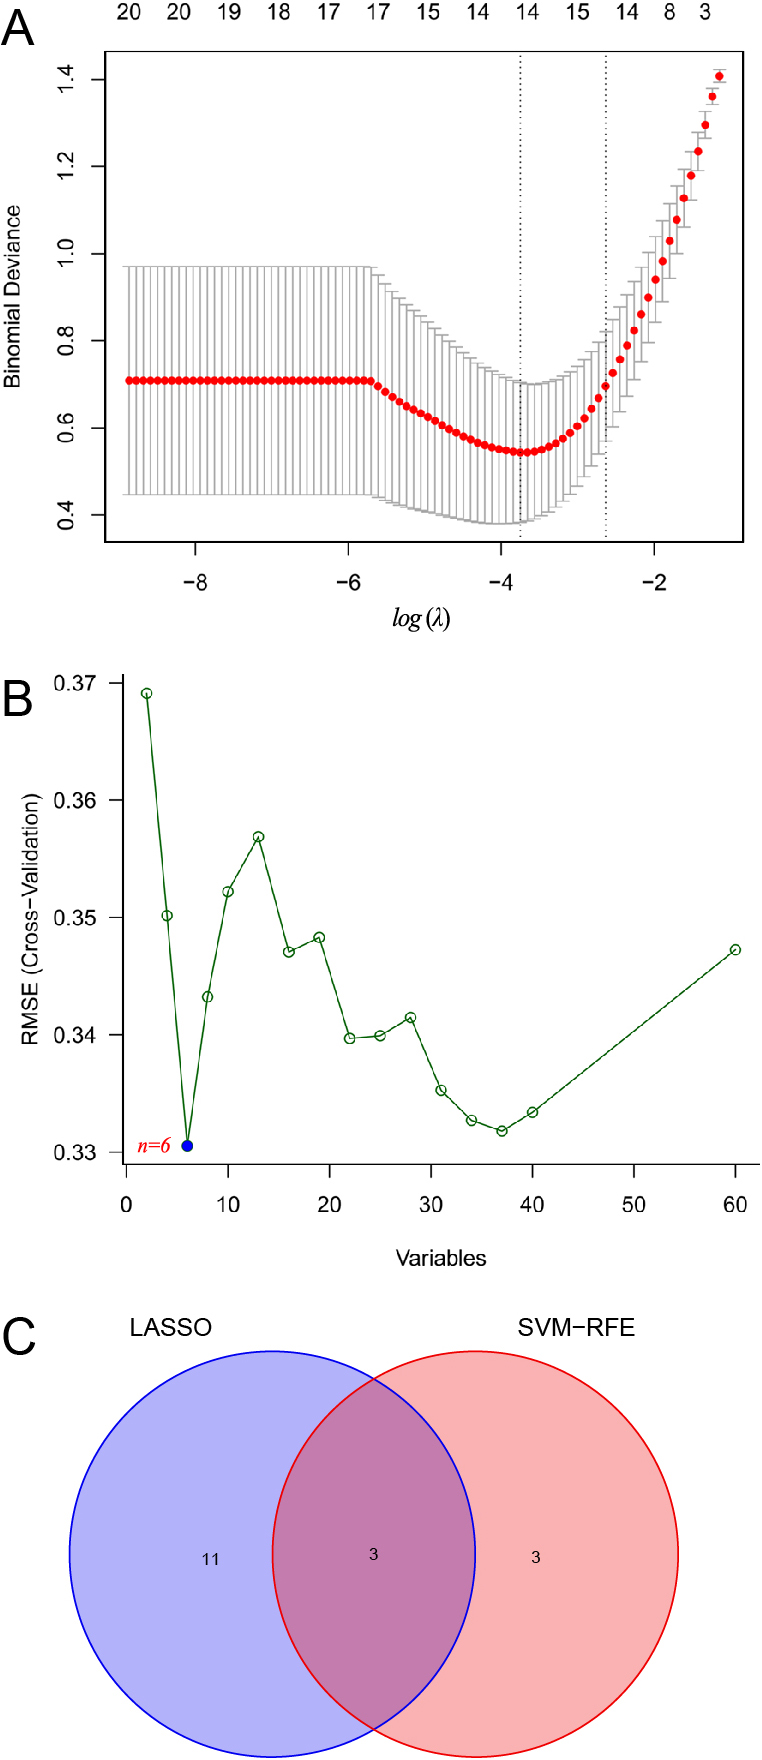
(A) Identifcation of the optimal immune-related biomarkers. LASSO regression analysis; (B) SVM analysis: n = 6 means that SVM identifies 6 genes with the smallest mean square error and the optimal degree of fit; (C) Venn diagram of overlapping
Consistent with previous results, we found that ANP32A-IT1 (p = 5.2e-05, Fig. 4A), ESCO2 (p = 2.4e-06, Fig. 4B) and NBPF1 (p = 4.1e-06, Fig. 4C) were also differentially expressed in GSE193273. It was suggested that high expression of these 3 genes were significantly associated with favorable prognosis in T1DM.
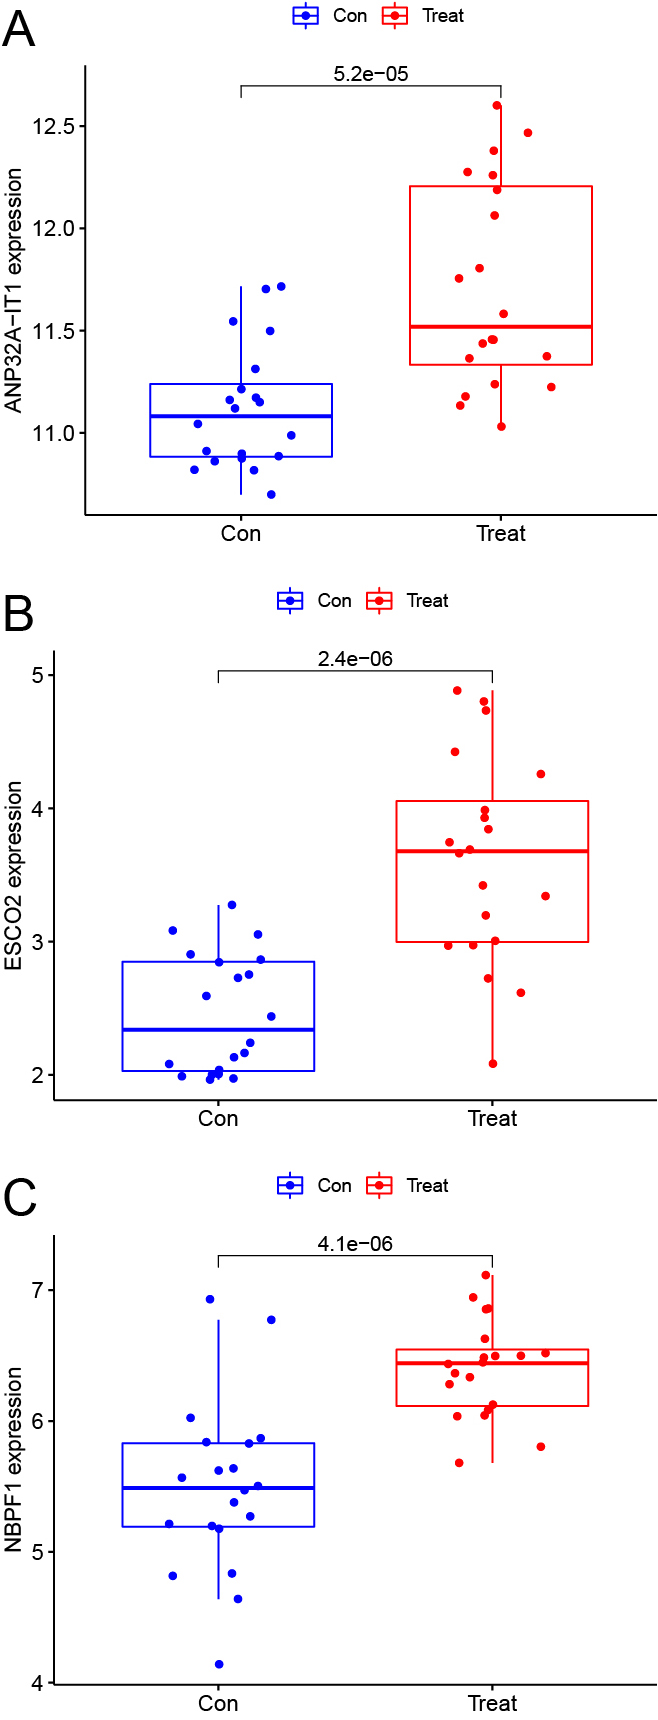
(A) Validate boxplot. ANP32A-IT1; (B) Boxplot. ESCO2; (C) Boxplot. NBPF1
To explore the accuracy of the ANP32A-IT1, NBPF1 and ESCO2 as the diagnostic biomarkers for T1DM, the ROC curves were plotted, respectively. The AUC was 0.882 (ANP32A-IT1, Fig. 5A), 0.811 (ESCO2, Fig. 5B) and 0.861 (NBPF1, Fig. 5C), suggesting that ANP32A-IT1 possessed a higher accuracy than NBPF1 and ESCO2 in the diagnosis of T1DM.
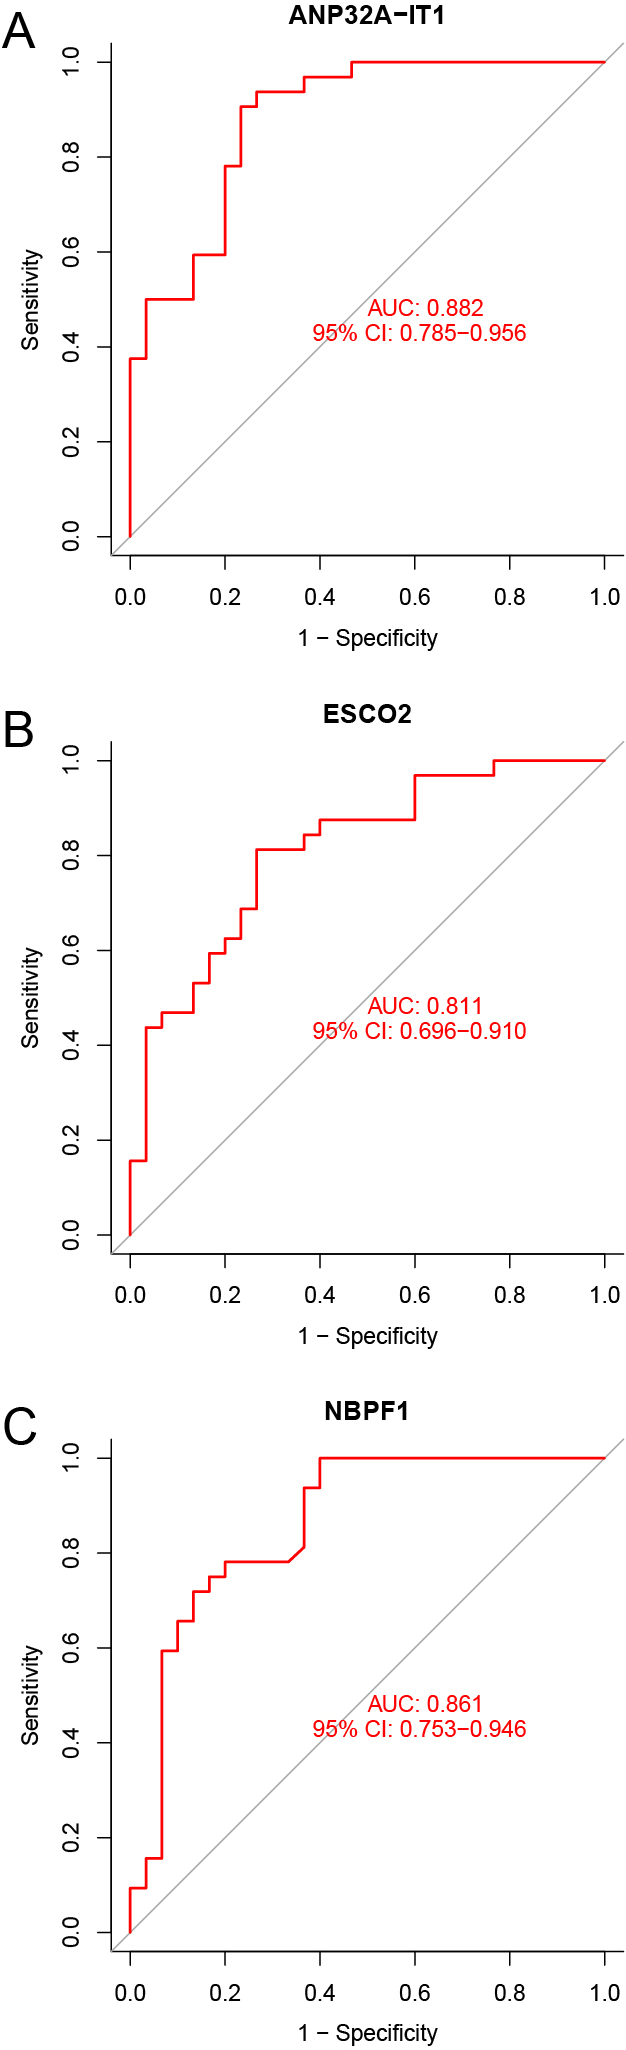
(A) The ROC curves. ANP32A-IT1; (B) The ROC curves. ESCO2; (C) The ROC curves. NBPF1
In order to further verify the role of ANP32A-IT1, NBPF1 and ESCO2 as diagnostic markers of T1DM, we conducted ROC analysis of these genes in the expression data set GSE193273 and the ROC curve was plotted. Results of ROC analysis revealed that the AUC was 0.855 (ANP32A-IT1, Fig. 6A), 0.902 (ESCO2, Fig. 6B) and 0.895 (NBPF1, Fig. 6C), suggesting that these 3 genes could be used as diagnostic markers for T1DM.

(A) The test ROC curves. ANP32A-IT1; (B) The test ROC curves. ESCO2; (C) The test ROC curves. NBPF1
To further investigate the correlation of the hub genes with immune cells, the distribution of the 62 immune cells in T1DM and normal samples was analyzed by the CIBERSORT algorithm. Fig. 7A showed the percentage of immune cells in each sample, revealing that monocytes, CD8+ T cells, gamma delta T cells, naive CD4+ T cells and activated memory CD4+ T cells had a larger proportion. The proportion of the immune cells in each sample was displayed by a heatmap (Fig. 7B). Gamma delta T cells was negatively correlated with the monocytes (r = –0.55). Activated memory CD4+ T cells were negatively correlated with the monocytes (r = –0.55). CD8+ T cells were negatively correlated with monocytes (r = –0.51). Activated dendritic cells were positively correlated with activated NK cells (r = 0.61). Activated memory CD4+ T cells were positively correlated with T cells CD8+ (r = 0.51). Activated memory CD4+ T cells were positively correlated with M1 macrophages (r = 0.48). Resting dendritic cells were positively correlated with activated NK cells (r = 0.48). According to statistical results, the proportion of neutrophils in the control group was significantly higher than that in the treatment group (p = 0.009), while the ratios of CD8+ T cells (p = 0.026) and gamma delta T cells (p = 0.047) were significantly lower than those in the control group (Fig. 7C). The results above suggested that these differential immune cells might be involved in the immune regulation process of T1DM pathogenesis.

(A) Distribution of immune cells between T1DM and normal samples. A percentage of immune cells in each sample; (B) Heatmap; (C) Vioplot
The expression of NBPF1 gene was positively correlated with the content of memory B cells (Fig. 8A: r = 0.27, p = 0.033). The expression of NBPF1 gene was negatively correlated with the content of eosinophils (Fig. 8B: r = –0.35, p = 0.0049). The expression of ANP32A-1T1 gene was positively correlated with the content of monocytes (Fig. 8C: r = 0.25, p = 0.046). The expression of NBPF1 gene was positively correlated with neutrophils content (Fig. 8D: r = 0.33, p = 0.0095). ESCO2 gene expression was positively correlated with activated memory CD4 T cells (Fig. 8E: r = 0.27, p = 0.0035) and negatively correlated with Eosinophils (Fig. 8F: r = 0.33, p = 0.0089). ANP32A-1T1 expression was positively correlated with resting memory CD4 T cells (Fig. 8G: r = 0.38, p = 0.0026). NBPF1 expression was positively correlated with naive CD4 T cells (Fig. 8H: r = 0.25, p = 0.048). ANP32A-1T1 expression was negatively correlated with CD8 T cells (Fig. 8I: r = –0.25, p = 0.048). ANP32A-IT1 expression was negatively correlated with gamma delta T cells (Fig. 8J: r = –0.3, p = 0.018). ANP32A-IT1 expression was negatively correlated with regulatory T cells (Tregs) (Fig. 8K: r = –0.31, p = 0.016). As can be seen above, ANP32A-IT1 expression was negatively correlated with gamma delta T cells (Fig. 8J: r = –0.3, p = 0.018) and CD8 T cells (Fig. 8I: r = –0.25, p = 0.048) , so the patient has less CD8 T cells and less gamma delta T cells. At the same time, the expression of NBPF1 gene was positively correlated with the neutrophil content (Fig. 8D: r = 0.33, p = 0.0095), and the T1DM patient had more neutrophils.
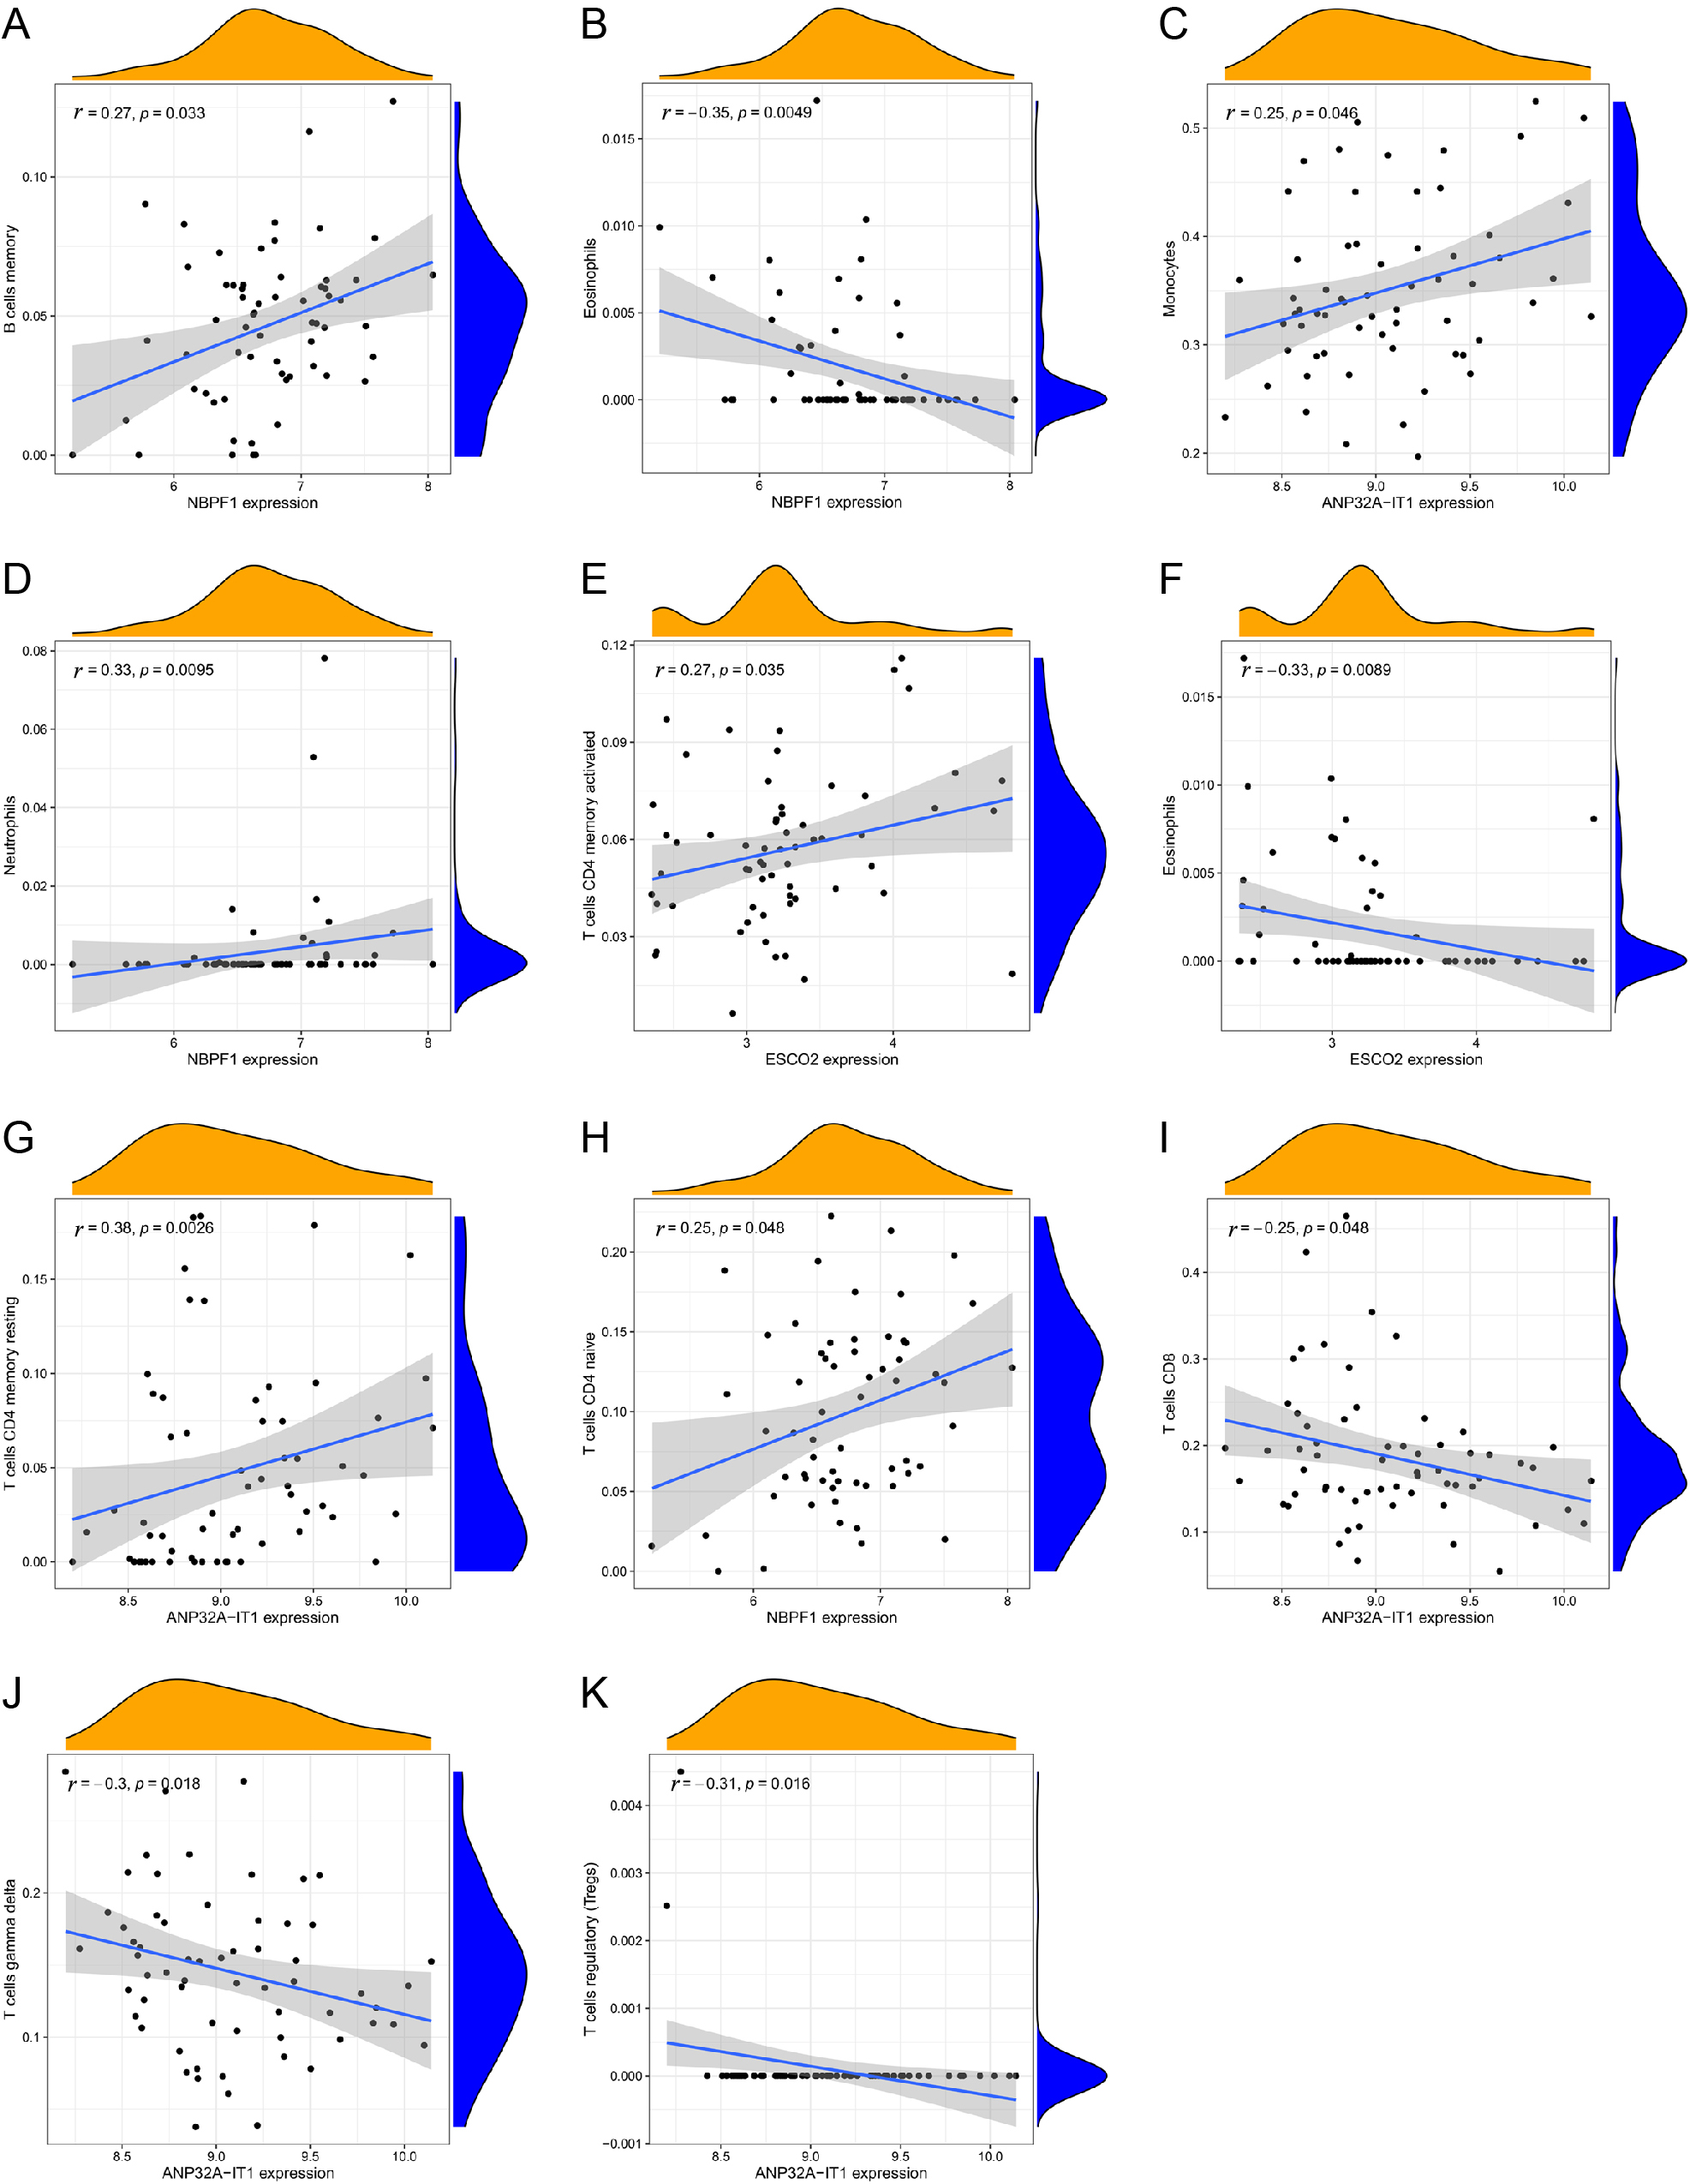
(A–K) Correlation analyses of immune cells
Infiltration of 22 immune cell types in PRCC was determined using the CIBERSORT method, and subsequently the association between ANP32A-IT1 and immune cell infiltration was investigated by Spearman’s analysis. As shown in Fig. 9A, Neutrophils (p = 0.010, cor = 0.33), B cells memory (p = 0.033, cor = 0.27) and T cells CD4 naïve (p = 0.048, cor = 0.25) were all positively correlated with NBPF1, while Eosinophils (p = 0.05, cor = –0.35) was negatively correlated. Fig. 9B shows that ESCO2 was positively correlated with T cells CD4 memory activated (p = 0.035, cor = 0.27), and negatively correlated with Eosinophils (p = 0.009, cor = –0.33). As shown in Fig. 9C, resting memory CD4 T cells (p = 0.003, cor = 0.375) and monocytes (p = 0.046, cor = 0.254) were all positively correlated with ANP32A-IT1 expression. However, T cells CD8 (p = 0.048, cor = 0.3252), gamma delta T cells (p = 0.018, cor = –0.299) and regulatory T cells (Tregs) (p = 0.016, cor = –0.306) showed a negative association with ANP32A-IT1.
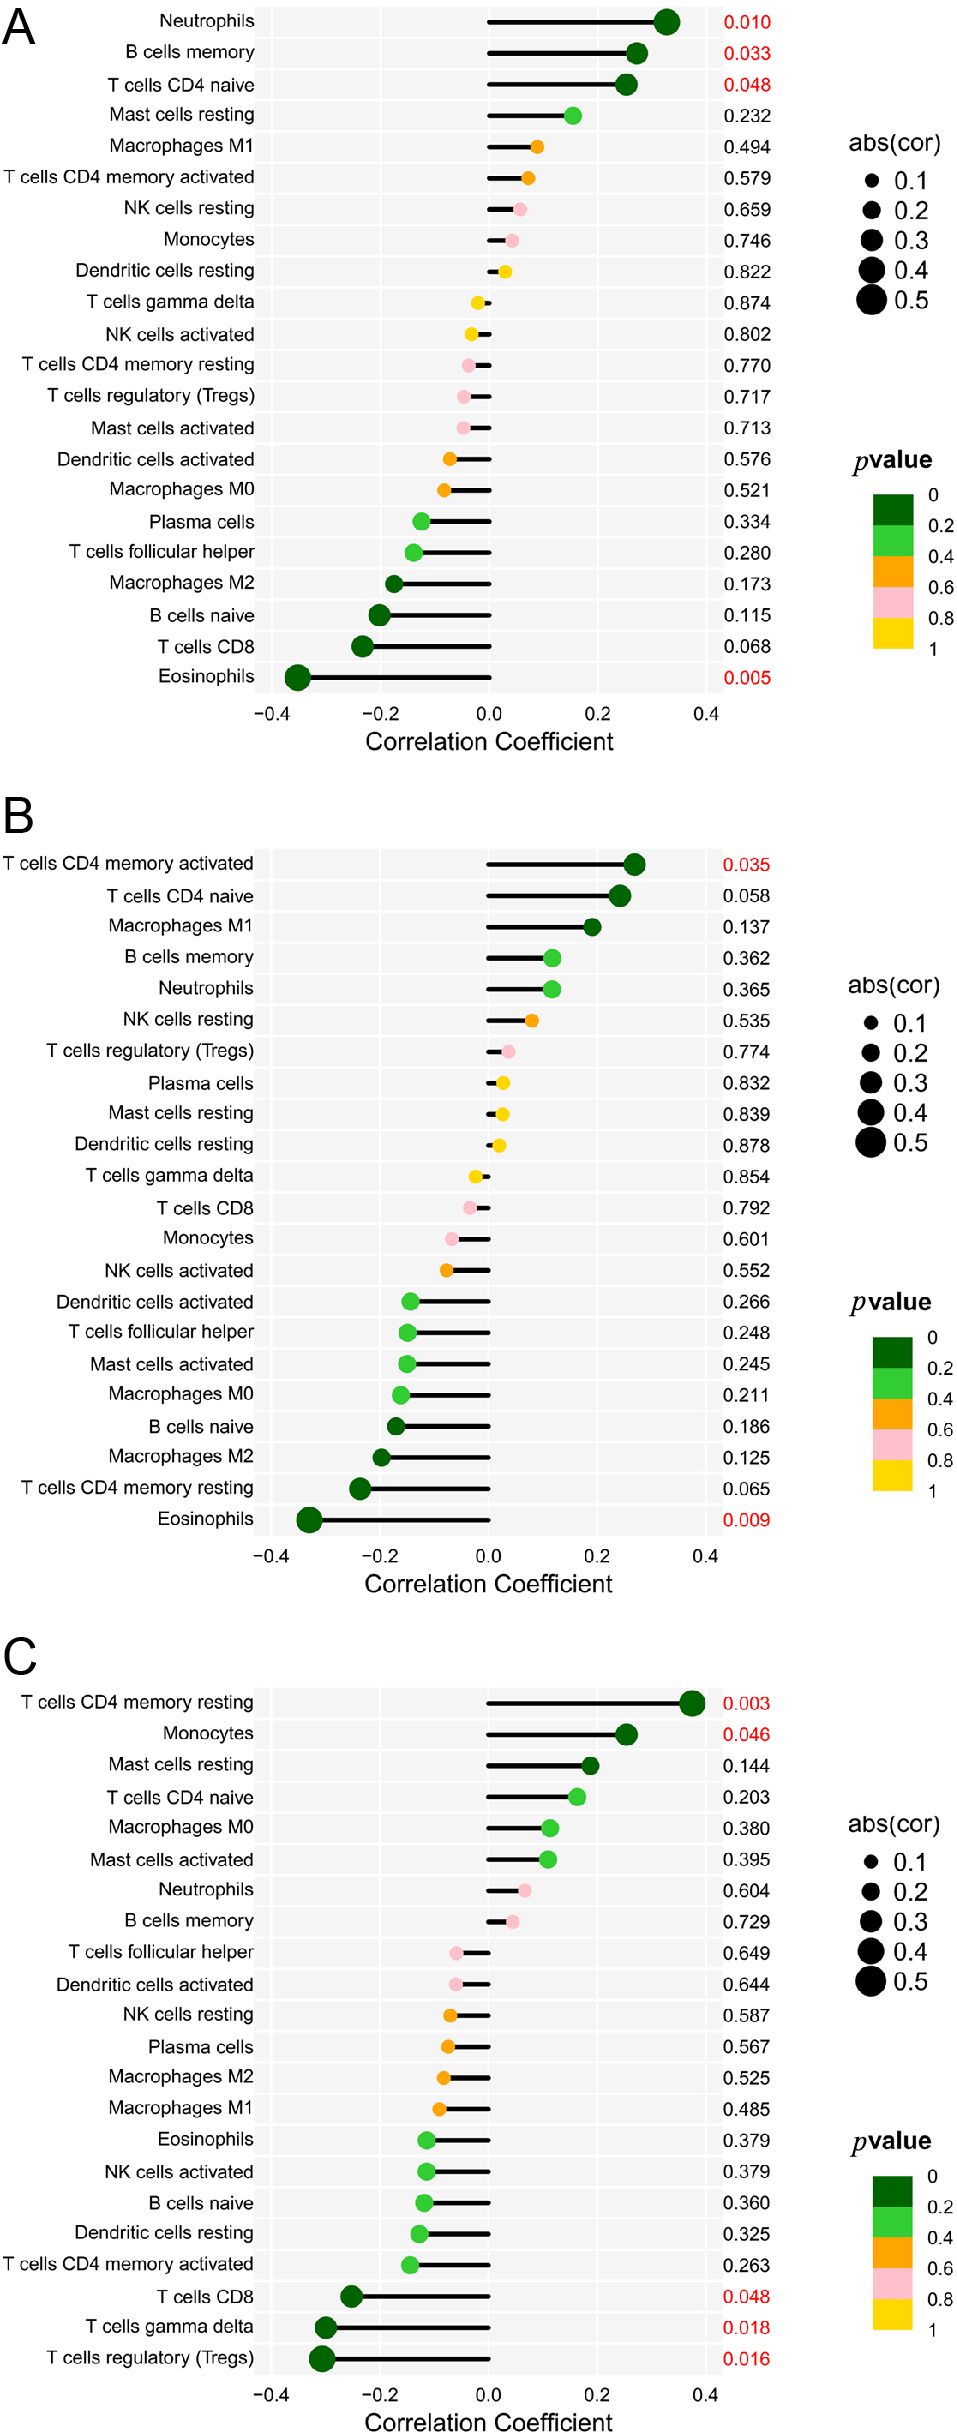
(A–C) Relationships among infiltration levels of 22 immune cell types and ANP32A-IT1 expression profiles by Spearman’s analysis
Type 1 diabetes was once thought to be an autoimmune disease resulted from single pathologic factor [14]. T1DM has gradually been defined as a disease caused by a complex interaction between environmental and genomic factors and abnormal regulation of the microbiome, metabolism, and immune system, which varies from individual to individual [15]. Type 1 diabetes is a chronic disease characterized by insulin deficiency caused by pancreatic beta cell loss and subsequent hyperglycemia lycaemia [16]. Epidemiological analysis shows that the incidence of type 1 diabetes is increasing year by year [3]. The pathogenesis of type 1 diabetes is normally thought to be associated with T cell-contributed β-cell malfunction [17, 18]. Since it is impossible to cure diabetes with current approaches, patients affected by this disease have to take insulin treatment, including a lifetime injection of insulin [19]. Application of therapeutic intervention at an early stage might maintain β cell function and improve clinical outcomes of Type 1 diabetes [20].
This study was based on the detection of gene chip expression in PBMCs of the normal population and T1DM patients. A total of 60 DEGs were screened through GEO database, including 37 up-regulated genes and 23 down-regulated genes. GO functional analysis results showed that DEGs played a role in biological processes such as response to molecule of bacterial origin, regulation of lipopolysaccharide-mediated signaling pathway, cellular response to lipopolysaccharide, response to lipopolysaccharide and cellular response to molecule of bacterial origin. Aravindhan et al. reported that T1DM patients had significantly high levels of lipopolysaccharide (LPS) [21]. In addition, a systematic review showed that most of the studies observed higher LPS concentration in diabetic patients than in healthy controls [22]. Our findings were consistent with previous studies, and the physiological effects of LPS were reflected by the Toll-like receptors on the cell membrane surface of host cells. Therefore, LPS-related receptors and pathways may be involved in the occurrence and development of T1DM and may be used as a target for therapy. To obtain more effective immune-related biomarkers in T1DM, we performed LASSO and SVM analyses and identified candidate immune-related biomarkers including ANP32A-IT1, ESCO2 and NBPF1. On the basis of survival analysis, its relationship with prognosis and clinical features was analyzed. Finally, the correlation between immune cells and hub genes was analyzed by validation set (GSE193273).
NBPF was originally discovered and identified in a neuroblastoma (NB) patient, and the function of its encoded proteins was not clear [23, 24]. NBPF1 is located on human chromosome1p36, where many tumor-suppressor genes have been found, and showed a large expansion in their copy number as compared to the closely related primate species [24-26]. Human neuroblastoma breakpoint family member 1 (NBPF1) was originally identified in a NB patient based on its disruption in a de novo, and the constitutional translocation was between chromosomes 1p36.2 and17q11.2 [27, 28]. NBPF1 is a member of the NBPF family, which consists of dozens of recently duplicated genes that are primarily located in segmental duplications on human chromosome 1. Accumulating evidence has indicated that altered expression of NBPF1 is associated with the pathogenesis of several cancers, such as gastric cancer and neuroblastoma [28]. Moreover, a recent article reported that NBPF1 acted as a tumor suppressor in neuroblastoma by inducing the G1 cell-cycle arrest [29]. Although NBPF1 has been associated with several diseases, the relationship between NBPF1 and type 1 diabetes mellitus has not been reported. We found that the expression of NBPF1 in T1DM samples was positively correlated with Memory B cells, neutrophils and naive CD4T cells, and negatively correlated with eosinophils. Memory B cells derived from primitive precursors are essential for inducing and maintaining protective antibody responses to infectious pathogens [30]. There is a significant phenotypic heterogeneity between memory B cells. Subgroup changes are associated with disease activity in various autoimmune conditions, such as rheumatoid arthritis and systemic lupus erythematosus [31]. Such association was seen in people with type 1 diabetes [32]. More recently, studies provided new insights into the role of neutrophils in disease initiation. Neutrophils can induce type 1 diabetes by infiltrating islets and interacting with other immune cells [33]. Research in recent years has shown that this eosinophil-specific transcriptional activation in patients with type 1 diabetes suggested that these cells could be linked, directly or indirectly, to the pathogenesis of diabetes [34].
Human ESCO2 gene was a homolog of yeast Eco1/Ctf7 gene, which was located at 8P21.1 and encoded proteins composed of 601 amino acids, namely Establishment Sister chromosome cohesion 2 (ESCO2) [35]. ESCO2 is associated with poor prognosis in invasive melanoma, breast cancer, renal cell carcinoma, and lung squamous cell carcinoma [36-40]. We found a positive correlation between ESCO2 expression and activated memory CD4 T cells in T1DM samples. Abnormally activated memory CD4+ T cells play a key role in the development of type 1 diabetes [41].
ANP32A, also known as PP32, Lanp, MAPM, PHAPI, etc., is one of the important members of the ANP32 family and plays an important role in cell proliferation, apoptosis, signal transduction and other biological activities. ANP32A intronic transcript 1 (ANP32A-IT1) was derived from an intron within ANP32A. In recent years, some studies have found that ANP32A was associated with pancreatic cancer, hepatocellular carcinoma and colorectal cancer [42-44]. At present, research has gradually focused on the mechanism of lncRNA in tumorigenesis, but its role in T1DM is rarely reported. We found that the expression of ANP32A-1T1 in T1DM samples was positively correlated with the monocytes and resting memory CD4 T cells. Expression of ANP32A-1T1 was negatively correlated with CD8 T cells, gamma delta T cells and regulatory T cells (Tregs). The proportion of monocytes in peripheral blood may be involved in the pathogenesis of type 1 diabetes mellitus [45]. Another study suggested that CD4 memory T cells might also participate in the development of type 1 diabetes [46]. Dysfunction of regulatory lymphocytes, including T γδ cells, might be crucial for initiating defected immune response, which leads to self-tolerance break-down and the progressive destruction of beta cells [47]. Gamma delta T cells play a pivotal role in type 1 diabetes pathogenesis [48]. The unique roles that CD8+ T cells in T1D make them particularly attractive targets for therapeutic intervention [49]. Regulatory T cells (Tregs) have been shown to be defective in autoimmune disease. Thus, efforts to repair or replace Tregs in T1D may presereve autoimmunity and protect the remaining insulin-producing β cells [50].
Our study provides a new method to assist the prediction of T1DM prognosis. Although we systematically investigated immune-related genes, immune cells and their relationships in T1DM by multiple analyses, this study still had some limitations and lacks experimental verification. Further optimization and basic experiments are needed to reveal the detailed molecular mechanism of these immune-related genes in T1DM. In addition, environmental factors are also an important factor in the pathogenesis of T1DM. We did not incorporate environmental factors into this study, and further studies are needed to elucidate its mechanism in T1DM. At last, we did not use other machine learning methods for comparison but directly selected the commonly used LASSO and SVM analysis. This is another limitation of our study, and future studies should take this factor into account.
In summary, we used bioinformatics and machine learning tools to analyze differentially expressed genes between type 1 diabetes and healthy individuals, and to identify important biological processes and signaling pathways through GO and DO pathway. In this study, we identified ANP32A-IT1, ESCO2 and NBPF1 as potential immune-related biomarkers for T1DM for the first time. This study reveals the relationship between immune-related genes and immune cells. Our results improve the understanding of the molecular mechanism of T1DM and provide new information for the diagnosis and treatment of T1DM.
The data supporting the findings of the article is available in the [GEO] at (https://www.ncbi.nlm.nih.gov/geo/).
None.
The authors declare no conflict of interest, financial or otherwise.
We thank the researchers who gave their data for this analysis. And we also would like to acknowledge the GEO database.