Abstract
The effect of potassium iodide (KI) on radioiodine uptake (RAIU) before radioisotope therapy in Graves’ disease (GD) patients was investigated. A total of 82 patients who had been treated with KI monotherapy before 24-hour RAIU (24 h RAIU) were evaluated and 354 of those who had been treated with thiamazole (MMI) monotherapy were extracted from the 1,130 GD patients who were identified as having had appropriate iodine restriction based on urinary iodine excretion. Urinary iodine excretion (UIE) <200 μg/day was confirmed in all subjects. Propensity score-matching was performed to identify the difference in 24 h RAIU between the KI group and the MMI group. In addition, multiple regression analysis was performed to evaluate related to 24 h RAIU. Propensity score-matching resulted in 57 matched patients in each group. After matching, 24 h RAIU was still significantly lower in the KI group than in the MMI group (median 53% (interquartile range 47–61%) vs. 63% (56–66%); p = 0.001). In addition, KI monotherapy was weakly negatively correlated with 24 h RAIU, whereas the female sex and FT3 were very weakly positively correlated on multiple regression analysis. The results suggest that KI monotherapy likely suppressed 24 h RAIU more than MMI monotherapy in GD patients with appropriate iodine restriction, given the difference in the mechanism of hormone suppression.
RADIOISOTOPE THERAPY (RIT) has been used as an effective and safe treatment for patients with Graves’ disease (GD) since first reported in the 1940s [1-3]. Generally, the discontinuation of drug therapy and iodine restriction before RIT have been required to maximize its therapeutic effect. Eschmann et al. compared the effects of antithyroid drugs (ATDs) prior to treatment with RIT on the therapeutic outcome between the two groups: those who continued ATDs (group A), and those who discontinued ATDs 3–7 days before RIT (group B). They found a significant difference in the RIT success rate between the two groups (group A 67% vs. group B 85%; p < 0.01) [4]. Regarding iodine restriction, it is common practice to follow a low-iodine diet (excluding seaweed and its processed products, with an inorganic iodine equivalent of 250–400 μg/day) for almost a week before RIT [5]. Potassium iodide (KI) should also be discontinued before RIT. Sternthal et al. investigated the effect of KI on radioiodine uptake (RAIU) in volunteers with normal thyroid function and reported that daily KI administration of 15 mg or more resulted in RAIU of 2% or less [6]. Previous studies have reported that KI suppresses RAIU in healthy subjects [7, 8]. Moreover, some studies have evaluated the effect of KI on RAIU in GD patients.
Okamura et al. reported the effectiveness of KI 100 mg/day in 504 untreated patients with GD. In this report, all patients underwent evaluation of RAIU/5 h before KI administration, and the median RAIU/5 h was 55.8%. Of these, 104 patients eventually underwent RIT. The median RAIU/5 h in these patients after 4–7 days of KI discontinuation and iodine restriction before RIT was 60.0%, with no significant difference between them [9]. Further, Tachibana et al. divided GD patients with thyroid weight (TW) below 50 g into two groups (a KI monotherapy group (KI group) and a thiamazole (MMI) monotherapy group (MMI group)) and compared RAIU before RIT in the two groups. RAIU was evaluated 4 days after drug discontinuation in the two groups. The results showed a significant difference in RAIU between the KI and MMI groups (29.9% vs. 62.9%; p = 0.002). However, Tachibana et al. suggested that the 4 days of KI discontinuation before RIT may have contributed to the low RAIU in the KI group [10]. The present study aimed to investigate the effect of KI on RAIU before RIT in GD patients with appropriate iodine restriction.
Materials and Methods
Subjects
The subjects were 17,163 GD patients who underwent RIT at our institution between January 2006 and May 2020. Cases with a history of surgery (e.g., postoperative GD and thyroid tumor) or of RIT, and those with functional nodules (e.g., Marine-Lenhart syndrome) were excluded from the study. Urinary iodine excretion (UIE) was used as a reference to evaluate iodine restriction, and subjects whose UIE was not evaluated were excluded. Since more than 90% of iodine is excreted in the urine, UIE is a suitable indicator of iodine intake [11]. Park et al. defined urine iodine to creatinine ratio <50 μg/gCre as excellent and 50–100 μg/gCre as adequate preparation for a radioiodine scan in thyroid cancer [12]. However, it is still unclear the definition of an appropriate iodine restriction in GD patients before RIT. Katagiri et al. evaluated daily iodine intake using UIE in 713 healthy Japanese subjects aged 20 to 69 years without iodine restriction and reported a median UIE of 365 μg/day [13]. In addition, the differences in UIE were reported by age group and sex (e.g., UIE 249 μg/day in women 20–29 years of age and 306 μg/day in men 20–29 years of age). Furthermore, Ishizuki et al. reported the differences in UIE by age group in 120 healthy subjects (e.g., UIE 215.8 ± 5.0 μg/day for those aged 20–29 years and 496.3 ± 46.9 μg/day for those aged 70–79 years) [14]. Considering the differences in UIE by age group and sex in those previous studies, appropriate iodine restriction was defined as UIE <200 μg/day. Monotherapy was defined as the drug used 2 months before RIT. Subjects taking propylthiouracil, an ATD combined with levothyroxine (block and replace therapy), and an ATD combined with KI 2 months before RIT were excluded from the 1,130 eligible patients who were defined as having appropriate iodine restriction. Finally, a total of 82 cases in the KI monotherapy group (KI group) and 354 cases in the MMI monotherapy group (MMI group) were extracted. The flow chart is shown in Fig. 1. This retrospective study was approved by the Ethics Committee of Ito Hospital (approval no. 309) and was conducted according to the Declaration of Helsinki and current legal laws in Japan. The opt-out method was used to give patients the opportunity to refuse to participate in the study.

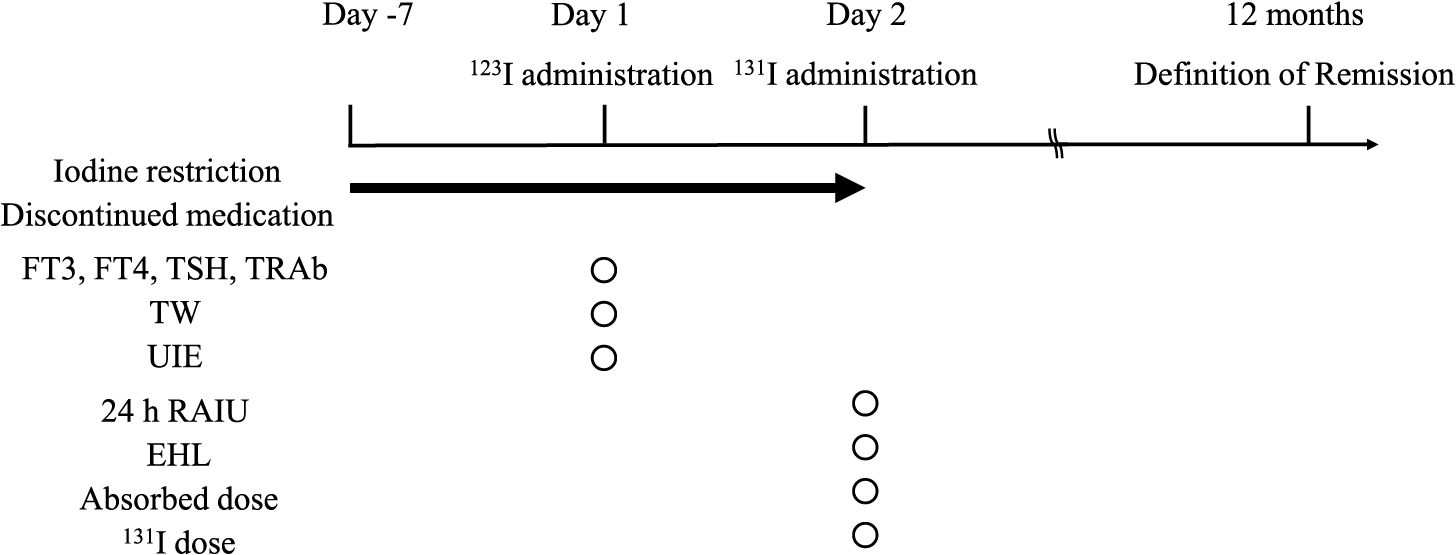
The study design is shown in Fig. 2. All participants were administered radioactive iodine (123I, Iodide capsule 123, Nihon Medi-Physics Co. Ltd, Tokyo, Japan) after one-week iodine restriction and KI or MMI discontinuation guided by a physician from our institution. Thyroid function, UIE, and TW were evaluated on the day of 123I administration. The 24-hour RAIU (24 h RAIU) and effective half-life (EHL) were calculated after 24 hours of 123I administration, and the 131I dose was determined. Remission of GD was defined as discontinuation of KI or MMI 12 months after RIT. The remission group was categorized as normal (FT3, FT4, and TSH were within the reference values), subclinical hyperthyroidism (FT3 and FT4 were within the reference values, and TSH was <0.2 μIU/mL), subclinical hypothyroidism (FT3 and FT4 were within the reference values, and TSH was >4.5 μIU/mL), and hypothyroidism (one or both of FT3 and FT4 were lower than the reference values, and TSH was >4.5 μIU/mL).
Serum FT3, FT4, thyrotropin, and thyrotropin receptor antibody (TRAb) levels were measured using electrochemiluminescence immunoassay kits (ECLusys FT3, FT4, TSH, and TRAb, Roche Diagnostics, Basel, Switzerland). The reference values used in our institution were as follows; FT3 2.2–4.3 pg/mL, FT4 0.8–1.6 ng/dL, TSH 0.2–4.5 μIU/mL, and TRAb <2.0 IU/L. TW was evaluated using three-dimensional (3D) ultrasound (Aplio i800, Canon Medical Systems Co., Ltd., Tochigi, Japan), which allowed accurate measurement of TW with lower intraobserver variability and higher repeatability than two-demensional ultrasound [15]. The patient’s neck was extended, and an acoustic lens was placed over the thyroid gland for examination. The median part of the thyroid gland, which is equidistant from the upper and lower thyroid poles, was delineated, and a SCAN mode examination was performed; after the SCAN mode examination, transverse, coronal, and sagittal images of the thyroid gland were automatically delineated. Eight locations were arbitrarily captured from the obtained coronal section images, and the corresponding transverse and sagittal sections were traced. After tracing, a 3D ultrasound image was automatically created, and the TW was calculated. Iodine excretion was calculated using spot urine samples (SRL Inc, Tokyo). UIE (μg/day) was used to evaluate iodine restriction using spot urine samples (SRL Inc, Tokyo). Sugimoto et al. investigated the correlation between UIE from spot urine samples and UIE from urine collected for 24 hours in 35 cases of untreated GD patients, and a strong correlation was found between the groups (estimated UIE from spot urine samples 129 ± 70.6 μg/day vs. UIE from 24-hour urine 126.4 ± 63.6 μg/day, correlation coefficient = 0.740, p < 0.001) [16]. Iodine concentration (μg/gCre) was calculated using iodine concentration (μg/L) and creatinine concentration (mg/dL) and multiplied by a factor of 1.5 for men and 1.0 for women to calculate UIE.
Measurement of RAIU, EHL, absorbed dose, and 131I dose
Measurements of all participants were taken 24 hours after administration of 123I. EHL was calculated using the estimation method reported by Gomi et al. [17]. Low RAIU was defined as ≤30%, referring to the report of 24 h RAIU in normal subjects [18]. Normal RAIU was defined as >30%. Absorbed doses were set using the expected absorbed doses established at our institution for each TW (Supplementary Table 1). The 131I dose was calculated using Marinelli-Quimby’s formula as follows:
131I dose (MBq) = {Absorbed dose (Gy) × TW (g)}/{24 h RAIU (%)/100 × EHL (day) × 3.98} [19].
Statistical analyses
The data are expressed as medians and interquartile ranges for continuous variables and as numbers or percentages for categorical variables. To assess differences in 24 h RAIU between the KI group and the MMI group, a propensity score-matching analysis was conducted [20]. Propensity score-matching is a useful method to reduce selection bias and construct a randomized experiment-like situation in which a treatment group being contrasted is comparable to an observed group. The propensity score was calculated using logistic regression analysis with the medication before RIT as the dependent variable and age, sex, TW, and FT3, FT4, TSH, and UIE levels as covariates. The area under the curve (AUC) of the receiver-operating characteristic curve (ROC curve) was used as the C-statistic for evaluating the goodness of fit. One-to-one nearest neighbor matching was performed to match each patient in the KI group to those in the MMI group who had the closest propensity score. A caliper of 0.20 of the standard deviation of the propensity score in all subjects was used to prevent poor matching. The balance between the two groups was evaluated using the standardized difference (SD), and SD <0.1 was considered to indicate a balance between the groups [21]. The methods used in the comparison were the Wilcoxon test and Fisher’s exact test. A p-value <0.05 was considered significant. Furthermore, multiple regression analysis was performed to evaluate factors related to 24 h RAIU. Explanatory variables were selected based on theoretical considerations, and multicollinear explanatory variables were excluded to avoid statistical bias in the analysis [22]. The statistical analysis was carried out using JMP Pro version 15.0.0 (SAS Institute Inc., Cary, NC, USA).
Results
Characteristics of the KI group and the MMI group before matching
The characteristics of the KI group (n = 82) and the MMI group (n = 354) before propensity score-matching are shown in Table 1. The 24 h RAIU was significantly lower in the KI group than in the MMI group (55% (44–62%) vs. 63% (58–66%); p < .0001). The frequency of low RAIU was higher in the KI group than in the MMI group (n = 9 (11.0%) vs. n = 2 (0.56%); p < .0001). Significant differences were also seen in age, sex, TW, FT3, FT4, TSH, and UIE levels, 131I dose, absorbed dose, and remission rate.
Table 1
Characteristics of the KI group and the MMI group before matching
|
KI group |
MMI group |
p-value |
SD |
| N |
82 |
354 |
— |
— |
| Age (y)* |
52 (36–69) |
44 (32–57) |
0.0003 |
0.481 |
| Female, n (%)** |
66 (80.5) |
231 (65.3) |
0.008 |
0.347 |
| TW (g)* |
32.6 (21.4–66.4) |
94.6 (66.5–127.3) |
<.0001 |
1.198 |
| 24 h RAIU (%)* |
55 (44–62) |
63 (58–66) |
<.0001 |
0.896 |
| Low RAIU, n (%)** |
9 (11.0) |
2 (0.56) |
<.0001 |
0.197 |
| FT3 (pg/mL)* |
10.2 (6.5–19.4) |
8.3 (4.4–16.4) |
0.021 |
0.213 |
| FT4 (ng/dL)* |
3.3 (1.6–4.9) |
2.0 (1.3–3.4) |
0.005 |
0.322 |
| TSH (μIU/mL)* |
0.01 (0.01–0.02) |
0.02 (0.01–0.25) |
<.0001 |
0.264 |
| TRAb (IU/L)* |
14.3 (5.1–29.2) |
13.6 (4.3–30.5) |
0.698 |
0.016 |
| UIE (μg/day)* |
116 (76–143) |
54 (34–78) |
<.0001 |
1.421 |
| EHL (day)* |
5.9 (5.2–6.1) |
6.0 (5.1–6.2) |
0.404 |
0.012 |
| 131I dose (MBq)* |
275 (112–711) |
849 (460–1,110) |
<.0001 |
0.925 |
| 131I dose/TW (MBq/g)* |
6.42 (4.64–9.77) |
6.73 (5.74–8.38) |
0.485 |
0.025 |
| Absorbed dose (Gy)* |
72.9 (60.8–105.5) |
101.5 (82.1–120.9) |
<.0001 |
0.523 |
| Remission, n (%)** |
46 (56.1) |
130 (40.4) |
0.002 |
0.316 |
| Thyroid function*** |
| Normal, n (%) |
18 (39.1) |
61 (46.9) |
|
|
| Sub-hyper, n (%) |
14 (30.4) |
41 (31.5) |
|
|
| Sub-hypo, n (%) |
9 (19.6) |
23 (17.7) |
|
|
| Hypothyroidism, n (%) |
5 (10.9) |
5 (3.9) |
|
|
* Wilcoxon test, ** Fisher’s exact test
Continuous variables are shown as medians (interquartile range). Categorical variables are shown as numbers or percentages.
*** The percentage of each thyroid function (normal, subclinical hyperthyroidism, subclinical hypothyroidism, hypothyroidism) in the remission group is shown.
Abbreviations
KI: Potassium iodide, MMI: Thiamazole, SD: Standardized difference, TW: Thyroid weight, 24 h RAIU: 24-hour Radioiodine uptake, Low RAIU: RAIU ≤30%, FT3: Free triiodothyronine, FT4: Free thyroxine, TSH: Thyrotropin, TRAb: Thyrotropin receptor antibody, UI: Urinary iodine, EHL: Effective half-life, Sub-hyper: Subclinical hyperthyroidism, Sub-hypo: Subclinical hypothyroidism
The characteristics of the KI group and the MMI group after propensity score-matching are shown in Table 2. The C-statistic was 0.898. The 57 patients in each group were matched by one-to-one nearest neighbor matching. No significant differences were seen in an age, sex, TW, FT3, FT4, TSH, and UIE levels between the two groups. Other than for TW, their SDs were <0.1. However, 24 h RAIU was significantly lower in the KI group than in the MMI group (53% (47–61%) vs. 63% (56–66%); p = 0.001). The frequency of low RAIU did not differ between the two groups (n = 7 (12.3%) vs. n = 2 (3.5%); p = 0.161). Although no significant differences were seen in the 131I or absorbed dose, the remission rate was significantly higher in the KI group (p = 0.001).
Table 2
Characteristics of the KI group and the MMI group after matching
|
KI group |
MMI group |
p-value |
SD |
| N |
57 |
57 |
— |
— |
| Age (y)* |
48 (37–67) |
48 (39–66) |
0.788 |
0.054 |
| Female, n (%)** |
43 (75.4) |
43 (75.4) |
1.000 |
0 |
| TW (g)* |
43.4 (20.6–91.9) |
57.8 (37.3–79.6) |
0.069 |
0.118 |
| 24 h RAIU (%)* |
53 (47–61) |
63 (56–66) |
0.001 |
0.563 |
| Low RAIU, n (%)** |
7 (12.3) |
2 (3.5) |
0.161 |
0.331 |
| FT3 (pg/mL)* |
10.2 (6.2–20.4) |
11 (5.2–21.9) |
0.986 |
0.003 |
| FT4 (ng/dL)* |
2.3 (1.6–4.8) |
3.2 (1.6–4.7) |
0.669 |
0.067 |
| TSH (μIU/mL)* |
0.01 (0.01–0.02) |
0.01 (0.01–0.06) |
0.490 |
0.067 |
| TRAb (IU/L)* |
16.4 (7.2–31.8) |
14.2 (5.0–33.9) |
0.761 |
0.021 |
| UIE (μg/day)* |
91 (63–128) |
108 (70–131) |
0.439 |
0.059 |
| EHL (day)* |
5.9 (5.0–6.1) |
5.7 (5.1–6.1) |
0.514 |
0.044 |
| 131I dose (MBq)* |
308 (116–905) |
414 (211–805) |
0.327 |
0.141 |
| 131I dose/TW (MBq/g)* |
6.43 (4.65–8.89) |
6.71 (5.79–8.79) |
0.529 |
0.057 |
| Absorbed dose (Gy)* |
72.8 (60.0–107.1) |
82.2 (70.6–118.7) |
0.083 |
0.245 |
| Remission, n (%)** |
36 (63.2) |
20 (35.1) |
0.001 |
0.586 |
| Thyroid function*** |
| Normal, n (%) |
14 (38.9) |
8 (40.0) |
|
|
| Sub-hyper, n (%) |
10 (27.8) |
5 (25.0) |
|
|
| Sub-hypo, n (%) |
5 (13.9) |
4 (20.0) |
|
|
| Hypothyroidism, n |
7 (19.4) |
3 (15.0) |
|
|
* Wilcoxon test, ** Fisher’s exact test
Continuous variables are shown as medians (interquartile range). Categorical variables are shown as numbers or percentages.
*** The percentage of each thyroid function (normal, subclinical hyperthyroidism, subclinical hypothyroidism, hypothyroidism) in the remission group is shown.
Abbreviations
KI: Potassium iodide, MMI: Thiamazole, SD: Standardized difference, TW: Thyroid weight, 24 h RAIU: 24-hour Radioiodine uptake, Low RAIU: RAIU ≤30%, FT3: Free triiodothyronine, FT4: Free thyroxine, TSH: Thyrotropin, TRAb: Thyrotropin receptor antibody, UI: Urinary iodine, EHL: Effective half-life, Sub-hyper: Subclinical hyperthyroidism, Sub-hypo: Subclinical hypothyroidism
Factors related to 24 h RAIU on multiple regression analysis are shown in Table 3. The multiple correlation coefficient was 0.37. Female sex and FT3 were weakly positively correlated with 24 h RAIU, whereas KI before RIT was weakly negatively correlated with 24 h RAIU (standard partial regression coefficient (β) = –0.354, p < .0001). TW showed little correlation (β = 0.150, p < .0002).
Table 3
Evaluation of related factors for RAIU in multiple regression analysis
| Variables |
β |
Standard error |
p-value |
| Age (y) |
–0.085 |
0.025 |
0.051 |
| Female sex |
0.218 |
0.437 |
<.0001 |
| TW (g) |
0.150 |
0.009 |
0.002 |
| FT3 (pg/mL) |
0.205 |
0.047 |
<.0001 |
| KI before RIT |
–0.354 |
0.570 |
<.0001 |
R2 = 0.37
Abbreviations
β: Standard partial regression coefficient, R2: Multiple correlation coefficient, KI: Potassium iodide, RIT: Radioisotope therapy
Patients’ characteristics by the RAIU category are shown in Supplementary Table 2. Eleven patients were defined as having low RAIU, and 425 patients were defined as having normal RAIU. Significant differences were seen between these two groups in medication before RAIU, TW, 24 h RAIU, FT3, UIE, EHL, 131I dose, and absorbed dose, but not in the remission rate.
Discussion
Excessive iodine exposure before scintigraphy (e.g., from iodine-containing contrast media, iodine-rich foods such as seaweed, and iodine-containing drugs such as amiodarone) affects RAIU results [23]. In the present study, the median UIE was 116 μg/day in the KI group and 54 μg/day in the MMI group. Considering the report by Katagiri et al. [12], all subjects in the present study were considered to have achieved appropriate iodine restriction. In other words, the effect of iodine intake on 24 h RAIU was considered to be minimal in this group (Table 1). Shishiba et al. compared the difference in UIE between silent thyroiditis (SLT) and GD with iodine restriction and reported 425 μg/day in SLT and 172 μg/day in GD [24]. Similarly, Momotani et al. reported that postpartum SLT was associated with low RAIU and high UIE in 96 women with a history of GD [25]. Thus, the results indicated that SLT was excluded from this study because of low UIE.
The 24 h RAIU of the KI group after iodine restriction was 55% (44–62%), and a significant difference was seen between the KI group and the MMI group (Table 1). Moreover, 11.0% of GD patients in the KI group had low RAIU, significantly more than in the MMI group. This was an interesting result, and a logistic analysis to identify factors causing low RAIU in the KI group was considered, but the number of patients was too small [26].
There was a significant difference in UIE between the KI group and the MMI group (116 (76–143) μg/day vs. 54 (34–78) μg/day; p < .0001) in GD patients with appropriate iodine restriction, as shown in Table 1. In addition, significant differences were seen in an age, sex, TW, and thyroid function between the groups, indicating differences in background factors between the groups. Therefore, propensity score-matching analysis was performed to minimize the impact of differences in these factors between the two groups on 24 h RAIU. The C-statistic was 0.898, which indicated the propensity score to be a good fit [27]. The SDs of age, sex, thyroid function, and UIE after the nearest neighbor matching were each <0.1. This indicated that these factors were judged to be appropriately adjusted between the two groups (Table 2). In addition, 24 h RAIU was significantly different between the two groups after propensity score-matching, suggesting that KI suppresses 24 h RAIU more than MMI. Furthermore, the frequency of low RAIU was significantly higher in the KI group than in the MMI group before matching; although its frequency in the two groups after matching was not significantly different, it was assumed to be affected by the smaller number of patients in the two groups due to matching. The difference in the mechanisms of KI and MMI on the thyroid gland may have contributed to the difference in 24 h RAIU between the two groups. ATDs inhibit thyroid hormone synthesis by blocking thyroid peroxidase [28]. On the other hand, KI acts on the sodium/iodide symporter (NIS), which is expressed on the membrane of thyroid follicular cells and takes up iodine into thyroid cells, increasing iodine levels in the thyroid gland up to 40-fold [29]. NIS expression is increased in GD [30]. Eng et al. reported that NIS mRNA and protein were decreased 1 to 6 days after chronic iodine ingestion in rats [31]. Leoni et al. also reported decreased NIS mRNA levels after excess iodide incubation, reaching a reduction of 20–30%, which was recovered at 72 hours in rats. In addition, it was observed that the activity of thioredoxin reductase (TxnRd), which is one of the selenium-containing antioxidative enzymes and is expressed in thyrocytes, regulated NIS responses to iodide. Interestingly, in the presence of the TxnRd activity inhibitors after Iodide administration, NIS activity did not recover after 72 hours [32]. Therefore, even 7 days after discontinuation, KI possibly suppressed 24 h RAIU more than MMI, in view of the difference in the mechanism of hormone suppression.
On the other hand, KI monotherapy was negatively correlated with 24 h RAIU, whereas the female sex and FT3 were weakly positively correlated in multiple regression analysis. Oddie et al. reported the dependence of renal clearance rates (k2) of radioiodine on the sex of subjects in 1,335 Australians and 474 Americans. In this report, the value of k2 was higher in women than in men [33]. In iodine metabolism, on average, 480 μg of iodine was excreted in urine per day, compared to 20 μg in stool [34]. Presumably, the difference in k2 between men and women might affect iodide metabolism, resulting in a positive correlation between the female sex and 24 h RAIU in the present study. In addition, Osaki et al. reported that the prediction of 24 h RAIU using 3-hours RAIU, FT3, and antithyroid discontinuation period was feasible in GD patients without rapid turnover [35]. Moreover, Andre et al. reported that GD patients with serum T3 levels exceeding 7.68 nmol/L (500 ng/dL) and goiter of 50 mL or more had a higher RIT failure rate than patients with smaller goiters and lower serum T3 values [36]. These findings suggested that FT3 levels might also be an important factor related to 24 h RAIU, but the mechanism was unclear in the present study.
RAIU is an important factor contributing to the success rate of RIT and 131I doses. Xing et al. reported that 24 h RAIU >46.31% contributed to the success rate of RIT in GD patients [37]. Wong et al. also reported that more than 90% of GD patients can undergo successful RIT using a single calculated dose by adjusting the radiation dose, which is adjusted based on TW and 24 h RAIU [38].
Regarding remission rates, however, a significant difference was seen between the KI and MMI groups in the present study. The difference was caused by the 131I dose being calculated individually using the Marinelli-Quimby formula [19]. In addition, a larger dose from the calculated dose was possibly applied to improve or abolish thyroid function in GD patients of the KI group who could not use ATD due to a side effect. Thus, GD patients in the KI group had the dose adjusted more than in the MMI group, resulting in a difference in remission rates between the two groups.
There are several limitations to this study. First, this study was carried out at a single center in an iodine-sufficient area. Second, the number of GD patients was smaller in the KI group than in the MMI group before matching. According to Japanese guidelines for the treatment of Graves’ disease, MMI is initially used as drug therapy in most patients [39]. In contrast, KI monotherapy is considered when patients experience side effects of MMI when patients do not choose an ATD, and in patients without severe hyperthyroidism. In addition, UIE was not evaluated in a large number of subjects in the present study. Moreover, the possibility of different success rates of iodine restriction between the two groups was not evaluated in the present study. These above factors may have caused the difference in numbers between the two groups. Third, 24 h RAIU can be lower than 3 to 4-hours RAIU in GD patients with rapid iodine turnover [40], but this was not evaluated in the present study. Fourth, although the SD of TW after nearest neighbor-matching was >0.1, the standard partial regression coefficient of TW with 24 h RAIU was 0.15, which was low and almost no association was found in multiple regression analysis. RAIU and TW were only marginally related, if at all.
A strength of this observational study is that it evaluated the possibility that KI monotherapy may suppress 24 h RAIU more than MMI monotherapy, even with appropriate iodine restriction before RIT in GD patients, using propensity score-matching analysis and multiple regression analysis. Since no previous report has shown the effect of KI on RAIU before RIT in GD patients with appropriate iodine restriction, this can be considered a useful report.
In summary, the present study suggests that KI monotherapy likely suppressed 24 h RAIU more than MMI monotherapy in GD patients with appropriate iodine restriction.
Acknowledgments
The authors would like to thank the participants of this study and all of the staff of the Department of Internal Medicine, Ito Hospital.
Disclosure
The authors declare that they have no conflicts of interest regarding this study. This study was presented in part at the 64th Annual Meeting of Japan Thyroid Association 2021.
References
- 1 Soley MN, Foreman N (1949) Radioiodine therapy in Graves’ disease; a review. J Clin Invest 28: 1367–1374.
- 2 Hertz S, Roberts A (1942) Radioactive iodine as an indicator in thyroid physiology. V. The use of radioactive iodine in the differential diagnosis of two types of Graves’ disease. J Clin Invest 21: 31–32.
- 3 Saenger EL, Thoma GE, Tompkins EA (1968) Incidence of leukemia following treatment of hyperthyroidism. Preliminiary report of the cooperative thyrotoxicosis therapy follow-up study. JAMA 205: 855–862.
- 4 Eschmann SM, Thelen MH, Dittmann H, Bares R (2006) Influence of short-term interruption of antithyroid drugs on the outcome of radioiodine therapy of Graves’ disease: results of a prospective study. Exp Clin Endocrinol Diabetes 114: 222–226.
- 5 Wanibe S, Nihei N, Kasahara F, Sano T (1980) Studies on effect of iodide restriction on thyroidal 131I-uptake (author’s transl). Kaku Igaku 17: 1293–1297 (In Japanese).
- 6 Sternthal E, Lipworth L, Stanley B, Abreau C, Fang SL, et al. (1980) Suppression of thyroid radioiodine uptake by various doses of stable iodide. N Engl J Med 303: 1083–1088.
- 7 Koutras DA, Livadas D (1965) The minimum dose of potassium iodide which inhibits the thyroidal radioiodine uptake. Nuklearmedizin 5: 256–261 (In German).
- 8 Blum M, Eisenbud M (1967) Reduction of thyroid irradiation from 131-I by potassium iodide. JAMA 200: 1036–1040.
- 9 Okamura K, Sato K, Fujikawa M, Bandai S, Ikenoue H, et al. (2022) Iodide-sensitive Graves’ hyperthyroidism and the strategy for resistant or escaped patients during potassium iodide treatment. Endocr J 69: 983–997.
- 10 Tachibana S, Yamashita H, Yanase T (2017) Evaluation of the efficacy of potassium iodide preparation for radioactive iodine therapy in Graves’ disease: a retrospective chart review. J Endocrinol Metab 7: 25–30.
- 11 Perrine CG, Cogswell ME, Swanson CA, Sullivan KM, Chen TC, et al. (2014) Comparison of population iodine estimates from 24-hour urine and timed-spot urine samples. Thyroid 24: 748–757.
- 12 Park JT 2nd, Hennessey JV (2004) Two-week low iodine diet is necessary for adequate outpatient preparation for radioiodine rhTSH scanning in patients taking levothyroxine. Thyroid 14: 57–63.
- 13 Katagiri R, Asakura K, Uechi K, Masayasu S, Sasaki S, et al. (2016) Iodine excretion in 24-hour urine collection and its dietary determinants in healthy Japanese adults. J Epidemiol 26: 613–621.
- 14 Ishizuki Y, Hirooka Y, Tanigawa S (1994) The variation of Japanese urinary excretion of iodine in differrent decades of age. Folia Endcrinol Jpn 70: 1093–1100 (In Japanese).
- 15 Lyshchik A, Drozd V, Reiners C (2004) Accuracy of three-dimensional ultrasound for thyroid volume measurement in children and adolescents. Thyroid 14: 113–120.
- 16 Sugimoto T, Momotani N, Iino S, Ito K (1994) Clinical significance of the mesurement of the urinary concentration of iodine in differentiating silent thyroiditis from Graves’ disease. Folia Endocrinol Jpn 70: 1083–1092 (In Japanese).
- 17 Gomi Y, Watanabe M, Yoshimura H, Ishikawa N, Momotani N, et al. (2000) The outcome of treatment with adjusted dose of 131I to thyroid weight for Graves’ disease by estimation of effective half life using a single radioiodine uptake measurement. Kaku Igaku 37: 109–114 (In Japanese).
- 18 Hooper PL, Turner JR, Conway MJ, Plymate SR (1980) Thyroid uptake of 123I in a normal population. Arch Intern Med 140: 757–758.
- 19 Marinelli LD, Quimby EH, Hine GJ (1948) Dosage determination with radioactive isotopes; practical considerations in therapy and protection. Am J Roentgenol Radium Ther 59: 260–281.
- 20 Rosenbaum PR, Rubin DB (1983) The central role of the propensity score in observational studies for causal effects. Biometrika 70: 41–55.
- 21 Austin PC (2009) Using the standardized difference to compare the prevalence of a binary variable between two groups in observational research. Commun Stat Simul Comput 38: 1228–1234.
- 22 Kim JH (2019) Multicollinearity and misleading statistical results. Korean J Anesthesiol 72: 558–569.
- 23 Giovanella L, Avram AM, Iakovou I, Kwak J, Lawson SA, et al. (2019) EANM practice guideline/SNMMI procedure standard for RAIU and thyroid scintigraphy. Eur J Nucl Med Mol Imaging 46: 2514–2525.
- 24 Shishiba Y, Kamijo K, Kurihara H, Ozawa Y, Konishi J, et al. (2002) Differential diagnosis of silent thyroiditis from Graves’ disease in thyrotoxicosis by the measurement of the urinary iodine. Horumon To Rinsho 50: 117–128 (In Japanese).
- 25 Momotani N, Noh J, Ishikawa N, Ito K (1994) Relationship between silent thyroiditis and recurrent Graves’ disease in the postpartum period. J Clin Endocrinol Metab 79: 285–289.
- 26 Peduzzi P, Concato J, Kemper E, Holford TR, Feinstein AR (1996) A simulation study of the number of events per variable in logistic regression analysis. J Clin Epidemiol 49: 1373–1379.
- 27 Obayashi H (2016) Interpretation of logistic regression and propensity score analysis. Tenri Medical Bulletin 19: 71–79 (In Japanese).
- 28 Burch HB, Cooper DS (2018) Anniversary review: antithyroid drug therapy: 70 years later. Eur J Endocrinol 179: R261–R274.
- 29 Ravera S, Reyna-Neyra A, Ferrandino G, Amzel LM, Carrasco N (2017) The Sodium/Iodide Symporter (NIS): molecular physiology and preclinical and clinical applications. Annu Rev Physiol 79: 261–289.
- 30 Spitzweg C, Morris JC (2002) The sodium iodide symporter: its pathophysiological and therapeutic implications. Clin Endocrinol (Oxf) 57: 559–574.
- 31 Eng PH, Cardona GR, Fang SL, Previti M, Alex S, et al. (1999) Escape from the acute Wolff-Chaikoff effect is associated with a decrease in thyroid sodium/iodide symporter messenger ribonucleic acid and protein. Endocrinology 140: 3404–3410.
- 32 Leoni SG, Kimura ET, Santisteban P, De la Vieja A (2011) Regulation of thyroid oxidative state by thioredoxin reductase has a crucial role in thyroid responses to iodide excess. Mol Endocrinol 25: 1924–1935.
- 33 Oddie TH, Meade JH Jr, Myhill J, Fisher DA (1996) Dependence of renal clearance of radioiodide on sex, age and thyroidal status. J Clin Endocrinol Metab 26: 1293–1296.
- 34 Ahad F, Ganie SA (2010) Iodine, iodine metabolism and iodine deficiency disorders revisited. Indian J Endocrinol Metab 14: 13–17.
- 35 Osaki Y, Sakurai K, Arihara Z, Hata M, Fukuzawa H (2012) Prediction of late (24-hour) radioactive iodine uptake using early (3-hour) uptake values in Japanese patients with Graves’ disease. Endocr J 59: 173–177.
- 36 Andre VA, Gross JL, Maia AL (2001) The effect of methimazole pretreatment on the efficacy of radioactive iodine therapy in Graves’ hyperthyroidism: one-year follow-up of a prospective, randomized study. J Clin Endocrinol Metab 86: 3488–3493.
- 37 Xing YZ, Zhang K, Jin G (2020) Predictive factors for the outcomes of Graves’ disease patients with radioactive iodine (131I) treatment. Biosci Rep 40: BSR20191609.
- 38 Wong KK, Shulkin BL, Gross MD, Avram AM (2018) Efficacy of radioactive iodine treatment of graves’ hyperthyroidism using a single calculated 131I dose. Clin Diabetes Endocrinol 4: 20.
- 39 Arata N, Isozaki O, Okamoto T, Tagami T, Hashimoto K, et al. (2019) What is the first choice of antithyroid drug therapy? In: Japan Thyroid Association (ed) Guideline for Treatment of Graves’ Disease in Japan 2019. Nankodo, Tokyo, Japan: 38–41 (In Japanese).
- 40 Aktay R, Rezai K, Seabold JE, Bar SR, Kirchner PT (1996) Four- to twenty-four-hour uptake ratio: an index of rapid iodine-131 turnover in hyperthyroidism. J Nucl Med 37: 1815–1819.
