Abstract
This study was established to explore the association of thyroid parameters including thyroid hormone and thyroid sensitivity indices with chronic kidney disease (CKD) in euthyroid patients with type 2 diabetes (T2D). CKD markers were defined by estimated glomerular filtration rate (eGFR) based on serum creatinine (Scr) (eGFRcr), eGFR based on cystatin C (cys C) (eGFRcys), and urinary albumin-to-creatinine ratio (UACR). Thyroid parameters, including triiodothyronine (FT3), free thyroxin (FT4), thyroid-stimulating hormone (TSH), FT3/FT4 ratio, TSH index (TSHI), and thyrotroph T4 resistance index (TT4RI), were measured. The prevalence rates of CKD defined by eGFRcys, eGFRcr, and UACR was 19.9%, 14.1%, and 50.6%, respectively. The eGFRcys and eGFRcr levels increased with increasing FT3 and FT3/FT4 tertiles, while the UACR levels increased with decreasing FT3 tertiles. Spearman’s analysis demonstrated that FT3 and FT3/FT4 were positively associated with eGFRcys and eGFRcr, and negatively associated with UACR. In logistic regression analyses, compared with the lowest FT3 tertile (≤4.12 pmol/L), the adjusted ORs for CKD (eGFRcys <60 mL/min/1.73 m2) in the middle FT3 tertile (4.12–4.74 pmol/L) and higher FT3 tertile (>4.74 pmol/L) were 0.248 and 0.153, respectively, but prominent associations of thyroid parameters with eGRFcr <60 mL/min/1.73 m2 and UACR were not observed after adjustment. Linear regression analysis demonstrated that eGFRcys was more strongly associated with FT3 than eGFRcr or UACR in the adjusted model. Among euthyroid patients with T2D, FT3 in the normal range was the independent factor most strongly related to CKD. Additionally, eGFRcys rather than eGFRcr or UACR was the CKD marker most associated with FT3.
CHRONIC KIDNEY DISEASE (CKD) is a global public health problem with increasing prevalence and mortality. Diabetes has become the major cause of CKD [1]. Meanwhile, CKD is the main cause of end-stage kidney disease in patients with type 2 diabetes (T2D) worldwide [2]. In a cohort of 512,700 adults in Taiwan participating in a health surveillance program from 1994 to 2008, it was found that one-third of diabetes patients had early kidney disease, and the mortality rate for these patients was nearly twice that for those with either early CKD or diabetes without CKD [3]. This highlights the importance of diagnosing and preventing early CKD in T2D patients.
Thyroid hormones have been shown to influence the growth and function of the kidneys and be involved in glucose and lipid metabolism [4, 5]. Numerous studies on the relationship between thyroid hormones and CKD have been carried out [6-9]. For example, one study performed in Germany found that the prevalence of low-T3 syndrome in patients with advanced kidney disease was 2.5 times higher than in those with normal kidney function [9]. Meanwhile, some studies have shown that thyroid hormones and their sensitivity might be associated with diabetes, metabolic syndrome, and insulin resistance [10, 11]. A cross-sectional hospital-based study found that the prevalence of thyroid dysfunction in T2D patients was 16.2% [12]. Besides, a nationwide Danish study showed that patients with hyperthyroidism had a higher risk of developing diabetes [13]. Although accumulating evidence indicates the relationship between thyroid hormones and CKD, few studies have explored the effect of thyroid hormones on kidney injury, as well as the correlation between them, in T2D patients, who are more likely to suffer from chronic kidney injury. Yang et al. reported the relationship between thyroid function and CKD in T2D patients [14], but they did not analyze the influence of thyroid function on CKD. Moreover, some studies on the general euthyroid population reported that a high level of TSH and low level of FT3 were also associated with CKD and albuminuria [15, 16]. The fluctuation of thyroid hormones within the normal physiological range would also affect renal function. However, whether thyroid hormones are related to impaired renal function in euthyroid patients with T2D has remained unknown.
Conventionally, thyroid function is evaluated using serum free triiodothyronine (FT3), free thyroxin (FT4), and thyroid-stimulating hormone (TSH) levels. There are complex interactions among FT3, FT4, and TSH, and the FT3/FT4 ratio can reflect the peripheral sensitivity to thyroid hormones [17]. Moreover, the triglyceride-glucose (TyG) index has been reported to be useful for detecting T2D with high sensitivity and specificity [18]. One study reported that this index is also associated with the risk of thyroid papillary cancer [19]. Meanwhile, renal function can be evaluated using the estimated glomerular filtration rate (eGFR) based on serum creatinine (Scr) (eGFRcr), and the urinary albumin-to-creatinine ratio (UACR) [20]. Serum cystatin C (cys C), a cysteine protease inhibitor found in virtually all human tissues and body fluids that is less affected by age, ethnicity, or muscle mass than Scr [21], is now considered to be a potential alternative for estimating GFR, especially in diabetes [22]. Moreover, one study showed that eGFR based on cys C (eGFRcys) could act as a confirmatory index for CKD [23]. Against this background, in this cross-sectional study, we investigated whether thyroid parameters, including TSH, FT3, FT4, FT3/FT4, TSH index (TSHI), and thyrotroph T4 resistance index (TT4RI), are associated with the prevalence of renal dysfunction defined as reduced eGFRcr, reduced eGFRcys, or higher UACR in euthyroid patients with T2D. This study may aid the detection of CKD in T2D patients.
Materials and Methods
Participants
We conducted a cross-sectional study on an initial sample of 426 T2D patients consecutively recruited from February 2021 to April 2022 at the inpatient department of Hubei Integrated TCM&WM Hospital (Wuhan, China). All enrolled patients were allowed to continue their previous treatment regimens. Finally, 306 patients were included in this study.
Inclusion criterion were as follows: (1) adult patients diagnosed with T2D in accordance with the Chinese Diabetes Society criteria [24]; and (2) normal thyroid function and TSH, FT4, and FT3 levels within their normal reference ranges (i.e., 0.35–5.5 μIU/mL, 11.5–22.7 pmol/L, and 3.5–6.5 pmol/L, respectively). Exclusion criteria were as follows: (1) a history of thyroid surgery or treatment of thyroid diseases; (2) acute complications of T2D (e.g., diabetic ketoacidosis and hypertonic coma), foot ulcers, and severe acute and chronic infections; (3) chronic liver disease, dialysis, or kidney transplantation; (4) pregnant or lactating women; and (5) missing Cys C, Scr, or albumin data. All patients enrolled in this study provided written informed consent. The Institutional Review Board of Hubei Integrated TCM&WM Hospital (2022-003) approved the protocol of this study.
Clinical examination and laboratory measurements
Subjects were interviewed regarding their medical history by a physician. A trained examiner measured their height and body weight, from which body mass index (BMI) was calculated. Smokers were defined as those smoking ≥1 cigarette per day, continuously or for a total of 6 months. Those consuming alcohol were defined as individuals consuming >20 g of alcohol per day in the last month.
Blood and urine samples were analyzed at the medical examination center of Hubei Integrated TCM&WM Hospital. Concentrations of blood urea nitrogen (BUN) and Scr were analyzed by the urease-ultraviolet rate method and sarcosine oxidase method, respectively. Serum uric acid was determined using the enzymatic colorimetric method. Alanine aminotransferase (ALT) and aspartate aminotransferase (AST) were measured by the continuous monitoring method. Triglyceride (TG) was analyzed by the glycerophosphate oxidase-peroxidase antiperoxidase (GPO-PAP) method, total cholesterol (TC) was tested by the cholesterol oxidase-peroxidase antiperoxidase (CHOD-PAP) method, high-density-lipoprotein cholesterol (HDL-C) was measured by the direct catalase scavenging method, and low-density-lipoprotein cholesterol (LDL-C) was determined by the surfactant method. Cys C was tested by latex-enhanced immunoturbidimetry. Urine albumin and urine creatinine were evaluated through immunoturbidimetry and an enzymatic method, respectively. All of these analyses were performed using an automatic biochemical analyzer (TBA-FX8; Toshiba Corp., Tokyo, Japan). The levels of TSH, FT4, and FT3 were analyzed by direct chemiluminescence methods with an automated chemiluminescence immunoassay analyzer (ADVIA Centaur XPT; Siemens Corp., Berlin, Germany). Serum hemoglobin A1c (HbA1c) was measured by a high-performance liquid chromatography assay using a hemoglobin testing system (H9; Pumen Technical Corp., Shenzhen, China).
Definitions
Hypertension was defined as systolic blood pressure ≥140 mmHg, diastolic blood pressure ≥90 mmHg, or both, or if the patient was already taking antihypertensive drugs.
CKD was evaluated based on UACR and eGFR levels and was defined as the presence of albuminuria (UACR ≥30 mg/g) or eGFR <60 mL/min/1.73 m2, based on SCr or cys C levels [23, 25].
Albuminuria was defined using UACR of a single early-morning urine measurement. Diabetic retinopathy (DR) was evaluated by an ophthalmologist.
The triglyceride-glucose (TyG) index was determined as ln[fasting triglycerides (mg/dL) × fasting glucose (mg/dL)/2] [18].
The indices of sensitivity to thyroid hormones were as follows: 1) FT3/FT4 ratio = FT3 (pmol/L)/FT4 (pmol/L), reflecting the peripheral sensitivity to thyroid hormones. A higher value reflects higher sensitivity. 2) TSHI = ln TSH (mIU/L) + 0.1345 × FT4 (pmol/L) [26] and TT4RI = FT4 (pmol/L) × TSH (mIU/L) [27], reflecting the central sensitivity to thyroid hormones. Here, a higher value reflects lower sensitivity.
Statistical analysis
SPSS version 22.0 (SPSS, Chicago, IL, USA) was used for statistical analyses. All of the results are presented as mean ± standard deviation (SD), median (25th–75th percentile), or number (percentage). Trivariate comparisons of the tertile levels of TSH, FT3, FT4, FT3/FT4, TSHI, and TT4RI were performed by ANOVA or the Kruskal-Wallis test. Spearman’s test was used to assess univariate correlations between thyroid parameters and different clinical characteristics. Binary logistic regression (for eGFR and UACR) was used to reveal whether thyroid parameters were independently associated with CKD. Linear regression was applied to reveal the significant linear associations of eGFRcys, eGFRcr, and UACR with FT3. The continuous variables were ln-transformed to create a normal distribution before linear regression analysis. The regression included adjustment for the following potential confounders: drinking status, smoking status, age, sex, BMI, diabetic course, HbA1c, TyG index, hypertension, DR, use of renin-angiotensin-aldosterone system (RAAS) inhibitor, and use of sodium-glucose cotransporter 2 (SGLT2) inhibitor. p < 0.05 was considered to reflect statistical significance.
Results
Characteristics of the study population
A total of 306 euthyroid patients with T2D were recruited in this study, of whom 161 (52.6%) were male and 145 (47.4%) were female. The age of the participants was 61.64 ± 12.4 years old and their BMI was 24.82 kg/m2. The characteristics of this population are presented in Table 1.
Table 1
Baseline characteristics of the euthyroid patients with type 2 diabetes (
n = 306)
| Variable |
Value |
| Age (yr) |
61.64 ± 12.40 |
| Gender (M/F) |
161(52.6%)/145(47.4%) |
| BMI (kg/m2) |
24.82 ± 3.41 |
| Course of diabetes (yr) |
10 (5–14) |
| HbA1c (%) |
8.30 (7–10.10) |
| FBG (mmol/L) |
8 (6.58–10.64) |
| PG2H (mmol/L) |
13.7 (10.6–17.02) |
| BUN (mmol/L) |
6.13 (4.96–7.60) |
| Scr (umol/L) |
65.10 (54.45–80.85) |
| Cysc (mg/dL) |
0.83 (0.70–1.06) |
| eGFRcys (mL/min/1.73 m2) |
95.77 (68.00–110.22) |
| eGFRcr (mL/min/1.73 m2) |
94.47 (81.87–104.74) |
| UACR (mg/g) |
56.34 (24.38–200.51) |
| TSH (uIU/mL) |
2.29 ± 1.25 |
| FT3 (pmol/L) |
4.40 (3.95–4.88) |
| FT4 (pmol/L) |
15.73 (14.20–17.18) |
| FT3/FT4 |
0.28 ± 0.06 |
| TSHI |
2.802 ± 0.70 |
| TT4RI |
33.07 (20.90–49.39) |
| TC (mmol/L) |
4.54 (3.80–5.35) |
| TG (mmol/L) |
1.63 (1.09–2.38) |
| LDL-C (mmol/L) |
2.12 ± 0.73 |
| TyG index |
8.91 (8.46–9.46) |
| Blood uric acid (μmol/L) |
348.52 ± 106.67 |
| Hypertension (%) |
159/306 (52.0%) |
| SBP (mmHg) |
130 (120–140) |
| DBP (mmHg) |
80 (75–89) |
| HR (bpm) |
75 (70–90) |
| ALT (U/L) |
16 (11–23) |
| AST (U/L) |
19 (15–23) |
| DR (%) |
79/306 (25.8%) |
| CKD (eGFRcys <60 mL/min/1.73 m2) |
61/306 (19.9%) |
| CKD (eGFRcr <60 mL/min/1.73 m2) |
43/306 (14.1%) |
| CKD (UACR ≥30 mg/g) |
| 30–300 mg/g |
178/306 (58.2%) |
| ≥300 mg/g |
76/306 (24.8%) |
| Smoking, % |
36/306 (11.8%) |
| Drinking, % |
30/306 (9.8%) |
| Anti-hypertensive agents, % |
| Calcium antagonist |
98/306 (32.0%) |
| RAAS inhibitor |
50/306 (16.3%) |
| Beta bloker |
31/306 (10.1%) |
| Diabetes treatment, % |
| SGLT2 inhibitor |
89/306 (29.1%) |
| Insulin |
200/306 (65.4%) |
Values are given as mean ± SD or median (25th–75th percentiles) or number (percentage).
BMI, body mass index; HbA1c, glycated hemoglobin; FBG, fasting blood glucose; PG2H, 2-hour postprandial blood glucose; BUN, blood urea nitrogen; Scr, serum creatinine; Cysc, cystatin C; eGFRcys, estimated glomerular filtration rate based on serum cystatin C; eGFRcr, estimated glomerular filtration rate based on serum creatinine; UACR, urinary albumin-to creatinine ratio; TSH, thyroid stimulating hormone; FT3, free triiodothyronine; FT4, free thyroxine; FT3/FT4, free triiodothyronine/free thyroxine ratio; TSHI = ln TSH (mIU/L) + 0.1345 * FT4 (pmol/L); TT4RI = FT4 (pmol/L) * TSH (mIU/L); TC, total cholesterol; TG, triglyeride; LDL-C, low-density lipoprotein cholesterol; TyG, triglyceride-glucose index; SBP, systolic pressure; DBP, diastolic pressure; HR, heat rate; ALT, alanine transaminase; AST, aspartic transaminase; DR, diabetic retinopathy; CKD, chronic kidney disease.
We analyzed the median eGFRcys, eGFRcr, and UACR according to the tertile levels of TSH, FT3, FT4, FT3/FT4, TSHI, and TT4RI. In detail, the tertiles were defined as follows: TSH-Q1 (≤1.61 μIU/mL), TSH-Q2 (1.61–2.66 μIU/mL), TSH-Q3 (>2.66 μIU/mL); FT3-Q1 (≤4.12 pmol/L), FT3-Q2 (4.12–4.74 pmol/L), FT3-Q3 (>4.74 pmol/L); FT4-Q1 (≤14.81 pmol/L), FT4-Q2 (14.81–16.61 pmol/L), FT4-Q3 (>16.61 pmol/L); FT3/FT4-Q1 (≤0.26), FT3/FT4-Q2 (0.26–0.30), FT3/FT4-Q3 (>0.30); TSHI-Q1 (≤2.54), TSHI-Q2 (2.54–3.17), TSHI-Q3 (>3.17); and TT4RI-Q1 (≤24.77), TT4RI-Q2 (24.77–42.81), and TT4RI-Q3 (>42.81).
The results showed that the median levels of eGFRcys exhibited a rising tendency according to the tertiles based on FT3 (70.91, 99.04, 102.02, p < 0.001) and FT3/FT4 (93.44, 93.96, 99.44, p < 0.05). Furthermore, compared with the FT3-Q1 group, patients in the FT3-Q2 and FT3-Q3 groups had higher levels of eGFRcys (both p < 0.001); additionally, compared with the FT3-Q2 group, patients in the FT3-Q3 group had higher levels of eGFRcys (p < 0.05). Besides, a higher eGFRcys median was observed in the FT3/FT4-Q3 group than in the FT3/FT4-Q1 group (p < 0.05). Meanwhile, the differences in the levels of eGFRcys among FT4 groups or TSH groups were not statistically significant (Fig. 1A).
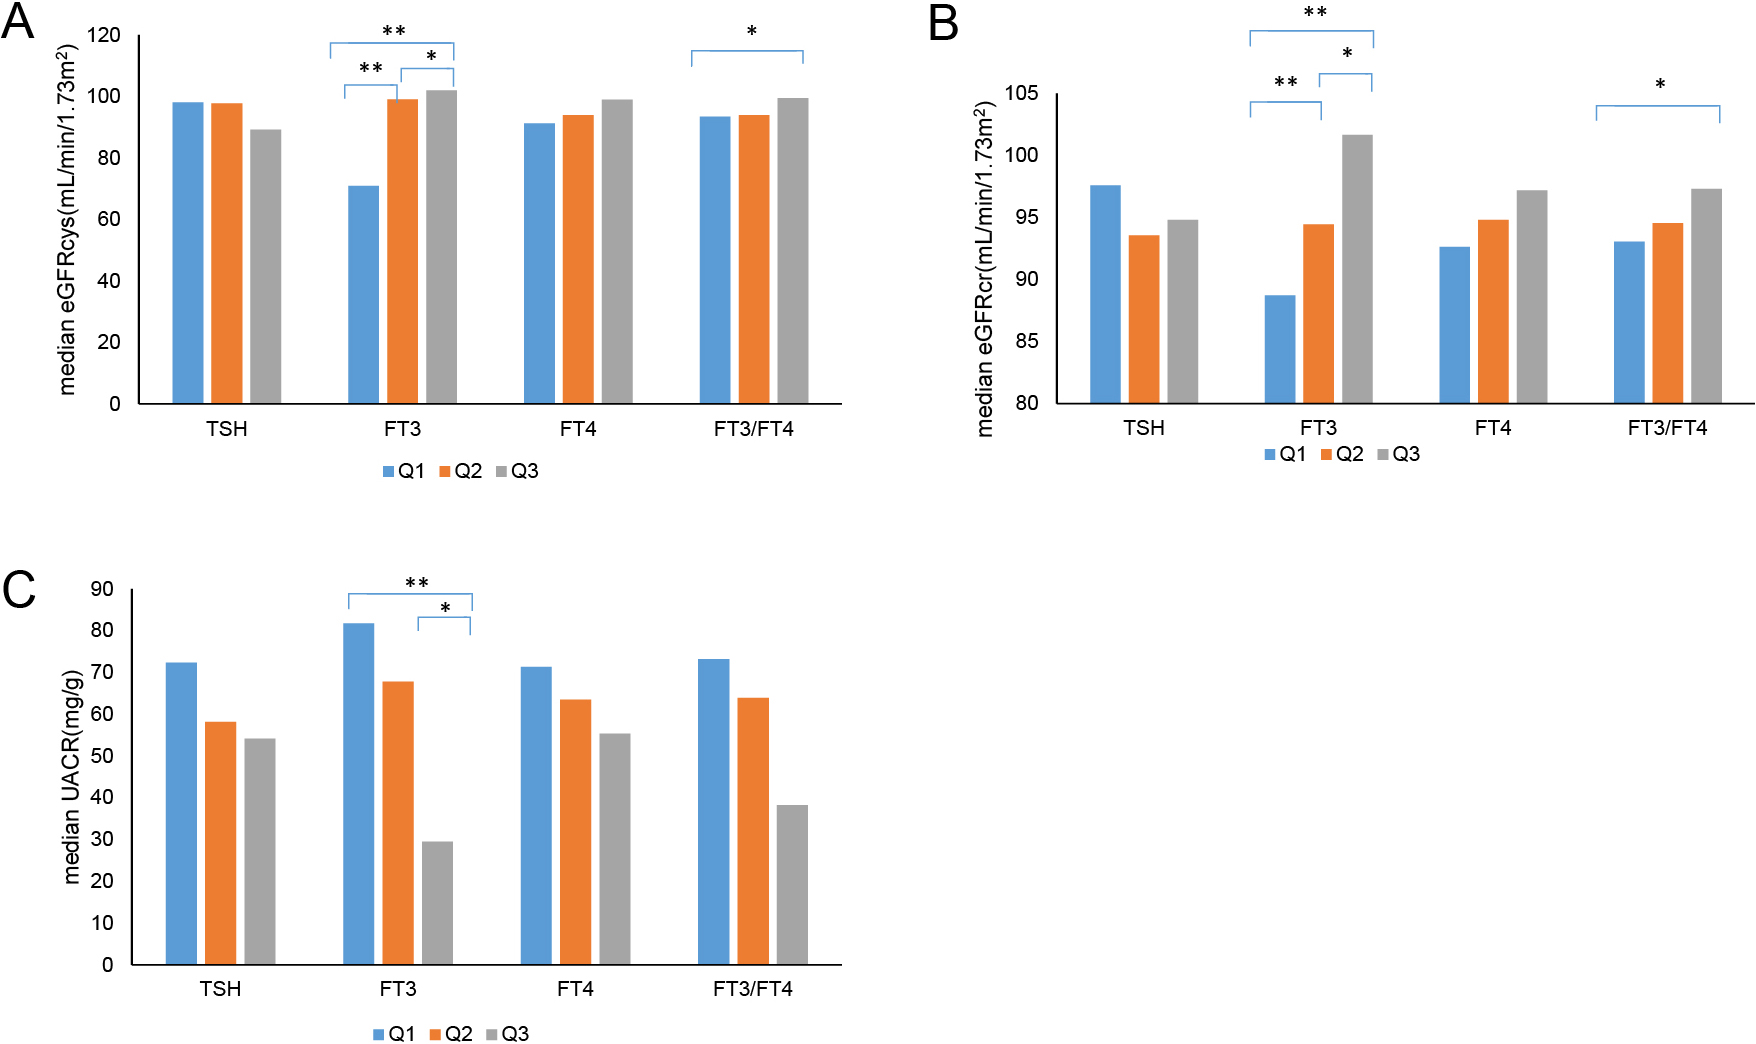
In terms of eGFRcr, we also observed a trend similar to that for eGFRcys. Specifically, eGFRcr increased with increasing levels of FT3 (88.73, 94.47, 101.66, p < 0.001) and FT3/FT4 tertiles (93.05, 94.55, 97.3, p < 0.05). Moreover, compared with the FT3-Q1 group, both FT3-Q2 and FT3-Q3 groups had higher eGFRcr median (both p < 0.001). In addition, patients in the FT3-Q3 group had higher levels of eGFRcr than those in the FT3-Q2 group (p < 0.05). We also found that the level of eGFRcr in the FT3/FT4-Q3 group was higher than that in the FT3/FT4-Q1 group (p < 0.05). Meanwhile, the differences between the FT4 groups and TSH groups in the level of eGFRcr were not statistically significant (Fig. 1B).
In terms of UACR, we found that the levels of UACR were negatively associated with the tertiles of FT3 (81.74, 67.79, 29.5, p < 0.01). Compared with the FT3-Q3 group, both FT3-Q1 and FT3-Q2 groups had higher median UACR (p < 0.05). Meanwhile, the differences in the levels of eGFRcys among the FT4 group, TSH group, and FT3/FT4 group, were not statistically significant (Fig. 1C). There were also no significant differences in eGFRcys, eGFRcr, and UACR among the different TSHI and TT4RI groups (data not shown).
Factors affecting eGFRcys, eGFRcr, and UACR
Spearman’s analysis was used to assess the correlation of eGFRcys, eGFRcr, and UACR with thyroid parameters, age, diabetic course, HbA1c, and TyG. Table 2 shows that age, diabetic course, and HbA1c were negatively associated with eGFRcys and eGFRcr (p < 0.05). In addition, eGFRcys significantly correlated with FT3 and FT3/FT4 (r = 0.326, p < 0.001; r = 0.171, p < 0.01, respectively), while eGFRcr was significantly associated with FT3, FT4, and FT3/FT4 (r = 0.324, p < 0.001; r = 0.133, p < 0.05; r = 0.165, p < 0.01, respectively). Moreover, UACR exhibited significant negative associations with FT3 and FT3/FT4 (r = –0.255, p < 0.001; r = –0.186, p < 0.01, respectively), along with significant positive associations with age, diabetic course, HbA1c, and TyG (r = 0.168, p < 0.01; r = 0.193, p < 0.01; r = 0.156, p < 0.05; r = 0.285, p < 0.001, respectively). Kidney function did not correlate with the levels of TSH, TSHI, and TT4RI (p > 0.05).
Table 2
Correlation of eGFRcys, eGFRcr, and UACR with clinical characteristics
|
TSH |
FT3 |
FT4 |
FT3/FT4 |
TSHI |
TT4RI |
Age |
Diabetic course |
HbA1c |
TyG |
| eGFRcys |
rho |
–0.095 |
0.326 |
0.107 |
0.171 |
–0.016 |
–0.040 |
–0.678 |
–0.440 |
–0.146 |
0.088 |
| p |
0.123 |
<0.001** |
0.072 |
0.004** |
0.794 |
0.517 |
<0.001** |
<0.001** |
0.012* |
0.143 |
| eGFRcr |
rho |
0.047 |
0.324 |
0.133 |
0.165 |
0.01 |
–0.017 |
–0.664 |
–0.405 |
–0.120 |
0.066 |
| p |
0.448 |
<0.001** |
0.025* |
0.006** |
0.858 |
0.782 |
<0.001** |
<0.001** |
0.042* |
0.273 |
| UACR |
rho |
–0.081 |
–0.255 |
–0.014 |
–0.186 |
–0.055 |
–0.081 |
0.168 |
0.193 |
0.156 |
0.285 |
| p |
0.229 |
<0.001** |
0.828 |
0.004** |
0.412 |
0.226 |
0.006** |
0.002** |
0.013* |
<0.001** |
* p < 0.05, ** p < 0.01; TSH, thyroid stimulating hormone; FT3, free triiodothyronine; FT4, free thyroxine; FT3/FT4, free triiodothyronine/free thyroxine ratio; TSHI = ln TSH (mIU/L) + 0.1345 * FT4 (pmol/L); TT4RI = FT4 (pmol/L) * TSH (mIU/L); HbA1c, glycated hemoglobin; TyG, triglyceride-glucose index; eGFRcys, estimated glomerular filtration rate based on serum cystatin C; eGFRcr, estimated glomerular filtration rate based on serum creatinine; UACR, urinary albumin-to creatinine ratio.
Logistic regression analysis was used to identify the correlations between thyroid parameter tertile levels and CKD markers. Compared with those in FT3-Q1, the crude ORs for CKD (eGFRcys <60 mL/min/1.73 m2) in FT3-Q2 and FT3-Q3 were 0.150 (0.059–0.382) and 0.044 (0.011–0.178) (both p < 0.001), while the crude ORs for CKD (eGFRcr <60 mL/min/1.73 m2) in FT3-Q2 and FT3-Q3 were 0.236 (0.081–0.688) and 0.086 (0.018–0.417) (both p < 0.01), respectively. However, no correlation with CKD (UACR ≥30 mg/g) was found in the FT3 groups. When compared with those in FT4-Q1, only the crude OR for CKD (eGFRcr <60 mL/min/1.73 m2) in FT4-Q2 was statistically significant [OR: 3.386 (1.070–10.713), p < 0.05]. There was no significant association between any CKD markers and TSH and FT3/FT4 groups (Table 3-model 1).
Table 3
Relationship of thyroid parameter tertile levels with the markers of CKD
| Variable |
Tertiles |
eGFRcys <60 mL/min/1.73 m2 |
eGFRcr <60 mL/min/1.73 m2 |
UACR ≥30 mg/g |
| OR (95%CI) |
p |
OR (95%CI) |
p |
OR (95%CI) |
p |
| Model 1 |
| TSH (uIU/mL) |
Q1 (≤1.61) |
1 |
— |
1 |
— |
1 |
— |
|
Q2 (1.61–2.66) |
1.285
(0.554–2.979) |
0.559 |
1.435
(0.551–3.736) |
0.459 |
1.082
(0.545–2.152) |
0.821 |
|
Q3 (>2.66) |
1.583
(0.681–3.677) |
0.286 |
1.389
(0.526–3.669) |
0.507 |
1.0726
(0.546–2.120) |
0.833 |
| FT3 (pmol/L) |
Q1 (≤4.12) |
1 |
— |
1 |
— |
1 |
— |
|
Q2 (4.12–4.74) |
0.150
(0.059–0.382) |
<0.001** |
0.236
(0.081–0.688) |
0.008** |
0.615
(0.354–1.850) |
0.809 |
|
Q3 (>4.74) |
0.044
(0.011–0.178) |
<0.001** |
0.086
(0.018–0.417) |
0.002** |
0.410
(0.152–1.107) |
0.078 |
| FT4 (pmol/L) |
Q1 (≤14.81) |
1 |
— |
1 |
— |
1 |
— |
|
Q2 (14.81–16.61) |
2.570
(0.971–6.802) |
0.057 |
3.386
(1.070–10.713) |
0.038* |
0.958
(0.448–2.049) |
0.911 |
|
Q3 (>16.61) |
2.998
(0.911–9.863) |
0.071 |
3.132
(0.755–12.998) |
0.116 |
0.827
(0.316–2.164) |
0.699 |
| FT3/FT4 ratio |
Q1 (≤0.26) |
1 |
— |
1 |
— |
1 |
— |
|
Q2 (0.26–0.30) |
2.197
(0.818–5.902) |
0.119 |
2.161
(0.690–6.769) |
0.186 |
1.257
(0.568–2.783) |
1.257 |
|
Q3 (>0.30) |
2.965
(0.741–11.864) |
0.124 |
2.463
(00.488–12.442) |
0.275 |
0.810
(0.286–2.297) |
0.692 |
| Model 2 |
| TSH (uIU/mL) |
Q1 (≤1.61) |
1 |
— |
1 |
— |
1 |
— |
|
Q2 (1.61–2.66) |
0.798
(0.271–2.344) |
0.681 |
1.038
(0.343–3.143) |
0.948 |
1.017
(0.496–2.083) |
0.964 |
|
Q3 (>2.66) |
0.876
(0.302–2.539) |
0.807 |
1.034
(0.334–3.199) |
0.954 |
0.987
(0.478–2.036) |
0.971 |
| FT3 (pmol/L) |
Q1 (≤4.12) |
1 |
— |
1 |
— |
1 |
— |
|
Q2 (4.12–4.74) |
0.248
(0.078–0.782) |
0.017 |
0.385
(0.113–1.316) |
0.128 |
0.974
(0.407–2.327) |
0.952 |
|
Q3 (>4.74) |
0.153
(0.028–0.822) |
0.029 |
0.211
(0.034–1.302) |
0.094 |
0.584
(0.199–1.710) |
0.326 |
| FT4 (pmol/L) |
Q1 (≤14.81) |
1 |
— |
1 |
— |
1 |
— |
|
Q2 (14.81–16.61) |
1.955
(0.578–6.615) |
0.281 |
2.474
(0.698–8.762) |
0.160 |
1.053
(0.458–2.417) |
0.904 |
|
Q3 (>16.61) |
2.267
(0.482–10.660) |
0.300 |
2.218
(0.447–11.003) |
0.330 |
0.906
(0.323–2.537) |
0.851 |
| FT3/FT4 ratio |
Q1 (≤0.26) |
1 |
— |
1 |
— |
1 |
— |
|
Q2 (0.26–0.30) |
1.849
(0.567–6.023) |
0.308 |
1.893
(0.536–6.681) |
0.322 |
1.368
(0.607–3.083) |
0.450 |
|
Q3 (>0.30) |
2.277
(0.398–13.024) |
0.355 |
2.861
(0.444–18.413) |
0.269 |
0.921
(0.303–2.799) |
0.885 |
Odds ratio (OR) and 95% confidence interval (CI) was evaluated by binary logistic regression.
Model 1: crude model. Model 2: adjusted for smoking status, drinking status, age, BMI, sex, diabetic course, HbA1c, TyG index, hypertension, DR, use of RAAS inhibitor, use of SGLT-2 inhibitor. * p < 0.05; ** p < 0.01
TSH, thyroid stimulating hormone; FT3, free triiodothyronine; FT4, free thyroxine; FT3/FT4, free triiodothyronine/free thyroxine ratio; eGFRcys, estimated glomerular filtration rate based on serum cystatin C; eGFRcr, estimated glomerular filtration rate based on serum creatinine; UACR, urinary albumin-to creatinine ratio.
When adjusted for drinking status, smoking status, age, sex, BMI, diabetic course, HbA1c, TyG index, hypertension, DR, use of RAAS inhibitor, and use of SGLT2 inhibitor, only FT3 was independently associated with CKD (eGFRcys <60 mL/min/1.73 m2). The ORs (95% CI) for eGFRcys <60 mL/min/1.73 m2 in FT3-Q2 and FT3-Q3 were 0.248 (0.078–0.782) and 0.153 (0.028–0.822) (both p < 0.05) (Table 3-model 2).
Furthermore, linear regression analysis was applied to reveal the significant linear associations of eGFRcys, eGFRcr, and UACR with FT3. The following potential modifiers were involved: drinking status, smoking status, age, BMI, sex, diabetic course, HbA1c, TyG index, hypertension, DR, use of RAAS inhibitors, and use of SGLT2 inhibitors. We found that lneGFRcys (β' = 0.328, p = 0.001) and lnHbA1c (β' = –0.309, p = 0.002) finally entered the equation, meaning that eGFRcys was better than eGFRcr or UACR independently associated with FT3.
Age is an important factor influencing eGFR and FT3. To exclude the influence of age on the above conclusion, we grouped all data by age, with reference to a previous study [28]. Then, we applied logistic regression analysis to detect the association between CKD-related indicators and thyroid hormones. After age stratification, there were only 15 cases with age ≤40 years, and the eGFR was all >60 mL/min/1.73 m2, which did not allow for regression analysis. We conducted chi-squared test on UACR and the tertiles of FT3, and the p-value was 0.007. In the age group of 40–65 years old (n = 166), the results of logistic regression analysis showed that, compared with those in the lowest tertile FT3-Q1 (≤4.12 pmol/L), the ORs for eGFRcys <60 mL/min/1.73 m2 in FT3-Q2 and FT3-Q3 were 0.053 (0.005–0.566, p = 0.015) and 0.003 (0.000–0.132, p = 0.003), respectively. In the age group of ≥65 years old, the results of logistic regression analysis showed that, compared with those in FT3-Q1, the ORs for eGFRcys <60 mL/min/1.73 m2 in FT3-Q2 and FT3-Q3 were 0.110 (0.029–0.413, p = 0.001) and 0.117 (0.019–0.727, p = 0.021), respectively. In summary, the correlation between CKD index and FT3 was still maintained after grouping the subjects by age. We also included age as a covariate in the regression analysis. Compared with those in FT3-Q1, the adjusted ORs for eGFRcys <60 mL/min/1.73 m2 in FT3-Q2 and FT3-Q3 were 0.146 (0.05–0.426, p = 0.000) and 0.056 (0.011–0.279, p = 0.000), respectively. All of these results showed that FT3 was still associated with eGFRcys after adjusting for age.
Discussion
This cross-sectional study confirms that, in euthyroid patients with T2D, subjects in the lower FT3 tertile are more associated with CKD (reduced eGFR) than those in the higher FT3 tertile after adjusting for confounding factors. The results also indicate that, among three markers of CKD (eGFRcr, UACR, and eGFRcys), eGFRcys shows a stronger association with FT3 levels.
In this study, we used three markers to evaluate renal function. The prevalence of CKD in our study was 14.1% as determined by eGFRcr, 19.9% by eGFRcys, and 50.6% by UACR. This is similar to the findings in previous reports: In studies from South Korea [29] and the USA [23], the prevalence rates of CKD were 11.4% and 16.5% by eGFRcr, and 20.1% and 22% by eGFRcys, respectively. In addition, another review reported similar prevalence of CKD that approximately 30%–50% of all adults with T2D had an elevated UACR compared with healthy controls [30].
Previous studies reported that a lower FT3 level was related to CKD [7, 29]. However, in the present study, this finding was repeated even in the normal reference range of thyroid function. Meanwhile, this study found that eGFR other than UACR was associated with FT3. In addition, after finding that lower FT3 was associated with CKD, we used regression analysis and adjusted for confounding factors to evaluate the relationship among three indices of kidneys and FT3. We found that the level of FT3 had a stronger association with eGFRcys, rather than eGFRcr or UACR. A previous study reported a similar result that focused on the relationship between thyroid function and various equations of kidney function in a euthyroid population [31]. However, the previous study included cases with and without diabetes, with the proportion of diabetics being only 2.8% [31]. As a free thyroid hormone, FT3 is actively metabolized in circulation and participates in many renal physiological processes [32]. Scr is susceptible to external factors and has some limitations for measuring creatinine to determine eGFR, especially in patients with reduced muscle mass [33]. Cys C is a protein that is produced at a relatively constant rate, and does not appear to be influenced by external factors [34]. It has a stronger and more linear relationship than Scr in assessing the risk of kidney disease [35]. It has also been reported that eGFRcys is more accurate than eGFRcr in predicting death and end-stage renal disease [35]. This may partly explain why FT3 is more strongly associated with eGFRcys rather than eGFRcr.
Although we found that FT3 was related to UACR in Spearman’s analysis, the independent association between FT3 and UACR disappeared after adjusting for confounders in regression analysis. The conclusion could be partly supported by a previous study that explored the association between thyroid function and albuminuria in the CKD population. It also showed that none of TSH, FT3, and FT4 was independently associated with albuminuria, while only T3 was related to it [29]. Unlike in our study, a previous Chinese study showed that FT3 was independently associated with UACR after adjusting for several risk factors in the euthyroid subgroup of the diabetic population [20]. The patients in our study had higher levels of HbA1C (our study 8.3% cf. previous study 7.2%) and we performed adjustment for the insulin resistance index (TyG index). All of these factors were reported to be strongly associated with thyroid hormones [10, 11]. Therefore, the different characteristics of these populations and confounders might have contributed to the resulting discrepancy.
Several mechanisms may explain the cross-sectional link between thyroid hormones and renal function. On the one hand, T3 can enhance the secretion of insulin by activating PI3-kinase, and the regulation of insulin secretion occurs in euthyroid individuals. Low FT3 levels within the normal reference range may affect the secretion of insulin and lead to the deterioration of hyperglycemia and insulin resistance [36]. On the other hand, T3 acts directly on the kidney, as a thyroid hormone that binds to thyroid hormone receptor a (TRa) in macrophages and ameliorates kidney inflammation by activating nuclear factor-kB. Otherwise, a lack of ligand-bound TRa is associated with increased expression of proinflammatory cytokines and the exacerbation of tubulointerstitial injury [37].
A recent study found that impaired sensitivity to thyroid hormone was associated with diabetes [10]. Therefore, we analyzed the relationship between thyroid sensitivity indices (TSHI, TT4RI) and three indices of CKD. However, we failed to detect any significant correlation between these indices in correlation analysis. One previous study concluded that thyroid hormones and thyroid sensitivity indices were associated with CKD in the euthyroid population [38]. In that study, a relationship between the sensitivity of thyroid hormone indices and eGFR was also identified in subjects younger or older than 65 years [38]. Another study focusing on the Chinese population found that thyroid sensitivity indices including TSHI and thyrotrophin thyroid hormone resistance index (TTSI) were associated with reduced eGFR. However, in the euthyroid subgroup, no significant associations of UACR and eGFR with thyroid sensitivity indices were identified [20]. These inconsistent results may have been due to the insufficient sample size, the population characteristics, or the different thyroid sensitivity indices used. Further research based on a larger population is needed to explore the relationship between thyroid hormone indices and eGFR.
The strengths of our study include the inclusion of a euthyroid Chinese T2D population and the characterization of thyroid parameters, including TSH, FT3, FT4, TSHI, and TF4RI, and three indices of CKD, namely, eGFRcys, eGFRcr, and UACR, along with the inclusion of adjustment for confounding factors. Nonetheless, our study still has several limitations: First, this is a cross-sectional study, so we could not determine the causal relationship between thyroid parameters and CKD. Second, the sample size in our study is insufficient. Hence, the findings should be further verified in prospective and large-scale studies.
Conclusion
Our findings suggest that there is a significant association between FT3 within the normal range and CKD in the euthyroid Chinese T2D population. We propose that monitoring FT3 levels within the normal range is necessary to limit the development of CKD. Our findings have important implications in real clinical settings and epidemiological investigations.
Acknowledgements
The authors would like to thank all people who participated in the study.
Authors’ Contributions
Wei Shi: Conceptualization; Funding acquisition; Roles/Writing – original draft
Daofei Song: Investigation; Resources
Dan Chen: Data curation; Formal analysis
Wei Duan: Project administration; Software
Jing Zhang: Methodology; Writing – review & editing
Funding
This research was supported by Hubei Provincial Health Commission (WJ2021M200).
Data Availability
The data used to support the findings of this study are available from the corresponding author upon request.
Declarations
Ethics approval and consent to participate
All patients enrolled in the study provided written informed consent. The Institutional Review Board of Hubei Integrated TCM&WM Hospital (2022-003) approved the study protocol.
Conflicts of interest
The authors declare that they have no conflicts of interest.
References
- 1 Li H, Lu W, Wang A, Jiang H, Lyu J (2021) Changing epidemiology of chronic kidney disease as a result of type 2 diabetes mellitus from 1990 to 2017: Estimates from Global Burden of Disease 2017. J Diabetes Investig 12: 346–356.
- 2 Tuttle KR, Jones CR, Daratha KB, Koyama AK, Nicholas SB, et al. (2022) Incidence of chronic kidney disease among adults with diabetes, 2015–2020. N Engl J Med 387: 1430–1431.
- 3 Wen CP, Chang CH, Tsai MK, Lee JH, Lu PJ, et al. (2017) Diabetes with early kidney involvement may shorten life expectancy by 16 years. Kidney Int 92: 388–396.
- 4 Braunlich H (1984) Postnatal development of kidney function in rats receiving thyroid hormones. Exp Clin Endocrinol 83: 243–250.
- 5 Sinha RA, Singh BK, Yen PM (2014) Thyroid hormone regulation of hepatic lipid and carbohydrate metabolism. Trends Endocrinol Metab 25: 538–545.
- 6 Wang K, Xie K, Gu L, Xu B, Chen J, et al. (2018) Association of thyroid function with the estimated glomerular filtration rate in a large Chinese euthyroid population. Kidney Blood Press Res 43: 1075–1083.
- 7 Reinhardt W, Mulling N, Behrendt S, Benson S, Dolff S, et al. (2021) Association between albuminuria and thyroid function in patients with chronic kidney disease. Endocrine 73: 367–373.
- 8 Schultheiss UT, Steinbrenner I, Nauck M, Schneider MP, Kotsis F, et al. (2021) Thyroid function, renal events and mortality in chronic kidney disease patients: the German chronic kidney disease study. Clin Kidney J 14: 959–968.
- 9 Peters J, Roumeliotis S, Mertens PR, Liakopoulos V (2021) Thyroid hormone status in patients with impaired kidney function. Int Urol Nephrol 53: 2349–2358.
- 10 Laclaustra M, Moreno-Franco B, Lou-Bonafonte JM, Mateo-Gallego R, Casasnovas JA, et al. (2019) Impaired sensitivity to thyroid hormones is associated with diabetes and metabolic syndrome. Diabetes Care 42: 303–310.
- 11 Park SY, Park SE, Jung SW, Jin HS, Park IB, et al. (2017) Free triiodothyronine/free thyroxine ratio rather than thyrotropin is more associated with metabolic parameters in healthy euthyroid adult subjects. Clin Endocrinol (Oxf) 87: 87–96.
- 12 Jali MV, Kambar S, Jali SM, Pawar N, Nalawade P (2017) Prevalence of thyroid dysfunction among type 2 diabetes mellitus patients. Diabetes Metab Syndr 11 (Suppl 1): S105–S108.
- 13 Brandt F, Thvilum M, Almind D, Christensen K, Green A, et al. (2013) Morbidity before and after the diagnosis of hyperthyroidism: a nationwide register-based study. PLoS One 8: e66711.
- 14 Yang Z, Duan P, Li W, Nie R, Lou X, et al. (2022) The correlation between thyroid hormone levels and the kidney disease progression risk in patients with type 2 diabetes. Diabetes Metab Syndr Obes 15: 59–67.
- 15 Zhou Y, Ye L, Wang T, Hong J, Bi Y, et al. (2014) Free triiodothyronine concentrations are inversely associated with microalbuminuria. Int J Endocrinol 2014: 959781.
- 16 Zhang Y, Chang Y, Ryu S, Cho J, Lee WY, et al. (2014) Thyroid hormone levels and incident chronic kidney disease in euthyroid individuals: the Kangbuk Samsung Health Study. Int J Epidemiol 43: 1624–1632.
- 17 Liu B, Wang Z, Fu J, Guan H, Lyu Z, et al. (2021) Sensitivity to thyroid hormones and risk of prediabetes: a cross-sectional study. Front Endocrinol (Lausanne) 12: 657114.
- 18 Yoon JS, Lee HJ, Jeong HR, Shim YS, Kang MJ, et al. (2022) Triglyceride glucose index is superior biomarker for predicting type 2 diabetes mellitus in children and adolescents. Endocr J 69: 559–565.
- 19 Alkurt EG, Sahin F, Tutan B, Canal K, Turhan VB (2022) The relationship between papillary thyroid cancer and triglyceride/glucose index, which is an indicator of insulin resistance. Eur Rev Med Pharmacol Sci 26: 6114–6120.
- 20 Chen Y, Zhang W, Wang N, Wang Y, Wang C, et al. (2020) Thyroid Parameters and Kidney Disorder in Type 2 Diabetes: Results from the METAL Study. J Diabetes Res 2020: 4798947.
- 21 Shlipak MG, Sarnak MJ, Katz R, Fried LF, Seliger SL, et al. (2005) Cystatin C and the risk of death and cardiovascular events among elderly persons. N Engl J Med 352: 2049–2060.
- 22 Pavkov ME, Knowler WC, Hanson RL, Williams DE, Lemley KV, et al. (2013) Comparison of serum cystatin C, serum creatinine, measured GFR, and estimated GFR to assess the risk of kidney failure in American Indians with diabetic nephropathy. Am J Kidney Dis 62: 33–41.
- 23 Tsai CW, Grams ME, Inker LA, Coresh J, Selvin E (2014) Cystatin C- and creatinine-based estimated glomerular filtration rate, vascular disease, and mortality in persons with diabetes in the U.S. Diabetes Care 37: 1002–1008.
- 24 Chinese Elderly Type 2 Diabetes Prevention and Treatment of Clinical Guidelines Writing Group; Geriatric Endocrinology and Metabolism Branch of Chinese Geriatric Society; Geriatric Endocrinology and Metabolism Branch of Chinese Geriatric Health Care Society; Geriatric Professional Committee of Beijing Medical Award Foundation; National Clinical Medical Research Center for Geriatric Diseases (PLA General Hospital) (2022) Clinical guidelines for prevention and treatment of type 2 diabetes mellitus in the elderly in China (2022 edition). Zhonghua Nei Ke Za Zhi 61: 12–50 (In Chinese).
- 25 Tuttle KR, Bakris GL, Bilous RW, Chiang JL, de Boer IH, et al. (2014) Diabetic kidney disease: a report from an ADA Consensus Conference. Diabetes Care 37: 2864–2883.
- 26 Jostel A, Ryder WD, Shalet SM (2009) The use of thyroid function tests in the diagnosis of hypopituitarism: definition and evaluation of the TSH Index. Clin Endocrinol (Oxf) 71: 529–534.
- 27 Yagi H, Pohlenz J, Hayashi Y, Sakurai A, Refetoff S (1997) Resistance to thyroid hormone caused by two mutant thyroid hormone receptors beta, R243Q and R243W, with marked impairment of function that cannot be explained by altered in vitro 3,5,3'-triiodothyroinine binding affinity. J Clin Endocrinol Metab 82: 1608–1614.
- 28 Liu P, Quinn RR, Lam NN, Elliott MJ, Xu Y, et al. (2021) Accounting for age in the definition of chronic kidney disease. JAMA Intern Med 181: 1359–1366.
- 29 Han Q, Zhang J, Wang Y, Li H, Zhang R, et al. (2019) Thyroid hormones and diabetic nephropathy: an essential relationship to recognize. Nephrology (Carlton) 24: 160–169.
- 30 Thomas MC, Cooper ME, Zimmet P (2016) Changing epidemiology of type 2 diabetes mellitus and associated chronic kidney disease. Nat Rev Nephrol 12: 73–81.
- 31 Anderson JLC, Gruppen EG, van Tienhoven-Wind L, Eisenga MF, de Vries H, et al. (2018) Glomerular filtration rate is associated with free triiodothyronine in euthyroid subjects: comparison between various equations to estimate renal function and creatinine clearance. Eur J Intern Med 48: 94–99.
- 32 Merzah K, Hasson S (2015) The Biochemical changes in patients with chronic renal failure. Int J Pharm Med Biol Sci 4: 75–76.
- 33 Levey AS, de Jong PE, Coresh J, El Nahas M, Astor BC, et al. (2011) The definition, classification, and prognosis of chronic kidney disease: a KDIGO Controversies Conference report. Kidney Int 80: 17–28.
- 34 Schwartz GJ, Furth SL (2007) Glomerular filtration rate measurement and estimation in chronic kidney disease. Pediatr Nephrol 22: 1839–1848.
- 35 Shlipak MG, Matsushita K, Arnlov J, Inker LA, Katz R, et al. (2013) Cystatin C versus creatinine in determining risk based on kidney function. N Engl J Med 369: 932–943.
- 36 Ortega E, Koska J, Pannacciulli N, Bunt JC, Krakoff J (2008) Free triiodothyronine plasma concentrations are positively associated with insulin secretion in euthyroid individuals. Eur J Endocrinol 158: 217–221.
- 37 Furuya F, Ishii T, Tamura S, Takahashi K, Kobayashi H, et al. (2017) The ligand-bound thyroid hormone receptor in macrophages ameliorates kidney injury via inhibition of nuclear factor-kappaB activities. Sci Rep 7: 43960.
- 38 Yang S, Lai S, Wang Z, Liu A, Wang W, et al. (2021) Thyroid feedback quantile-based index correlates strongly to renal function in euthyroid individuals. Ann Med 53: 1945–1955.
