Field Reports
Asbestos Exposure among Construction Workers During Demolition of Old Houses in Tehran, Iran
2014 年 52 巻 1 号 p. 71-77

詳細
2014 年 52 巻 1 号 p. 71-77
Air quality in demolition practices has seldom been evaluated in Iran. Accordingly, we evaluated asbestos exposure among Tehran construction workers during the demolition of old houses. To identify possible sources of asbestos exposure, including thermal insulations, chimney pipes and cement sheets, were all sampled. This study also were taken the personal air samples to evaluate any asbestos exposure during the demolition. The asbestos fibers found in the samples were analyzed by phase-contrast optical microscopy (PCM), scanning electron microscopy (SEM) equipped with an energy dispersive X-ray analysis, and polarized light microscopy (PLM) methods. Personal monitoring of asbestos fiber levels indicated a range from 0.01 to 0.15 PCM f/ml (0.02–0.42 SEM f/ml). The geometric mean concentrations were 0.07 PCM f/ml (0.20 SEM f/ml), which is considerably higher than the threshold limit value (TLV) proposed by American Conference of Governmental Industrial Hygienist (ACGIH), which is 0.1 f/ml. The analysis showed a presence in the bulk samples only chrysotile asbestos and an absence of the other type asbestos. Therefore, it might be expected that workers who worked in the demolition of old houses will suffer from negative effects of exposing to the asbestos fibers.
Demolition of aging housing is one of the main component of redevelopment and revitalization efforts in developed and developing countries in urban areas. In 2010, the municipal of Tehran estimates that 16300 older housing units will be demolished in urban areas. Asbestos is a fibrous silicate minerals, which are easily separated into thin, long, and flexible fibers when crushed or processed1, 2). These fibrous materials subdivided into two groups, serpentine group (chrysotile),which is used as the most commonly form of asbestos, and amphibole group (tremolite asbestos, amosite asbestos, actinolite asbestos, anthophllite asbestos, and crocidolite asbestos3). Asbestos contained in many materials used in construction and therefore potentially encountered during demolition of old houses. Asbestos has been found extensively in construction materials, including thermal insulation, fire proofing, decorative surfacing, pipe insulation, floor tiles, acoustical products, ventilation ducts and chimney pipes. During the demolition of residential or commercial structures these materials can be disturbed generating airborne asbestos fibers and placing those on site at risk of asbestos related diseases4, 5). Tang tong (2008) reported that construction workers may have been exposed to concentrations of airborne asbestos approximately 4 times higher than the OSHA PEL of 0.1 f/ml4). Other reported measurements of asbestos fibers during the demolition of roofing were 0.6 f/ml5). During recent decade, some courtiers have banned using all types of asbestos6, 7). However, widespread manufacturing and consumption of asbestos products such as binder in roofing papers, thermal insulation and asbestos cement sheet continues in developing countries6, 8). The ACGIH, OSHA, and NIOSH have issued a time-weighted threshold limit value (TLV-TWA), permissible exposure limit (PEL), and recommended exposure limit (REL), all of which are 0.1 f/ml9). Furthermore, in 1970, the OSHA has issued a standard classification system for the construction work, distinguishing between four work classes2). By the mid-1960s, it was evident that, asbestos was an earnest occupational and non- occupational health hazard that could cause lung cancer, asbestosis, and mesothelioma10). Previous studies have shown an increased incidence of lung cancer, or bronchogenic carcinoma, in groups of workers with moderate to heavy occupational exposure1, 11, 12). The use of asbestos in Iran began in the 1950s, and by the mid-1960s, it was being widely used in cement materials13). Iran imports nearly 55,000 tons of asbestos per year, and construction industry such as asbestos cement plants contribute nearly 95% of the total national usage6). The use of asbestos in Iran has not declined, and the current capita consumption level is 0.8 kg/per capita/year6, 13). Although there have been a few reports of airborne asbestos concentrations in the automobile brake, clutch, and asbestos cement manufacturing industries, there have been no reports of asbestos at exposure levels in demolition of older houses process. Given this lack of data on airborne asbestos exposure in the construction workers, an evaluation of workplace asbestos exposure is needed. These data will provide a guideline for the planning of a national program regarding banning the use of asbestos. The objectives of this study were to determine airborne asbestos fibers concentrations during demolition of older houses by PCM and SEM in a developing country; as well as to compare the elemental compositions of fiber emissions for determining airborne asbestos and non- asbestos types in the demolition sites.

Demolition in progress. (A) during demolition; (B) after demolition and before debris removal.
The four demolition sites were selected located within 2–5 km of each other into four regions of Tehran, the capital city of Iran: (1) the south (S), (2) east (E), (3) west (W), and (4) center (C). Tehran, the capital city of Iran and the regional center of Tehran province, has more than 7 million inhabitants and occupies a surface area of about 700 km2, 3). Selection criteria were as come after: demolition was conducted using typical practices on residential areas built before 1975 and likely to contain concrete framework with asbestos cement sheet and pipe on the year of construction. Site 1 was composed 4 separate houses on different street of the south. All 3 houses on the west side of the street and 1 house on the ends of the east side the street were demolished during 10−29 June 2010. Site 2 was collected of partial block demolitions carried out during 18 July till 3 Aug 2010 on a total of 3 houses into east region. Site 3 was consisting of 3 houses on the west region and were demolished during 23 Aug till 9 Sep 2010. All houses on the sites had been renovated in the early 1970s, except 3 houses on the east western portion of the region. Site 4 was collected of 3 houses on different block of a narrow 4-m wide ally street. Demolition of all 4 houses on the sites occurred in 21th May and 20th July 2011 into center reign. As we know the choice of choosing a demolition method depends the project conditions, site construction, sensitivity of the neighborhood and availability of equipment. Regarding to the sites situation that was small with congested space, demolition at each site was carried out by human operatives. In this case, human operatives are used in the demolition process using hand tools, simple electrically or pneumatically powered tools such as picks, hummer, wire cutting and welding cutters (Fig. 1). The number of workers per demolition practices were approximately 3–5 persons. The mean age of workers and mean employment period of workers were 28 yr and 7 yr, respectively. In general, top-down methods are used in the four sites, particularly for the situated in the busy urban areas. Demolition will generate huge amount of demolished materials. The safe and effective removal of construction remains such as airborne dust and asbestos fibers will be a prime concern in the operation. Whole-house demolition was typically done during the course 6 d. In the process, water was not sprayed during demolition and debris removal. The roll-off bins were removed from the site by truck. Demolished materials removal work took 1–2 weeks per site and involved the loading and removal of approximately 14 roll-off bines (there are 15m3 of debris for each roll-off bin) for each house demolished. At site 1, for example, approximately 80 roll-offs were loaded and removed.
Sampling and analysisPersonal air samples were collected from April 2010 till June 2011. Airborne asbestos was analyzed in 45 personal air samples, collected from 13 different houses dispersed in the 4 sites of Tehran. The samples were collected on mixed cellulose ester (MCE) filter membranes (Millipore type AA; 0.45 µm pore size; 25 mm diameter) using an open-face filter holder and cellulose support pad contained in a three piece cassette with a 50-mm conductive extension cowl. Sampling was performed at a flow rate of 2 l/min using a personal sampling pump (model number 224-PCMTX8; SKC-UK). The samplings were performed during the normal work periods 8:00−16.00. The duration of personal sampling for airborne asbestos was 240–360 min. Each of the air samples were examined using a PCM, and the results were confirmed with SEM. One-half of each analyzed filter was mounted on a glass slide (75 × 25 mm) and prepared, subsequently counted according to the National Institute for Occupational Safety and Health (NIOSH) method 740014). Fibers were counted by PCM at 400× magnification using a Walton-Beckett graticule (type G-22). The method measures airborne fibers with a length ≥5 µm and aspect ratio ≥3:1. Although the NIOSH method (7400) is relatively fast and inexpensive, it does not distinguish between asbestos and non-asbestos fibers, and also it cannot detect fibers thinner than 0.25 µm. The analytical sensitivity was approximately 0.01 f/ml of air sampled. Another portion of the filter was prepared and analyzed according to the SEM method detection limit 0.4 f/l, specified by the International Organization for Standardization15, 16). The another portion of the filter mounted on a suitable SEM sample and coated with gold in an appropriate gold evaporation vacuum coating unit. The SEM operation conditions should be adjusted to produce an image, when scanning at 2,000 × or greater magnification, of a 0.2 µm diameter chrysotile fiber16). Bulk samples were obtained in the demolition sites. Fiber type, chemical composition and optical properties of bulk samples were evaluated by SEM (model WEGA/TESCAN,Czech Republic) with energy-dispersive X-ray analysis (EDXA) and PLM, respectively. The PLM is used to examine the characteristic properties of the fiber, eg shape, birefringence and extinction, as discussed in NIOSH 900222).
Data analysisDescriptive statistics were used for PCM and SEM measurements of asbestos fiber concentrations using SPSS software for windows. The mean fiber concentrations are shown as geometric means. The fiber concentrations were determined by following formula: C = (E) × (Ac) / (V × 103)
Where C is the concentration of fibers (f/ml), E the density of fibers (fibers / mm2), Ac the effective filter area (approx. 385 mm2) and V is the air volume sampled (liter). The fiber concentrations of the airborne samples between areas were compared by one-way analysis of variance (ANOVA).
| Regions | No | SEM (f/ ml) | PCM (f/ ml) | |||||||
| GM | GSD | Min | Max | GM | GSD | Min | Max | |||
| South | 11 | 0.14 1 | 0.062 | 0.02 | 0.25 | 0.05 | 0.022 | 0.01 | 0.09 | |
| East | 12 | 0.13 2 | 0.145 | 0.05 | 0.42 | 0.04 | 0.051 | 0.02 | 0.15 | |
| West | 11 | 0.31 | 0.082 | 0.17 | 0.43 | 0.11 | 0.029 | 0.06 | 0.15 | |
| Centre | 11 | 0.20 3 | 0.065 | 0.08 | 0.34 | 0.07 | 0.023 | 0.03 | 0.12 | |
| Total | 45 | 0.20 | 0.111 | 0.02 | 0.36 | 0.07 | 0.039 | 0.01 | 0.15 | |
1p< 0.001, 2p<0.01, 3p=0.07, compared with the western area of Tehran. GM, geometric mean; GSD, geometric standard deviation; max, maximum; min, minimum; SD, standard deviation; SEM, scanning electronic microscopy; PCM, phase contrast microscopy.
| Site | No. | SEM (f/ ml) | PCM (f/ ml) | |||||||
| GM | GSD | Min | Max | GM | GSD | Min | Max | |||
| Ceiling | 29 | 0.25 | 0.096 | 0.05 | 0.42 | 0.08 | 0.034 | 0.02 | 0.15 | |
| Wall | 16 | 0.11 | 0.079 | 0.02 | 0.34 | 0.03 | 0.028 | 0.01 | 0.12 | |
| Total | 45 | 0.2 | 0.111 | 0.02 | 0.36 | 0.06 | 0.039 | 0.01 | 0.15 | |
GM, geometric mean; GSD, geometric standard deviation; max, maximum; min, minimum; SD, standard deviation; SEM, scanning electron microscopy; PCM, phase contrast microscopy.
The geometric means (GM) of airborne asbestos in the personal samples from four regions of Tehran are tabulated in Table 1. The highest and lowest GM (GSD) concentrations of asbestos 0.31 (0.082) SEM f/ml and 0.13 (0.145) SEM f/ml) were found in connection with the west and east region sites, respectively. The GM of asbestos concentrations were significantly higher in the west of Tehran than in the south and east of Tehran (p<0.001; p<0.01). However, there was no significant difference of asbestos concentrations between the west and the center region (p=0.07). Table 2 displays descriptive statistics on airborne asbestos fiber levels during roof and wall demolishing processes. The GM of the asbestos fiber concentrations were significantly higher in the roof demolition process compared to the other (p<0.001). All of the workers involved in demolition of old houses processes were exposed to airborne asbestos higher than the TLV proposed by ACGIH, which is 0.1 f/ml. Table 1 also shows that the GM values for SEM count were higher than those obtained by PCM (p<0.05).
Bulk samples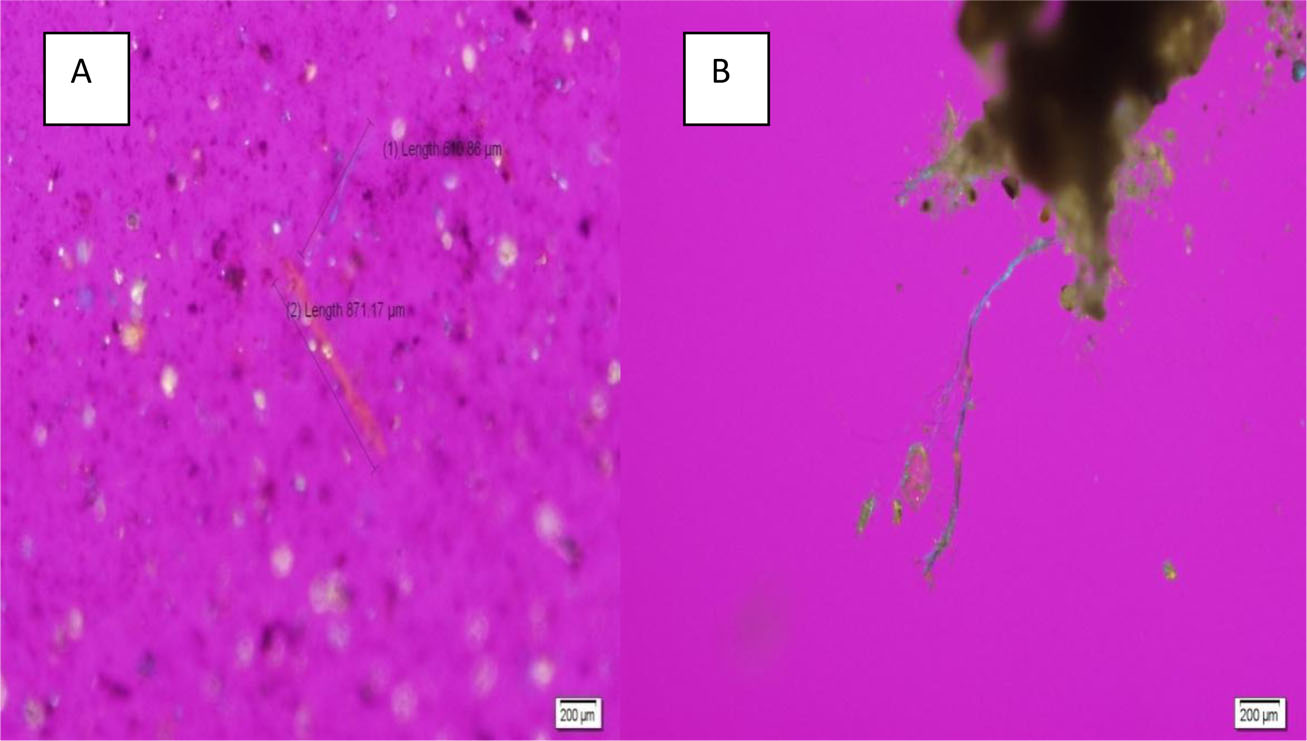
(A) PLM micrograph of airborne chrysotile fibers in the asbestos cement sheet sample to site demolition; (B) PLM micrograph of airborne chrysotile fibers in the ventilation ducts and chimney pipes sample to the site. Chrysotile fiber has a positive sign of elongation and will show yellow fibers oriented in the NW-SE direction, while they are blue in the NE-SE.
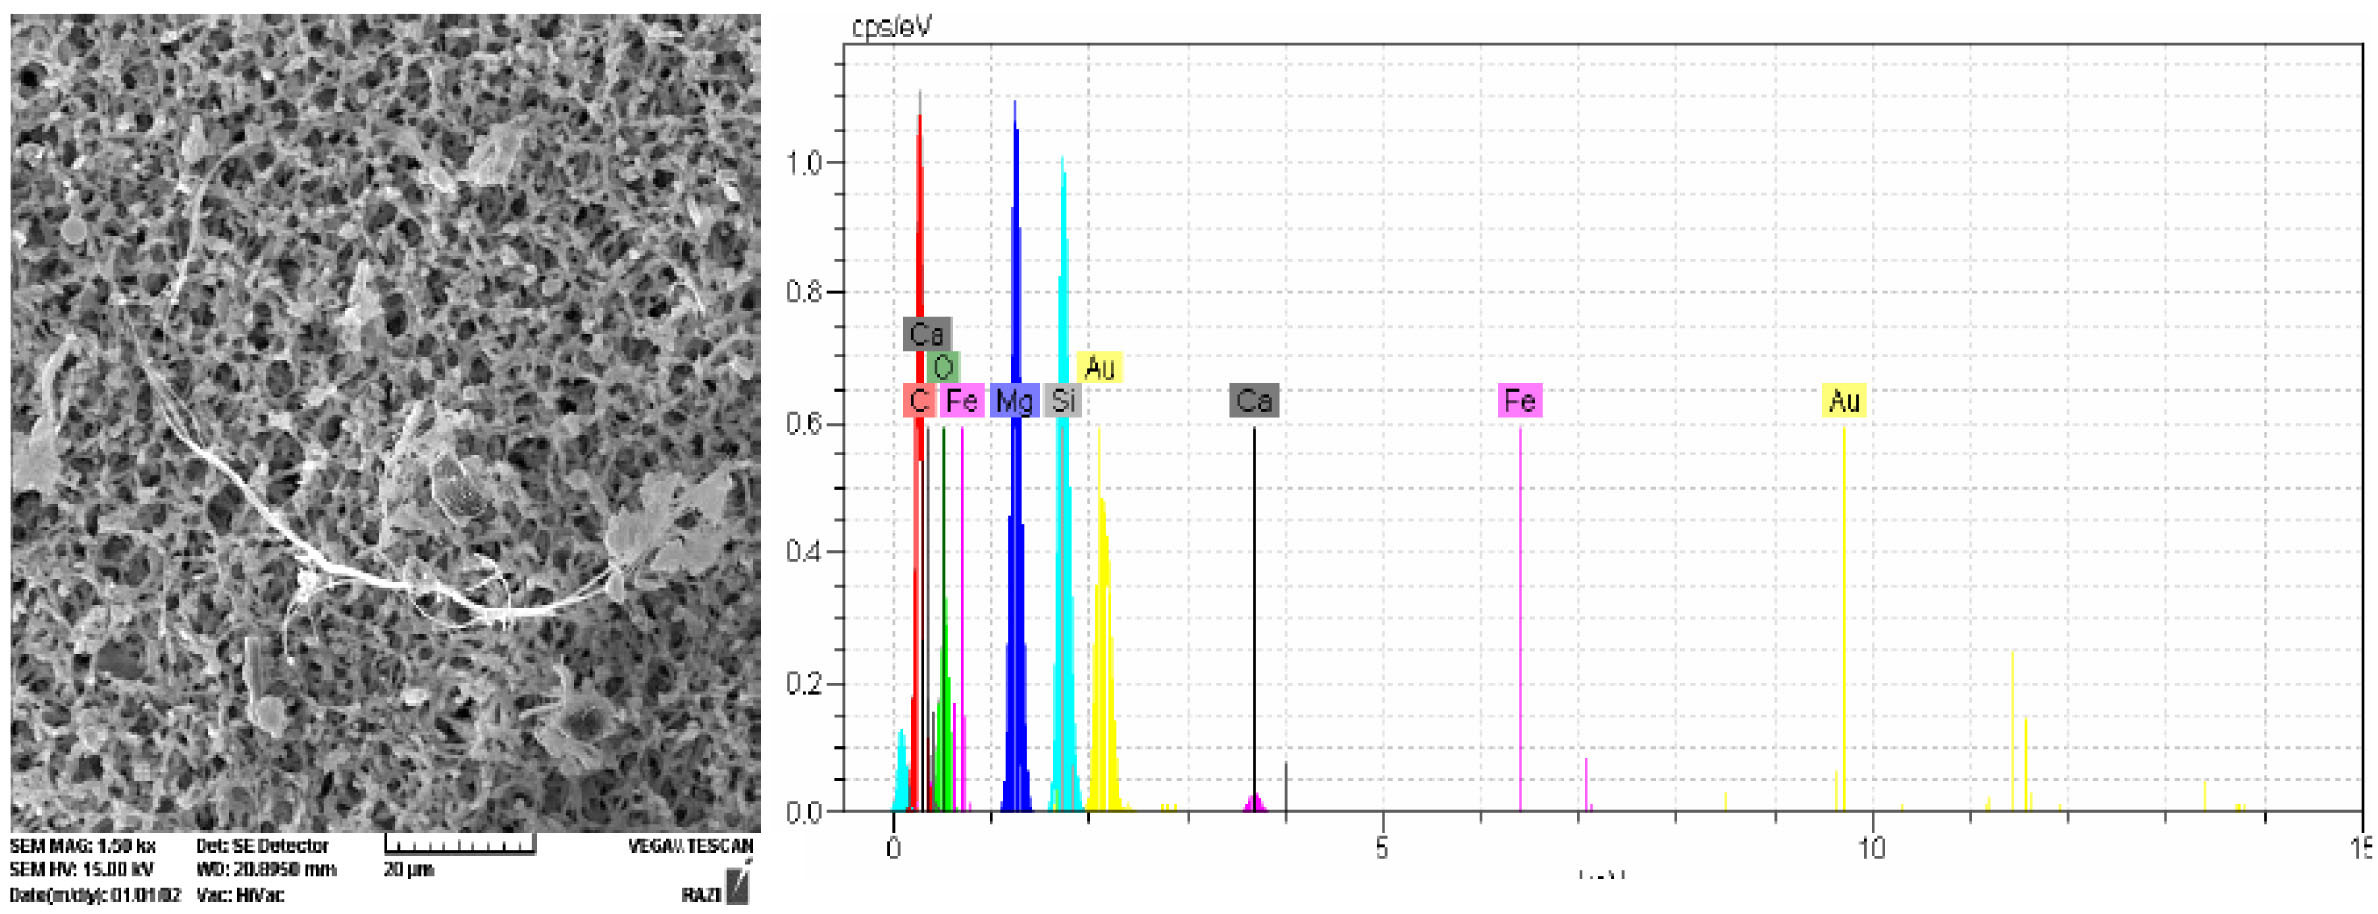
SEM image and EDS spectrum from sample of airborne particulate showing chrysotile fibers. Magnification, 1,500×.
To identify the presence of asbestos sources in the demolition sites, bulk samples from the cement sheet, thermal insulation, and chimney pipes were sampled from four demolition sites. The results would indicate that approximately all of the bulk samples were found to contain asbestos (Figs. 2, 3, 4, 5). All of the bulk materials such as cement sheet, chimney pipes, fire proofing and thermal insulation used in the old houses at the four sites were found to contain chrysotile asbestos. As seen in the photomicrographs of the chrysotile fibers in Figs. 2 and 5, the fibers have a positive sign of elongation. Figures 3 and 4 present images obtained using conventional SEM with a gold evaporation coating. The chemical composition of the fibers was analyzed using energy-dispersive spectrometry (EDS) analysis. The images reveal chrysotile fibers in dust and bulk samples. The SEM images and EDS spectrum collected from the airborne are shown in Fig. 3. As shown in Figs. 3 and 4, the SEM analysis and EDS spectrum of the air samples showed images and chemical content compatible with the chrysotile series with some evidence of magnesium (Mg), and silica (Si) content. EDX diagram of chrysotile (Fig. 3) shows the chemical analysis and the ratio of Mg/Si (1.29). According to the literature, all types of asbestos are hydrated magnesium silicates but the chrysotile contains approximately 30–40% each of magnesium (Mg) and silica (Si)13, 17). The morphology of fibers (width and length) are both important parameters in determining the carcinogenic potential of asbestos and non-asbestos materials23). According to previous reports, the risk of malignant mesothelioma is related to fiber concentration exceeding 1 million fiber per gram of dried tissue mineral fiber concentration in lung tissue and asbestos fibers dimensions (≥5 µm in length and ≤0.25 µm in diameter)23,24,25). It should be noted that the SEM data in Tables 1 and 2 are the concentrations calculated for fibers >5 µm in length and >0.2 µm in diameter.

SEM image and EDS spectrum from sample of asbestos cement sheet showing crysotile fibers (red arrows). Magnification, 2,000×.

(A) Fibers and large fiber with splayed end of raw chrysotile imaged in the SEM. The wavy appearance of the fibers are typical of chrysotile asbestos; (B) PLM micrograph of raw chrysotile in crossed polars with 550 retardation plate.
Chrysotile fiber have a positive sign of elongation and will show yellow fibers oriented in the NW-SE direction, while they are blue in the NE-SW.
In this study we illustrated whether demolition of older urban houses is related with increased asbestos levels in ambient air. By design, the sampling was conducted close to the demolition site to maximize the ability to detect changes in ambient asbestos levels. In the case of airborne dust, personal air sampling was carried out at the demolition sites. Demolition by human operatives or other methods were found to be associated with significant and acute increase in asbestos airborne dust surrounding the demolition sites. The increase in asbestos rate above the TLV levels was greater during roof demolition process than during walls demolition. Asbestos airborne trended to be the highest at sampling locations closest to the active work in the west region and emphasize the need for more effective dust suppression during demolition and debris removal. Regarding to this fact, we conclude that the geographical condition and traffic model are responsible for the high airborne asbestos levels in the west. It should be noted that these finding were associated with no wetting during demolition and debris (Fig. 1). This study confirms that demolition of old houses workers have a higher exposure to airborne asbestos in the demolition of roof processes as indicated by Brown18). These finding likely reflect a greater degree of disruption of asbestos based sheet and pipe present on interior and exterior surfaces of the demolished houses (Fig. 4). Other likely sources of asbestos in airborne dust during demolition are asbestos-containing dusts present on coating surfaces of the demolished houses, and settled street and sidewalk dust that might have become airborne fibers as a results of demolition activities. Brown (1987) reported that mean asbestos concentrations during renovation and demolition of asbestos-cement clad building were 0.3 to 0.6 f/ml for roofs and less than 0.1 f/ml for walls, which are higher than the amounts were found in this study. In the current study, the average concentration was 0.2 SEM f/ml (0.07 PCM f/ml), which is considerably lower than the levels of asbestos reported in some of the previous studies5, 18). It is interesting to note that, the SEM results were higher than the PCM results for all the personal samples. This is consistent with the finding of Weir and Meraz (2001) and Kakooei and Marioryad (2009) in which airborne asbestos levels were measured during occupational exposure assessment1, 19). Notably, fiber counting (especially chrysotile fiber counting) with the PCM method may underestimate ambient levels of asbestos6, 20, 21) . The results of bulk material analysis by SEM and PLM presented in Figs. 2, 3, 4, 5. The SEM images and spectrum asbestos were used for comparison with airborne fibers. As noted in Figs. 3 and 4, the airborne cyrysotile contains Mg and Si and Mg/Si ratio is 1.29. It is interesting to note that the anisotropic materials such as chrysotile and amphiboles asbestos have a different index of refraction in each of the main directions and have parallel extinction by PLM. As it has been illustrated in the Figs. 2 and 5, the Chrysotile fiber have a positive sign of elongation and will show yellow fibers oriented in the NW-SE direction, while they are blue in the NE-SW.
It is interesting to note that, the personal SEM results were higher that the personal PCM results for all air samples. This consisted with the finding of Kakooei and Marioryad (2010) in which airborne asbestos levels were measured during automobile brake industry. Due to some limitation of NIOSH 7400 method with regard to airborne fiber analysis, the use of SEM can be used to improve the techniques used presently. The results of the current study have highlighted that the personal SEM results were higher than the ACGIH TLV of 0.1 f/ml. Results of this study clearly provide that demolition needs to be conducted in a manner that minimized asbestos exposure for workers, residents and the environment. So that the process of redevelopment does not exacerbate existing risks of asbestosis or lung cancer. Meanwhile, to identify and implement improved work practices to minimize the dispersion of asbestos during demolition and debris removal and to limit public access to the demolition site are strongly recommended.
This study was financially supported by Tehran University of Medical Sciences (TUMS). The authors declare that there is no conflict of interests.