Abstract
We carried out underway geophysical survey in the transit of the JAMSTEC R/V Mirai MR08-06 Leg-1. The cruise was an unprecedented opportunity to collect data in regions of the Pacific Ocean where it has sparsely been surveyed. Our multibeam bathymetric and shipboard gravity survey track crossed over the Pacific, the Antarctic, and the Nazca plates, and covered lithospheric ages varying from zero to 150 Ma. The survey revealed kilometer-sized fine-scale structures of seafloor fabrics; i.e. abyssal hills and fracture zones, and distribution of seamounts or knolls. These are not detectable in satellite altimetry data only. As well as contributing to the world's seafloor mapping, our survey results also show valuable evidence towards the plate tectonic reconstruction and help us look into the oceanic lithosphere formation and evolution, since the directions of tectonic stress and seafloor spreading mode are the major factors that can affect the morphology of lineated abyssal hills, etc.
1. Introduction
Multibeam bathymetric data reveal seafloor fabrics, i.e. abyssal hills and fracture zones, distribution of seamounts and/or knolls, for us to discuss the formation and evolution of the oceanic lithosphere. The seafloor depths often indicate the structure of oceanic lithosphere, thermal state, and mantle dynamics. Shipboard gravity data, when combined with multibeam bathymetry, become more accurate set of data to estimate fine-scale crustal structures and subsurface mass distribution. The results can reveal features that are usually smaller than several kilometers in width, which could not be detected by global predicted bathymetry, or the conventional gravity data derived from satellite altimetry. In this paper, we report on one long survey line in the Pacific that crosses from the northeast Japan coast through to the equator at the mid-Pacific on to the southwest Chilean coast. Even if it is only one survey line, it shows several important features in the non-survey areas, especially at the southeastern Pacific area where the tectonics has not been well-defined.
The JAMSTEC R/V Mirai MR08-06 Leg-1 cruise was conducted in January - March 2009 as a part of SORA2009 (Cruise data and reports; Abe, 2009; Harada, 2009) for geological and geophysical studies in the southern Pacific (e.g. Suetsugu et al., 2012; Anma and Orihashi, 2013). We carried out underway geophysical survey in the transit. The MR08-06 Leg-1 cruise was an unprecedented opportunity to collect data in the regions of the Pacific Ocean where it has been sparsely surveyed using state-of-the-art echo-sounding technology. Here we present the character of our trackline geophysical data.
2. Data Acquisition
The MR08-06 Leg-1 cruise started on 15 January 2009, Sekinehama Japan, stopped by at Papete Tahiti during 3-6 February on the way to Valparaiso Chile, and the cruise ended on 14 March 2009 (Abe, 2009).
Swath bathymetric data were obtained using a SeaBeam 2112 multi-narrow beam echo sounder system with a 12 kHz frequency and a 2°×2° beam width. A swath width was set to 120°, covering an across-track width triple as wide as the water depth. Sound velocity profiles in the water column were calculated using measurements from XBT at 6 sites and XCTD at 8 sites (Figure 1(a)). The survey ship's speed during the survey was 14-15 kt. Marine gravity field was measured using a LaCoste and Romberg air-sea gravity meter S-116. Shipboard gravity data were tied to absolute gravity values at calibration stations in Sekinehama, Papete, and Valparaiso. The sensor drift rate was 0.056 mGal/day. Marine geomagnetic field was also measured using a three-component magnetometer permanently installed on the ship's deck. For results of the magnetic anomaly, refer to other papers (Kise et al., 2010; Matsumoto et al., 2013).

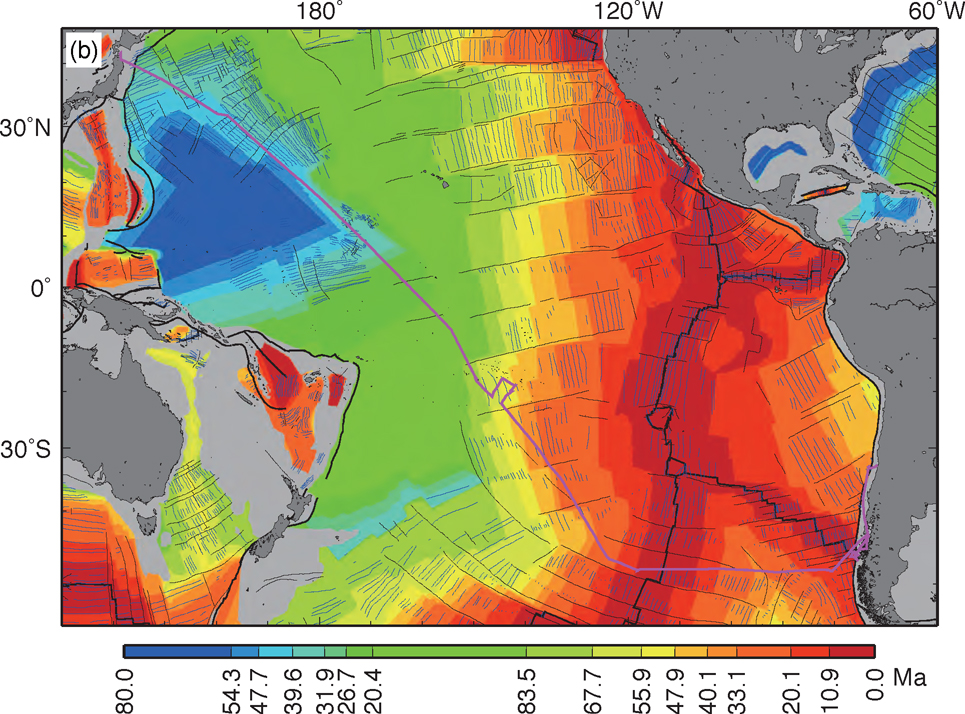
After the transit cruise, the ∼22000 km long trans-Pacific track, traveling halfway around the globe, was completed. The Pacific, the Antarctic, and the Nazca plates were crossed over, and lithospheric ages vary from zero to 150 Ma (Figure 1(b)).
3. Results and Discussion
3.1. Basement Depths
Along ship track profiles of observed bathymetry are shown in Figure 2. The bathymetry was corrected for isostatic effects due to sediment load. Sediment correction was calculated by using Schroeder's method (1984). The compiled data of sediment thickness were given by Divins (2003). Lithospheric age along the track was sampled from the digital data of Müller et al. (2008). Theoretical depth models, as a function of corresponding lithospheric age, are from Parsons and Sclater (1977) (PS), and Stein and Stein (1992) (GDH1).

As far as the mid-Pacific (∼170°W) from the Pacific Antarctic Ridge (PAR), the GDH1 model, based on a plate model with a plate thickness of 95 km, a bottom boundary temperature of 1450°C, is consistent with the observation (Figure 2(a)). However, the seafloor depth in the northwestern and old Pacific of the survey area (150°E∼170°E) is deep. The PS model (1350°C at the base of a 125-km-thick plate) is consistent with the observation in this area rather than the GDH1 model. Or long-wavelength free-air gravity anomaly, which indicates isostatic anomaly, shows negative values (Figure 2(b)). That suggests the lithosphere is dynamically depressed. Adam and Vidal (2010) proposed a relationship between depth and distance from a mid-ocean ridge along a mantle flowline of the Pacific Plate motion. The model fits this depth profile in the old Pacific and is generally applicable to the profile (Figure 2(a)). However the model predicts a depth somewhat shallower in the younger seafloor. Although more work is needed to evaluate the model, we may have to consider lithospheric cooling with age as well.
3.2. Seafloor Fabrics
Observed bathymetric swath and tectonic circumambient are shown in Figure 3, and detailed maps of the swath in some notable areas are shown in Figure 4. The bathymetry revealed fine-scale structure of seafloor fabrics; the sizes of the structure are smaller than several kilometers and had never been revealed in global predicted bathymetry like ETOPO1 (Amante and Eakins, 2009). The difference is the manifest in the sparsely surveyed southern Pacific Ocean (See Figures 4(e) and 4(f), Figures 4(h) and 4(i) for comparison). The seafloor fabrics mainly originate from a mid-ocean ridge system, where the oceanic lithosphere was formed. The lineated abyssal hills are the consequence of seafloor spreading and succeeding normal faulting. Transform faulting sculpts a fracture zone perpendicular to the abyssal hills. Consecutive trends of lineated abyssal hills and fracture zones indicate stable tectonic stress field originated from the PAR (Figures 3(f) and 4(g)) and the Chile Ridge spreading systems (Figures 3(h) and 4(l)). The ridge axis of the PAR located at 113°20′W is typical of a fast-spreading ridge axis and defined by rise topography over a broad cross section (Figures 2 and 4(g)). The seafloor fabric morphology revealed a clear boundary between the PAR and the Chile Ridge domains (Figures 3(g) and 4(h)). Crust formed at the PAR and at the Chile Ridge are separated there. Azimuths of the seafloor fabric change from 5°, which is sub-parallel to the PAR axis's strike, to 100° at 95°00′W. Previous studies predicted a trace of the Pacific-Antarctic-Farallon (Nazca) plates' triple junction (e.g. Tebbens et al., 1997). Probably the observed bathymetric boundary is a part of the trace. The result will be constraint for future studies of the plate reconstruction and tectonic evolution of the PAR, the Chile Ridge, and the Antarctic Plate.


Fluctuation of the seafloor fabric strikes suggests instability of tectonic stress fields (Figures 4(d) and 4(k)). Especially the strike of seafloor fabric varying from −40° to 50° (Figure 4(k)) may be largely influenced by the tectonic structure of offsets at fracture zones system separated by short ridge segments. The survey track lies near an intersection of the ridge segment and the Taitao fracture zone, and the offset length is shorter there (Figure 3(h)). At the fracture zone, the offset increases as the age decreases due to ridge jumps (Bourgois et al., 2000) or change in spreading rates (Matsumoto et al., 2013). This indicates the possibility of some dominant stress affecting spatially and/or temporally, from normal stress caused by seafloor spreading to shear stress caused by strike-slip throughout the evolution at the fracture zone. In contrast, abyssal hills elongated in the direction of −5° originated from the Chile Ridge system and fracture zones having long offset lengths distinctly bisect at right angles (Figure 4(l)). The regionality of the seafloor morphology on the Chile Ridge flank was found (Figures 4(k) and 4(l)). The Morphology of faulting may yield differences in seawater percolation into the crust and the uppermost mantle.
Non-transform offset or pseudo-faults formed by mid-ocean ridge's propagation may cause shear stress field, which may result in crustal deformation and curvilinear seafloor fabric (Figures 4(e) and 4(j)). The observed depression at 39°05'S shown in Figure 4(e) appears to be the Adventure Trough. The trough was presumed to be a pseudo-fault formed by a southward propagating rift (Cande and Haxby, 1991). Tectonics of the region shown in Figure 4(j) was unconstrained by previous studies (e.g. Tebbens et al., 1997). The found curvilinear seafloor fabric may become a clue to the tectonics.
The survey track passed through a suture zone formed at a paleo-ridge-triple-junction (e.g. Nakanishi et al., 1992) (Figure 3(a)). Azimuth angles of abyssal hills vary from 0° to 40°, NE-SW (Figure 4(a)). The area shown in Figure 4(a) is situated near east of the magnetic Magellan Lineation Set identified by Nakanishi et al. (1992) (Figure 3(a)). The lineation trends the NW-SE direction, and is thus different from that in the Figure 4(a) area. Such a short-range directional change may be due to complex tectonic evolution around the triple junction as suggested by Nakanishi and Winterer (1998).
Magnetic lineations are unconstrained on the seafloor in the Cretaceous magnetic quiet (125-80 Ma) zone (Figures 1(b), 3(b), and 3(c)). Thus, strikes of lineated abyssal hills give critical evidence for future studies of the plate reconstruction and tectonic evolution of the old Pacific Plate (Figures 4(b) and 4(c)). The azimuth of the fabric is found to be 0° although small volcanic knolls are overprinted on the lineated seafloor fabric of abyssal hills.
We also detected many small seamounts and knolls superimposed on the seafloor fabrics. These are considered to be constructed by excess magmatism at a mid-ocean ridge or intra-plate volcanism. The seamounts and knolls distributions are discussed in other papers (Hirano et al., 2013a, b). Our data will be a useful contribution for the global distribution of intra-plate volcanism that produces small knolls such as the petit-spot (e.g. Hirano et al., 2006).
Additional surveys may be needed for future in-depth studies, however our survey gives some valuable and suggestive evidence for the plate tectonic reconstruction and studies on formation and evolution of the oceanic lithosphere.
Acknowledgments
We express great thanks to the R/V Mirai's captain Masaharu Akamine and the crew for their excellent operations. The MR08-06 cruise was conducted with Co-Principal Dr. Naomi Harada within a half-year cruise project SORA2009 (South Pacific Ocean Research Activity 2009). We are grateful to the shipboard scientific party for collaboration at sea and in scientific discussions, and JAMSTEC data management office for help with data processing. We thank Prof. Masao Nakanishi and an anonymous reviewer for their helpful comments in improving the manuscript. The GMT software (Wessel and Smith, 1991; 1995) was extensively used in this study. Part of this work is a contribution of the research program at the IFREE, JAMSTEC, and the Grant-in-Aid for Scientific Research from the MEXT, Japan (No. 20340124).
References
- Abe, N. (ed.), (2009), MIRAI Cruise Report, MR08-06 Leg 1, Studies on geophysics and paleoceanography in the South Pacific, JAMSTEC, 180pp, <http://www.godac.jamstec.go.jp/catalog/data/doc_catalog/media/MR08-06_leg1_all.pdf>.
- Adam, C. and V. Vidal (2010), Mantle flow drives the subsidence of oceanic plates, Science, 328, 83-85.
- Amante, C. and B. W. Eakins (2009), ETOPO1 1 Arc-Minute Global Relief Model: Procedures, Data Sources and Analysis, National Geophysical Data Center, NOAA Technical Memorandum NESDIS NGDC-24, 19 pp, <http://www.ngdc.noaa.gov/mgg/global/global.html>.
- Anma, R. and Y. Orihashi (2013), Shallow-depth melt eduction due to ridge subduction: LA-ICPMS U-Pb igneous and detrital zircon ages from the Chile Triple Junction and the Taitao Peninsula, Chilean Patagonia, Geochem. J., 47, 149-165.
- Bourgois, J., C. Guivel, Y. Lagabrielle, T. Calmus, J. Boulègue, and V. Daux (2000), Glacial-interglacial trench supply variation, spreading-ridge subduction, and feedback controls on the Andean margin development at the Chile triple junction area (45-48°S), J. Geophys. Res., 105, 8355-8386.
- Cande, S. C., J. L. LaBrecque, R. L. Larson, W. C. Pitman III, X. Golovchenko, and W. F. Haxby (1989), Magnetic lineations of the world's ocean basins, map with text, Am. Assoc. Petrol. Geol.
- Cande, S. C. and W. F. Haxby (1991), Eocene propagating rifts in the southwest Pacific and their conjugate features on the Nazca Plate, J. Geophys. Res., 96, 19609-19622.
- Divins, D. L. (2003), Total Sediment Thickness of the World's Oceans and Marginal Seas, NOAA National Geophysical Data Center, Boulder, CO, <http://ngdc.noaa.gov/mgg/sedthick/sedthick.html>.
- Harada, N. (ed.), (2009), MIRAI Cruise Report, MR08-06 Legs. 2 and 3, Studies on geophysics and paleoceanography in the South Pacific: Evolution of climate changes and biogeochemical cycles in the Chilean continental marginal area, JAMSTEC, 176pp, <http://www.godac.jamstec.go.jp/catalog/data/doc_catalog/media/MR08-06_leg2-3_all.pdf>.
- Hirano, N., E. Takahashi, J. Yamamoto, N. Abe S. P. Ingle, I. Kaneoka, T. Hirata, J.-I. Kimura, T. Ishii, Y. Ogawa, S. Machida, and K. Suyehiro (2006), Volcanism in response to plate flexure. Science, 313, 1426-1428.
- Hirano, N., S. Machida, N. Abe, T. Morishita, A. Tamura, and S. Arai (2013a), Petit-spot lava fields off the central Chile trench induced by plate flexure. Geochem. J., 47, 249-257.
- Hirano, N., M. Nakanishi, N. Abe, and S. Machida (2013b), Exploring submarine lava fields in the French Polynesian region, Japan Geoscience Union Meeting 2013, SCG67-11.
- Kise, S., A. Doi, and T. Matsumoto (2010), Analysis of the 3D magnetic data on board R/V Mirai along the trans Pacific traverse, Japan Geoscience Union Meeting 2010, SCG086-P05.
- Matsumoto, T, A. Mori, S. Kise, and N. Abe (2013), Tectonics and mechanism of a spreading ridge subduction at the Chile Triple Junction based on new marine geophysical data, Geochem. J., 47, 137-147.
- Müller, R. D., M. Sdrolias, C. Gaina, and W. R. Roest (2008), Age, spreading rates and spreading symmetry of the world's ocean crust, Geochem. Geophys. Geosyst., 9, Q04006, doi:10.1029/2007GC001743.
- Nakanishi, M., K. Tamaki, and K. Kobayashi (1992), Magnetic anomaly lineations from Late Jurassic to Early Cretaceous in the west-central Pacific Ocean, Geophys. J. Int., 109, 701-719.
- Nakanishi, M. and E. L. Winterer (1998), Tectonic history of the Pacific-Farallon-Phoenix triple junction from Late Jurassic to Early Cretaceous: An abandoned Mesozoic spreading system in the Central Pacific Basin, J. Geophys. Res., 103, 12453-12468.
- Parsons, B. and J. G. Sclater (1977), An analysis of the variation of ocean floor bathymetry and heat flow with age, J. Geophys. Res., 82, 803-827.
- Schroeder, W. (1984), The empirical age-depth relation and depth anomalies in the Pacific ocean basin, J. Geophys. Res., 89, 9873-9883.
- Stein, C. A. and S. Stein (1992), A model for the global variation in oceanic depth and heat flow with lithospheric age, Nature, 359, 123-129.
- Suetsugu, D., H. Shiobara, H. Sugioka, A. Ito, T. Isse, T. Kasaya, N. Tada, K. Baba, N. Abe, Y. Hamano, P. Tarits, J.-P. Barriot, and D. Reymond (2012), TIARES Project-Tomographic investigation by seafloor array experiment for the Society hotspot, Earth Planets and Space, 64, i-iv.
- Tebbens, S. F., S. C. Cande, L. Kovacs, J. C. Parra, J. L. LaBrecque, and H. Vergara (1997), The Chile ridge: A tectonic framework, J. Geophys. Res., 102, 12035-12059.
- Wessel, P. and W. H.F. Smith (1991), Free software helps map and display data, EOS Trans. AGU, 72, 441.
- Wessel, P., and W. H. F. Smith (1995), New version of the Generic Mapping Tools released, EOS Trans. AGU, 76, 329.