Original Articles
植物による農薬の取り込みと土壌から水抽出される農薬との関係
2015 年 40 巻 4 号 p. 175-183

詳細
2015 年 40 巻 4 号 p. 175-183
The relationship between pesticide concentrations in Komatsuna (Brassica rapa var. perviridis) shoots and the extractable concentrations in soils by a sequential soil-extraction method was investigated in 8 pesticides and in 4 soils. Concentrations of many pesticides in Komatsuna shoots showed higher positive correlation with water-extractable than with total-extractable soil concentrations. We also examined the effects of the soil-aging periods (SAPs) between pesticide applications and sowing on pesticide concentrations in Komatsuna shoots. Pesticide concentrations in Komatsuna shoots and soil-water extracts decreased with increasing SAPs. These results imply that estimating the pesticide concentrations in crops based on water-extractable concentrations in soil and setting the appropriate SAPs prevent contamination of crops by pesticide residues in soil. However, the correlation between pesticide concentrations in Komatsuna shoots and water extracts in soils, and the effectiveness of pesticide reduction in Komatsuna shoots by setting long SAPs differed according to the pesticide type. Hence, the applicability of the water-extraction method should be verified for each pesticide.
In Japan, some agricultural chemicals were recently detected in crops that exceeded the uniform residue limit of 0.01 ppm set by the Japanese Positive List System.1) One reason for this is that succeeding crops take up from the soil residual pesticides applied to previous crops. Under the Japanese system of registering newly developed pesticides, the studies for pesticide residue in succeeding crops are required only if the half-lives of pesticides in the soil are longer than 100 days2); therefore, in many cases, residue studies for succeeding crops are not conducted. In contrast, in the United States, confined accumulation studies for rotational crops are required as a first tier evaluation for all pesticides except for those applied only on semi-permanent or permanent crops3); these results are available for setting appropriate plant-back intervals (PBIs), i.e., plant restriction intervals, which are included on the pesticide label.
Recent studies of crops contaminated by persistent organic pollutants (POPs), including dieldrin and heptachlor exo-epoxide, showed that application of carbonaceous adsorbents, such as activated carbon, to soils4–6) and a grafting technique using a low-uptake rootstock4,7) effectively decreased concentrations of POPs in cucurbit crops. However, the pesticides on the market are more degradable than POPs in soils. Therefore, estimating the residue concentrations in crops based on those in soils, followed by setting appropriate PBIs, is considered as one of realistic measures for preventing the production and circulation of contaminated crops because there is no cost for the materials. Understanding the dissipation behavior of pesticides in soils and the relationship between the residual levels of pesticides in soils and those in crops is necessary for setting appropriate PBIs.
Residual levels of pesticides in soils are generally determined by using a vigorous extraction technique of soils with an organic solvent, such as acetone. However, assuming that some pesticides sorbed to soil particles are eluted into soil water and, subsequently, taken up by plant roots, a vigorous extraction technique that extracts not only water-extractable pesticides but also soil-sorbed pesticides is inadequate for assessing the amount of phytoavailable pesticides in soils. In fact, Sugimura et al.8,9) found that the phytotoxicity of pendimethalin and metolachlor in upland soils increased with increasing the concentration of ingredients extracted from soils by distilled water. Although they did not provide the residual concentration of the ingredients in plants, their results imply that quantifying the amount of water-extractable pesticides in soils is important for predicting the amount of plant uptake from soils. The water extractability of pesticides in soils depends on soil sorption. It is generally known that the main sorptive medium of nonionic pesticides in soil is organic matter, i.e., neutral organic chemicals, including pesticides that sorb to soil organic matter via hydrophobic interactions.10) Furthermore, it has been reported that the sorption of a given pesticide shows high variability among Japanese soils because of andosol, the typical upland soil in Japan, which contains high organic carbon (OC) content.11) Therefore, the phytoavailability of pesticides in Japanese soils is also likely to differ considerably.
The objectives of this study are to investigate the variability of pesticide concentrations in Komatsuna (Brassica rapa var. perviridis), as a representative of crops, cultivated in four typical Japanese soils, to assess the relationships between pesticide concentrations in Komatsuna and water-extractable concentrations in soils, and to elucidate the effect of the soil-aging periods (SAPs) between applications of pesticides and sowing on residue concentrations in Komatsuna.
The eight pesticides used in this study (chemical purity >97.5%) were purchased from Wako Pure Chemical Industries, Ltd. (Osaka, Japan), Kanto Chemicals (Tokyo, Japan), and Dr. Ehrenstorfer GmbH (Augsburg, Germany) (Table 1). The pesticides were chosen based on their hydrophobicity, i.e., the range of their octanol-water partition coefficients (log Kow). To enable simultaneous analysis, the pesticides were divided into two analytical groups.
| Compound | IUPAC name | Substance group | log Kowa) | log Kowb) | log Kowc) | Analytical groupd) |
|---|---|---|---|---|---|---|
| Imidacloprid | (E)-1-(6-chloro-3-pyridylmethyl-N-nitroimidazolidin-2-ylideneamine | Neonicotinoid | 0.57 | 0.57 | 0.57 | A |
| Clothianidin | (E)-1-(2-chloro-1,3-thiazol-5-ylmethyl)-3-methyl-2-nitroguanidine | Neonicotinoid | 0.91 | 0.70 | 0.70 | A |
| Thiacloprid | (Z)-3-(6-chloro-3-pyridylmethyl)-1,3-thiazolidin-2-ylidenecyanamide | Neonicotinoid | 1.26 | 0.74 | 1.26 | A |
| Metalaxyl | Methyl N-(methoxyacetyl)-N-(2,6-xylyl)-DL-alaninate | Phenylamide | 1.65 | 1.75 | 1.75 | A |
| Fosthiazate | (RS)-S-sec-butyl O-ethyl 2-oxo-1,3-thiazolidin-3-ylphosphonothioate | Organophosphate | 1.68 | 1.68 | 1.68 | A |
| Flutolanil | α,α,α-trifluoro-3′-isopropoxy-o-toluanilide | Phenylbenzamide | 3.17 | 3.17 | 3.77 | B |
| Procymidone | N-(3,5-dichlorophenyl)-1,2-dimethylcyclopropane-1,2-dicarboximide | Dicarboximide | 3.30 | 3.14 | 3.30 | B |
| Tetraconazole | (RS)-2-(2,4-dichlorophenyl)-3-(1H-1,2,4-triazol-1-yl)propyl 1,1,2,2-tetrafluoroethyl ether | Triazole | 3.56 | 3.56 | 3.53 | B |
a) log Kow values were obtained from the Footprint Pesticide Properties Database of IUPAC.12) b) log Kow values were obtained from The Pesticide Manual (16th ed.).13) c) log Kow values were obtained from The 2011 Pesticide Handbook.14) d) Analytical methods are described in Supplemental Figs. S1–S3.
Four typical Japanese agricultural soils were selected to cover a wide range of OC contents (Table 2). Soil samples were air-dried, passed through a 2.0-mm sieve, and used in pot experiments. To evenly mix pesticides with soils, a mixture of Celite powder and pesticides was prepared.17,18) Approximately 1.5 L of acetone solution containing 80 mg of each pesticide was added to 400 g of Celite 545 (Wako Pure Chemical Industries, Ltd.), and the acetone was evaporated for 5 hr at room temperature in a draft chamber. The concentrations of pesticides in the Celite powder were quantified by acetone extraction; they ranged from 84 to 137 µg/g. Each air-dried soil sample (PS1, 630 g; PS2, 550 g; PS3, 450 g; PS4, 450 g), in the amount one hundred times greater than the amount of the Celite powder, was spread in a plastic bag; then Celite powder, 2 g of chemical fertilizer [0.16 g of N as (NH4)2SO4, 0.07 g of P as Ca(H2PO4)2·H2O, and 0.14 g of K as KCl], and 2 g of dolomite were evenly sprinkled onto the soils and mixed well. The theoretical concentrations (µg/g) of pesticides in air-dried soils were as follows: imidacloprid, 1.31; clothianidin, 1.33; thiacloprid, 1.37; metalaxyl, 1.24; fosthiazate, 1.33; flutolanil, 1.06; procymidone, 0.84; tetraconazole, 1.10.
| Soil | Classificationb) | Texturec) | OCd) (%) | CECe) (cmol(+)/kg) | Clay (%) | pH (H2O) | ECf) (mS/cm) |
|---|---|---|---|---|---|---|---|
| PS1 | Yellow soil | Light clay | 1.02 | 11.4 | 39.0 | 5.3 | 0.09 |
| PS2 | Gray lowland soil | Silty clay | 1.46 | 18.2 | 25.3 | 5.8 | 0.17 |
| PS3 | Andosol | Loam | 5.21 | 33.8 | 10.8 | 5.5 | 0.15 |
| PS4 | Andosol | Silty loam | 8.65 | 35.4 | 1.8 | 5.8 | 0.05 |
a) Data were obtained from our previous report.11) Soil samples PS1, PS2, PS3, and P4 correspond to Soils S3, S5, S7, and S8 in the previous report, respectively. b) According to the criteria adopted by the Cultivated Soil Classification Committee.15) c) According to the standards developed by the International Society of Soil Science.16) d) Organic carbon content.e) Cation exchange capacity. f) Electrical conductivity.
Plastic pots (600 mL) were filled with the soil samples. To improve the germination rate, approximately 5 g of perlite was sprinkled onto the soil surface and lightly mixed. Each pot was set in a plastic tray and placed in a climate chamber. The seeds of Komatsuna (B. rapa var. perviridis ‘Yokattana’) were sowed in each pot after 7 days for soils PS1 and PS4 and after 7, 35, and 63 days for soils PS2 and PS3. Thus, an SAP of 7 days was set for all soils as a base, and SAPs of 35 and 63 days were additionally set for soils PS2 (gray lowland soil) and PS3 (andosol). Komatsuna was chosen because it is a popular leafy vegetable in Japan, is easy to cultivate, and grows rapidly. The water content of the soils in the pots was adjusted by bottom-up irrigation to between approximately 50% and 70% of their water holding capacity (WHC), except for on sowing day (90% of WHC). The climate chamber was set to a cycle of 13 hr of light and 11 hr of darkness at 25°C, except during the first 7 days after the application of Celite to the soil and the period between sowing and germination (24 hr of darkness at 25°C). During the later growing period, i.e., the 18-day period until harvest, 50 mL of liquid fertilizer (at two-fold the strength of Otsuka Chemical A prescription [mg/L]: N, 520; P, 104; K, 672; Ca, 328; Mg, 72; Mn, 2.4; B, 1.0; Fe, 5.4; Cu, 0.06; Zn, 0.18; Mo, 0.06) was applied 10 times to each pot by bottom-up irrigation. Twenty-eight days after sowing, the shoots, including the leaves and stem, were harvested. The fresh weight (FW) of the shoots ranged from 59.7–87.8 g per pot. Pot experiments were performed in quadruplicate.
The shoot samples were frozen and finely ground using a Grindomix GM200 (Retsch GmbH, Haan, Germany). Ten grams of aliquot was soaked in 80 mL acetone for 30 min and homogenized using a Polytron® PT3100 (Kinematica AG, Lucerne, Switzerland) for 5 min. The solution was filtered through a 0.8-µm glass fiber filter and the volume was made up to 100 mL with acetone.
3. Soil dissipation experimentsSoil dissipation experiments were performed in triplicate under the same conditions as the plant uptake experiments except that planting of Komatsuna and application of perlite and additional liquid fertilizer were not carried out. Approximately 20 g of soil was taken from each pot at 7, 14, 21, and 35 days for soils PS1 and PS4, and at 7, 14, 21, 35, 63, and 91 days for soils PS2 and PS3 after Celite was applied to the soil. Each soil sample was divided into two subsamples: one was dried at 110°C to measure the moisture content, and the other was analyzed using a sequential extraction method.
4. Sequential extraction of soilsWater extraction of the soils was carried out in accordance with the standard batch sorption test method,19) although distilled water rather than a solution of calcium chloride was used as the aqueous solvent. Twenty-five milliliters of distilled water was added to approximately 5 g dry weight (DW) of soil in a 50-mL glass centrifuge tube. The tubes were agitated on a thermostat shaker (TAITEC, Saitama, Japan) for 24 hr at 25±2°C in the dark. After shaking, the mixtures were centrifuged at 1200×g for 30 min. Fifteen milliliters of supernatant was taken and used to quantify the water extracts. In addition, 30 mL of acetone was added to the remaining sample, the tubes were shaken in a thermostat shaker for 20 min at 25±2°C and centrifuged at 1200×g for 10 min, and the supernatant was carefully decanted. This extraction procedure was repeated twice. The collected supernatant was evaporated in a rotary evaporator to reduce the volume to approximately 10 mL and then used to quantify the acetone extracts.
The mass fraction of water-extractable pesticides in the soil, Cwater (µg/g DW), was calculated using the following equation:
 | (1) |
 | (2) |
The half-lives (τ1/2) of Cwater and Ctotal were calculated using the following equations18,20):
 | (3) |
 | (4) |
The mean Cwater or Ctotal values during the periods from t1 to t2 were calculated by integrating equation (3) from t1 to t2 and dividing the integration values by the periods (t1 to t2).18)
5. Pesticide analysisAcetone extracts from Komatsuna shoots were analyzed to quantify the pesticides using two different methods, as shown in Supplemental Figs. S1 and S2. For group A, 10 mL of aliquot was taken from each acetone extract and evaporated in a rotary evaporator; 10 mL of acetonitrile was then added to each concentrate. The mixtures were cleaned with an ENVI-Carb II/PSA column (500 mg/500 mg; Supelco, Bellefonte, USA). For group B, a 50-mL aliquot of each acetone extract was evaporated and cleaned with a diatomite column (InertSep K-solute 20 mL; GL Sciences, Tokyo, Japan) followed by an ENVI-Carb II/PSA column (500 mg/500 mg; Supelco).
The aliquots of water extracts and concentrates of acetone extracts from soils were also analyzed using two different methods,11) whereas group B was analyzed using the method applied for the analysis of Komatsuna shoots (Supplemental Fig. S2). The samples from group A were cleaned with a diatomite column (InertSep K-solute 20 mL; GL Sciences) followed by a PSA column (500 mg; Supelco) (Supplemental Fig. S3).
Cleaned samples were analyzed by liquid chromatography-tandem mass spectrometry (LC-MS/MS) for group A (Supplemental Tables S1 and S2) and gas chromatography-mass spectrometry (GC-MS) for group B (Supplemental Tables S3 and S4). In the case of the high matrix effects of purified samples, matrix-matched standards were used in LC-MS/MS and GC-MS.21)
Pesticide recovery tests were performed on pulverized samples of Komatsuna shoots, distilled water, and test soils. Komatsuna shoots (10 g) and distilled water (15 mL) spiked at 3 and 1 ng/g, respectively, for all groups of pesticides. However, each soil (5 g) spiked at 5 and 3 ng/g for group A and group B pesticides, respectively. Those samples were analyzed using the above-mentioned methods; however, 10 mL of distilled water was added to soil samples prior to acetone extraction. The mean recovery from five replicates for all compounds, except distilled water and soils for group A (four replicates), ranged from 73.3–113.0%; the coefficients of variation (CVs) were below 14.4% (Supplemental Tables S5–S7). The limits of quantification (LOQs) for pesticide analysis were calculated in accordance with Japanese Industrial Standard (JIS) K 0312.22) The LOQs for all compounds in Komatsuna shoots, distilled water, and all soil samples ranged from 0.94–2.09 ng/g, 0.16–1.29 ng/mL, and 0.57–3.16 ng/g, respectively (Supplemental Tables S5–S7).
6. Statistical analysisAll statistical analyses, including linear regression analysis and analysis of variance (ANOVA), were performed using SPSS Statistics 19 (IBM Corporation, Armonk, USA).
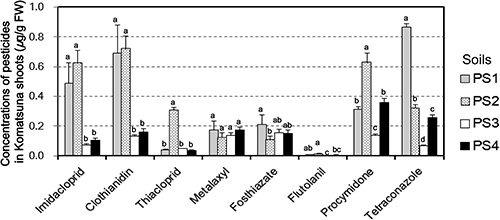
Fig. 1 shows the pesticide concentrations in Komatsuna shoots cultivated in four soils with a 7-day SAP. The residue concentrations in Komatsuna shoots for a given pesticide varied among test soils, and CVs of the concentrations for a given pesticide ranged from 17.6% for metalaxyl to 123.5% for thiacloprid. Pesticide concentrations in Komatsuna shoots given the residue concentration in soils were analyzed using linear regression analysis between pesticide concentrations in Komatsuna shoots cultivated in soils with a 7-day SAP and the mean Cwater or Ctotal values during the 28-day period until harvest, i.e., the period between sowing and harvest, in four soils (Table 3 and Supplemental Figs. S4 and S5). The regression lines were calculated using data containing the point (0, 0) because if the concentration in soil is zero, the concentration in Komatsuna shoot is also zero. Although the coefficient of determination (R2) values differed according to the type of pesticide, the concentrations of pesticides, except for metalaxyl and fosthiazate, in Komatsuna shoots were more strongly correlated with the Cwater than with the Ctotal.
| Compound | No. soils | R2 | |||||
|---|---|---|---|---|---|---|---|
| Water-extracts | Total-extracts | ||||||
| Mean conc. during 28-day until harvestc) | Conc. at sowing | Conc. at harvest | Mean conc. during 28-day until harvestc) | Conc. at sowing | Conc. at harvest | ||
| Imidacloprid | 4 | 0.733 | 0.740 | 0.662 | 0.332 | 0.330 | 0.412 |
| Clothianidin | 4 | 0.918* | 0.936** | 0.868* | 0.462 | 0.499 | 0.490 |
| Thiacloprid | 4 | 0.975** | 0.103 | 0.994** | 0.123 | 0.170 | 0.062 |
| Metalaxyl | 4 | 0.648 | 0.787* | 0.670 | 0.844* | 0.961** | 0.852 |
| Fosthiazate | 4 | 0.466 | 0.681 | 0.448 | 0.732 | 0.891* | 0.750 |
| Flutolanil | 4 | 0.566 | 0.691 | 0.481 | 0.543 | 0.511 | 0.511 |
| Procymidone | 4 | 0.714 | 0.492 | 0.918* | 0.489 | 0.551 | 0.359 |
| Tetraconazole | 4 | 0.976** | 0.985** | 0.967** | 0.334 | 0.328 | 0.289 |
* Significant at p<0.05; ** significant at p<0.01. a) Regression lines were calculated using data containing the point (0, 0), i.e., n=5. b) Soil-aging period (SAP) between application of pesticides and sowing. c) Mean values during the period between sowing and harvest.
This result suggests that pesticide concentrations in Komatsuna shoots were affected more by the Cwater than by the Ctotal, which implies that the water-extraction method of soil is more suitable than the total-extraction method for estimating residual concentrations in crops. On the other hand, for metalaxyl and fosthiazate, the R2 values were also high when using the Ctotal. The variability of metalaxyl and fosthiazate concentrations in Komatsuna shoots was especially low; the CVs of these pesticides were less than 30%. Therefore, for these two pesticides, the regression lines were calculated by a two-point data group, the point (0, 0) and the others (Supplemental Fig. S5). Focusing on imidacloprid, clothianidin, flutolanil, and tetraconazole, the mean Ctotal of four test soils showed almost the same values, whereas the mean Cwater values of two andosols (soils PS3 and PS4), which had relatively high OC content, tended to be lower than those of non-andosoils (Supplemental. Figs. S4 and S5). Therefore, one reason for the high variability of residue concentrations in Komatsuna shoots for a given pesticide is considered to be the difference of the sorption strength, depending on the OC content of each test soil. However, we must consider that soil sorption is influenced not only by the OC content but also by the OC quality. For example, the sorption of PS4, which had the highest OC content, was lower than that of PS3, due to the difference in the chemical composition of the OC.11)
To prevent the production and distribution of contaminated crops, pesticide concentrations in crops should be estimated before harvest with the appropriate technique. Table 3 shows a comparison of the R2 values between pesticide concentrations in Komatsuna shoots and the mean Cwater values during the 28-day period until harvest and the Cwater values at sowing or at harvest. The R2 for many pesticides showed almost the same values, even when any Cwater value was used. Hence, it is possible to estimate the residue concentrations in Komatsuna shoots by measuring the Cwater at sowing. However, thiacloprid and procymidone showed the lowest R2 values when using the Cwater values at sowing and the highest values when using the Cwater values at harvest. Such results might be explained by the difference in the dissipation of the Cwater of thiacloprid and procymidone during plant growth among test soils (Supplemental Tables S8–S11). The τ1/2 values in PS1, PS2, PS3, and PS4 were 4, 20, 40, and 11 days for thiacloprid, and 13, 52, 56, and 23 days for procymidone, respectively. The τ1/2 values differed depending on the soil type; τ1/2 was especially low in PS1 as compared with other soils. Among the test soils, the Cwater was highest in PS1 at sowing, indicating that the absolute decrease of Cwater in PS1 during plant growth was considerably higher than that in other soils. Thus, if a pesticide exhibits distinctly different dissipation of Cwater among soils during plant growth, the estimation of the residue concentrations in Komatsuna shoots using the Cwater values at sowing is inadequate, and prediction of the Cwater values at harvest is required. To predict the Cwater values at harvest, it is necessary to evaluate the dissipation behavior of Cwater. Many studies have investigated dissipation of Ctotal, including newly developed pesticides, whereas very few data for Cwater are available. The dissipation rate of Ctotal is different from Cwater, due to the longer τ1/2 of Ctotal as compared to that of Cwater as a whole (Supplemental Tables S8–S11). Therefore, estimating pesticide residue in crops using predicted values of Cwater at harvest requires further study of the dissipation behavior of Cwater with respect to target pesticides and field soils in which crops are planted.
The applicability of the water-extraction method using Cwater values at sowing differed with the type of pesticide; in some cases, to obtain more accurate levels of pesticides in Komatsuna shoots, the prediction of Cwater values at harvesting period was required. Therefore, the applicability of the method should be verified for each target pesticide based on the actual calibration curve.
On the other hand, when the data for all pesticides were plotted simultaneously, the correlation between the concentrations in Komatsuna shoots and the mean Cwater values during the 28-day period until harvest was poor (Fig. 2). Such a weak correlation may be caused by the difference in the translocation property of pesticides to shoots. Hence, the bioconcentration factor (BCFwater) was calculated by dividing the concentrations in Komatsuna shoots by the mean Cwater during the 28-day period until harvest (Fig. 3).

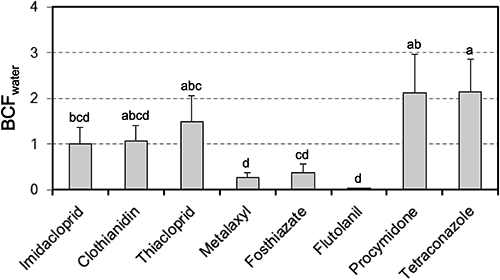
The mean BCFwater value for a given pesticide varied between 0.03 and 2.14; three pesticides—metalaxyl, fosthiazate, and flutolanil—showed low BCFwater values. In general, it has been postulated that translocation of organic chemicals to shoots is influenced by hydrophobicity. Briggs et al.23) found that the relationship between the transpiration stream concentration factor (TSCF), defined as the concentration of chemicals in the transpiration stream divided by the concentration in the external solution (i.e., hydroponic medium), and the log Kow could be represented by a bell-shaped curve with a maximum TSCF at a log Kow of 1.78, while Dettenmaier et al.24) reported a negative sigmoidal relationship between the TSCF and the log Kow. In the present study, however, the relationship between the BCFwater and the log Kow was quite different from either of the above. The BCFwater values did not take the transpiration volume into account. However, the transpiration volume could be ignored when the pesticides were compared because the tested pesticides were simultaneously applied to a pot. Therefore, the translocation property of pesticides to shoots was not the direct cause of the difference in the BCFwater. On the other hand, the concentration of pesticides in plants is also affected by the plants’ metabolism. For example, Fujisawa et al.25) improved the plant uptake models of nonionized pesticides using a metabolic parameter, i.e., the degradation rate constant in plants. Briggs et al.23) and Dettenmaier et al.24) studied the plant uptake of pesticides in hydroponic culture, and their experimental periods were 24–48 hr and 5–50 hr, respectively. In addition, the TSCF values of Briggs et al.23) were corrected for degradation of chemicals in plant shoots. On the other hand, the present experiment was carried out using soil during the 28-day period and the BCFwater values were not corrected for plant metabolism. Therefore, there is a possibility that the experimental conditions, such as the exposure period, the presence or absence of soil, and correction for the degradation of chemicals in a plant, affect the difference between the BCFwater and the TSCF previously reported. However, there are no available data on the metabolism of tested pesticides in Komatsuna, which are taken up by the roots. The reasons for the variability in BCFwater remain unexplained, warranting additional study. Therefore, at present, the water-extraction method for estimating the amount of pesticide residue in crops should not be applied across pesticides but only for a given pesticide.
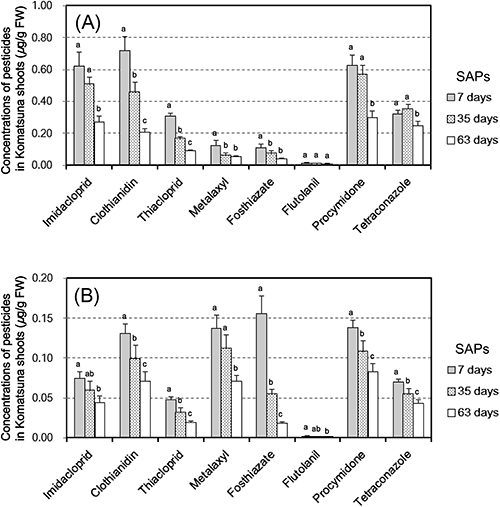
2. Influence of soil-aging periods (SAPs) on pesticide concentrations in Komatsuna shootsFig. 4 shows the relationships between pesticide concentrations in Komatsuna shoots and three different SAPs—7-day, 35-day, and 63-day—for PS2 and PS3. The residue concentrations in Komatsuna shoots decreased with increasing SAPs. The ratios of the residue concentrations in Komatsuna shoots cultivated in soils with a 63-day SAP as compared to those cultivated in soils with a 7-day SAP were 29–90% (mean=50%) and 12–69% (mean=51%) in PS2 and PS3, respectively. Thus, the ratios differed according to the type of soil and the pesticide. Focusing on the effect of the aging period on the residue concentrations in soils, the ratios of the Ctotal values at sowing with a 63-day SAP as compared to those at sowing with a 7-day SAP were 27–108% (mean=80%) and 37–119% (mean=90%) in PS2 and PS3, respectively. On the other hand, the ratios of the Cwater values at sowing with a 63-day SAP as compared to those at sowing with a 7-day SAP were 12–84% (mean=52%) and 17–69% (mean=43%) in PS2 and PS3, respectively. As mentioned above, the dissipation of Ctotal was slower than that of Cwater as a whole (Supplemental Tables S8–S11). Therefore, the reduction of Cwater in soils caused by soil aging was larger than that of Ctotal. Several studies reported that soil sorption of pesticides such as imidacloprid,26,27) nicosulfuron,28) and simazine29) increased during the aging period; thus, it is implied that the dissipation of Cwater is affected not only by general dissipation factors such as biodegradation, hydrolysis, and volatilization, but also by increasing soil sorption with increased aging time.
To verify the effectiveness of pesticide reduction in Komatsuna shoots by setting long SAPs for a given residue concentration in soils, we elucidated the correlation between pesticide concentrations in Komatsuna shoots cultivated in soils with three different SAPs and the extractable residue in PS2 and PS3 (Table 4 and Supplemental Figs. S6 and S7). Similar to the four test soils with a 7-day SAP (Table 3), the R2 values of the regression lines calculated using Cwater were higher than those using Ctotal, except for metalaxyl and fosthiazate. These results suggest that the water-extraction method of soil is more suitable for estimating pesticide concentrations in Komatsuna shoots cultivated in different soils with different SAPs than the total-extraction method. However, the R2 values of the regression lines and the effectiveness of pesticide reduction in Komatsuna shoots by setting long SAPs changed depending on the combination of pesticides and soils. To apply the water-extraction method to target pesticides, it is necessary to prepare actual calibration curves, i.e., regression lines, by using a target crop and field soils and to verify the applicability of the method based on the calibration curve.
| Compound | No. soils | R2 | |||||
|---|---|---|---|---|---|---|---|
| Water-extracts | Total-extracts | ||||||
| Mean conc. during 28-day until harvestc) | Conc. at sowing | Conc. at harvest | Mean conc. during 28-day until harvestc) | Conc. at sowing | Conc. at harvest | ||
| Imidacloprid | 2 | 0.922** | 0.938** | 0.882** | 0.172 | 0.151 | 0.212 |
| Clothianidin | 2 | 0.781** | 0.802** | 0.736* | 0.227 | 0.150 | 0.285 |
| Thiacloprid | 2 | 0.963** | 0.908** | 0.988** | 0.003 | 0.045 | 0.004 |
| Metalaxyl | 2 | 0.149 | 0.239 | 0.022 | 0.686* | 0.585* | 0.545 |
| Fosthiazate | 2 | 0.339 | 0.476 | 0.204 | 0.787** | 0.799** | 0.756* |
| Flutolanil | 2 | 0.936** | 0.807** | 0.988** | 0.306 | 0.293 | 0.260 |
| Procymidone | 2 | 0.964** | 0.868** | 0.956** | 0.207 | 0.270 | 0.120 |
| Tetraconazole | 2 | 0.931** | 0.726* | 0.977** | 0.379 | 0.371 | 0.343 |
* Significant at p<0.05; ** significant at p<0.01. a) Regression lines were calculated using data containing the point (0, 0), i.e., n=7. b) Soil-aging period (SAP) between application of pesticides and sowing. SAPs were set to 7 days, 35 days, and 63 days. c) Mean values during the period between sowing and harvest.
As discussed above, the dissipation of Cwater is considered to affect the pesticide concentrations in Komatsuna shoots. In the present study, dissipation studies of pesticides in soils were performed with pot experiments, in which the water content of soils was adjusted by bottom-up irrigation; thus, the dissipation of pesticides in the pots appeared slower than that in fields with leaching of pesticides after rainfall or irrigation.30) Therefore, the effectiveness of pesticide reduction in crops cultivated in pots by setting long SAPs may also be lower than that in fields. Hashimoto et al.4) reported that application of activated carbon to fields reduced dieldrin concentrations in cucumber fruits to 42–64% of those cultivated in non-treated fields. The effectiveness of dieldrin reduction in cucumber fruits by applying activated carbon roughly corresponds to the results obtained in the present study by setting long SAPs. Therefore, although the effectiveness of pesticide reduction differs depending on the type of pesticide and the soil, for pesticides that are available on the market, which show faster dissipation in soils than POPs, setting appropriate SAPs is suggested as one of practical measures to reduce pesticide concentrations in crops.
The water-extraction method of soils was more effective for estimating pesticide concentrations in crops cultivated in different soils with different SAPs than the total-extraction method. Furthermore, pesticide concentrations in Komatsuna shoots decreased by setting long SAPs. These results imply that estimating pesticide concentrations in crops based on the Cwater and setting appropriate SAPs prevent production and distribution of crops contaminated with pesticide residues from soils. However, the applicability of the water-extraction method and the effectiveness of pesticide reduction in crops by setting long SAPs differed, depending on the combination of pesticides and soils. Therefore, a calibration curve for a target pesticide should be individually prepared by using the crop of interest and the field soil in which the crop is planted; the applicability of the water-extraction method should be verified from the results. Furthermore, the dissipation studies of Cwater in actual fields are required to estimate the effectiveness of setting long SAPs for the reduction of pesticides in crops.
The authors thank Prof. H. Watanabe of Tokyo University of Agriculture and Technology for his helpful suggestions. The test soils were kindly supplied by Aichi Agricultural Research Center and Tochigi Prefectural Agricultural Experiment Station. This research was supported by the Environmental Research and Technology Development Fund (5-1302) of the Ministry of the Environment, Japan.