Abstract
Abstract: Salmonella enterica and coccidia
(Eimeria spp.) are important intestinal pathogens in
broiler production. Salmonella has high zoonotic potential, and
coccidia are responsible for large economic losses. Live vaccines reduce
shedding of Salmonella and minimize the impact of coccidial
infections on broiler performance. This study investigated the interaction
between both vaccines on the intestinal health of broilers. The 2 × 2
experimental design included vaccination against Salmonella
Typhimurium (ST) (no vaccination or vaccination on day 14) and vaccination
against coccidiosis (no vaccination or vaccination on day 1). On day 28, all
groups were challenged with a ST marker strain resistant to nalidixic acid.
Re-isolation of ST from the liver and ceca on day 42 indicated higher
susceptibility to systemic infection with ST in birds vaccinated against
coccidiosis than that in unvaccinated birds. On day 42, cecal immunoglobulin A
(IgA) levels against ST decreased in the group vaccinated against ST and
coccidia compared to those in all other groups. IgG antibodies in the cecal
contents significantly decreased in the group vaccinated against coccidiosis
compared to that of the group vaccinated against ST. There was no difference in
systemic IgG levels among groups. Analysis of the cecal microbiota revealed a
significant difference in beta diversity on days 28 and 42 between the groups
vaccinated against coccidiosis and unvaccinated groups. Functional pathway
profiling showed increased activity of pathways associated with carbohydrate and
arachidonic acid metabolism in the group vaccinated against ST compared to that
in other groups. Gene expression of claudin 1, claudin 4, E-cadherin, β-catenin,
and zonula occludens 2 in the cecal wall differed between the groups on days 28
and 42. These findings indicated the significant influence of ST and coccidiosis
vaccines on the intestinal health of broilers; however, further studies are
required to clarify the implications for health and performance.
Introduction
Salmonella is one of the most common pathogens that cause food-borne
diseases in humans[1]. In the U.S., more than
1.2 million human illnesses and 450 deaths are related to salmonellosis each year;
in Europe, 91,857 confirmed cases were reported in 2018[2,3]. Broiler meat is an
important vector of Salmonella infection, and
Salmonella Typhimurium (ST) is one of the most commonly
isolated serovars in the U.S. and Europe[2,4]. An important strategy to
control disease in humans and minimize the risk of meat contamination is vaccination
of chickens. Attenuated live and inactivated vaccines against ST are commercially
available[5].
Live vaccines are widely used in the broiler chicken industry. These vaccine strains
colonize the intestinal mucosa and stimulate a mucosal immune response[6,7]. This
is especially relevant for pathogens, such as Salmonella and
coccidia, which tend to remain in the intestinal tract[8,9]. In addition, live
vaccines are suitable for mass application, which is important for treating large
broiler flocks. In contrast, inactivated vaccines are administered to broiler
breeders and layers, often in combination with live vaccines, to induce a strong and
long-lasting antibody response that reduces egg and cecal colonization, shedding,
and transmission[6,10,11].
Coccidiosis is a gastrointestinal disease in young chickens that causes economic
losses in poultry production of up to $1,528 million in the U.S. alone[12]. Coccidia cause this damage by invading the
intestinal mucosa, replicating in the enterocytes, and thereby inducing epithelial
cell damage and inflammation[13,14]. Live vaccines against coccidiosis,
containing sporulated oocysts of Eimeria tenella, Eimeria
maxima, Eimeria acervulina, and other Eimeria spp.,
are frequently administered in the hatchery[15,16].
Previous studies have demonstrated multiple interactions between
Salmonella spp. and Eimeria spp. in chickens.
Co-infection with E. tenella or E. necatrix and ST
led to increased ST growth in the ceca of birds housed in cages[17,18,19,20]. When young chickens were infected with E.
tenella, cage contamination with ST resulted in a higher probability of
acute salmonellosis than that in controls that were not infected with E.
tenella[21]. Chickens in floor
pens infected with E. tenella, E. acervulina, or
E. maxima took longer to clear an ST infection than chickens
receiving anticoccidial medication. Additionally, coccidiosis predisposes chickens
to systemic salmonellosis[22,23]. In contrast, a field study found that
administration of live sporulated Eimeria oocysts in hatcheries
reduced Salmonella spp. prevalence throughout the production
cycle[24].
Since coccidiosis vaccines and live attenuated vaccines against ST may be
administered simultaneously in hatcheries, an interaction between the two vaccines
is likely; however, to our knowledge, this has never been investigated[11,25].
Therefore, this pilot study tested the effect of a coccidiosis vaccine on the
efficacy of ST vaccination and the effect of both vaccines on the intestinal health
of broilers, as defined by the complex interaction of local immunity, intestinal
microbiota, and intestinal wall integrity.
Materials and Methods
Experimental design
The animal study protocol was approved by the Auburn University Institutional
Animal Care and Use Committee (protocol 2019-3638).
One hundred and sixty unvaccinated and unsexed day-old broiler chicks were
obtained from a commercial hatchery and randomly placed in four floor pens. Each
pen measured 2.8 m2 and contained 40 birds. The experimental setup
consisted of four groups, each housed in one pen, with different treatments as
shown in Table 1. On the first day,
two groups (C and CST) were administered one dose of a coccidiosis vaccine
containing E. acervulina, E. maxima, and
E. tenella (Advent, Huvepharma, Peachtree City, GA, USA)
via oral gavage. The other two groups were not vaccinated against coccidiosis
(Control [Ctrl] and ST) and were administered 0.02% coccidiostat nicarbazin
(Phibro, Teaneck, NJ, USA) in the feed during the entire study to prevent
infection with coccidia. At 14 days of age, the CST and ST groups received one
dose of a commercial ST vaccine (Poulvac ST, Zoetis, Parsippany, NJ, USA) via
crop gavage. All birds were fed a standard broiler diet formulated to meet or
exceed the National Research Council recommended minimum nutrient requirements
for broilers[26] throughout the
experiment and had unlimited access to feed and water.
Table 1. Experimental design
|
Group1
|
Coccidiosis vaccine (day 1)2
|
ST vaccine(day 14)
|
| Ctrl |
No |
No |
| C |
Yes |
No |
| ST |
No |
Yes |
| CST |
Yes |
Yes |
1 Group names: Control (Ctrl), unvaccinated; C, vaccinated
only with coccidia on day 1; ST, vaccinated only with
Salmonella Typhimurium (ST) on day 14; CST,
vaccinated with both coccidia on day 1 and ST on day 14. All groups were
challenged with the ST marker strain on day 28.
2 Groups not vaccinated against coccidiosis (Ctrl and ST) were
fed a diet containing 0.02% nicarbazin throughout the entire study.
On day 28, 20 birds per group were randomly selected and euthanized, with 20
birds remaining in each pen. Euthanasia was performed using carbon dioxide
followed by cervical dislocation. The cecal wall, cecal content, and blood were
collected from 15 birds for the detection of antibodies, characterization of
cecal microbiota, and expression of selected genes in the intestinal wall. On
the same day, all remaining birds were challenged with 1 mL brain heart infusion
(BHI) broth containing 104 colony-forming units (cfu) of the ST
marker strain by oral gavage. On day 42, the birds were euthanized for sampling,
as described above. In addition, cecal tonsils and livers were collected for the
re-isolation of ST.
Preparation of ST inoculum
The ST marker strain used in this study was resistant to nalidixic acid. The
stock was stored in glycerol at −80°C. A sample of this stock was streaked out
on trypticase soy II agar with 5% sheep blood (BD Difco, Franklin Lakes, NJ,
USA) and incubated for 24 h at 37°C. BHI broth (BD Difco) was inoculated with
one typical colony and incubated overnight, shaking at 200 rpm at 37°C. Based on
the counts acquired from an overnight culture of one ST colony from a previous
study, the inoculum was diluted to approximately 104 (cfu/mL) to use
in the challenge[27]. To confirm the
strength of the inoculum, a ten-fold dilution series was plated on xylose lysine
tergitol-4 (XLT4) agar plates (Criterion, Hardy Diagnostics, Santa Maria, CA,
USA) containing 100 µg/mL nalidixic acid. Colonies were counted after incubation
for 24 h at 37°C.
Re-isolation of ST
On day 42 of the experiment, cecal tonsils and 1 g of the liver were sampled from
15 chickens per group. The organs were incubated in tetrathionate broth with 20
mL iodine solution/L (BD Difco) overnight at 37°C. The next day, samples were
streaked on XLT4 agar plates containing 100 µg/mL nalidixic acid. After an
incubation period of 24 h at 37°C, the plates were checked for the presence of
black colonies, indicative of Salmonella, using a qualitative
approach (presence/absence only).
Detection of ST antibodies in blood and cecal content
On both sampling days (day 28 and day 42), 1–1.5 mL blood was collected from 10
birds per group by puncture of the brachial wing vein. The tubes were maintained
at room temperature for 1 h and centrifuged at 3000 rpm (2143 × g) for 10 min.
The obtained serum was stored at −20°C.
Cecal content from 10 birds per group was diluted 1:2 with proteinase inhibitor
solution containing 0.15 M NaCl, 0.005 M
NaH2PO42H2O, 0.005 M
Na2HPO4, 0.02% sodium azide, 0.005 M
EDTA-Na2H2O, and 0.002 M phenylmethylsulfonyl fluoride
(Q-1395, Bachem AG, Bubendorf, Germany), and immediately stored on ice. The
tubes were centrifuged at 3000 rpm (2143 × g) for 10 min at 5°C. The supernatant
was harvested and stored at −20°C.
Serum and cecal anti-ST immunoglobulin G (IgG) levels were detected using an
indirect ELISA kit for Salmonella Enteritidis-Typhimurium
antibodies (BioChek, Kings Ride, Ascot, Berkshire, UK), following the
manufacturer’s instructions.
To optimize detection of IgA in cecal content, two checkerboard analyses were
performed to determine an optimal protocol. First, 1:10, 1:50, and 1:100
dilutions of cecal content, and 1:1000, 1:2000, and 1:5000 dilutions of alkaline
phosphatase- labeled rabbit anti-chicken IgA antibodies (Bio-Rad, Hercules, CA,
USA) as secondary antibodies were tested with one sample of the control group
(day 28) as a negative control and one sample of the control group after the ST
challenge (day 42) as a positive control. The second checkerboard analysis was
performed with the same sample dilutions, but used combinations of two
antibodies at different concentrations: a goat anti-chicken IgA antibody at
1:1000 and 1:2000 dilutions and an alkaline phosphatase- labeled rabbit
anti-goat IgG antibody (Bethyl Laboratories, Montgomery, TX, USA) at 1:5000 and
1:10 000 dilutions, to enhance the optical signal.
The largest difference between negative and positive samples was observed with a
sample dilution of 1:50 and an alkaline phosphatase-labeled goat anti-chicken
IgA dilution of 1:1000 (results not shown). Therefore, these dilutions were
selected to test all cecal samples for IgA antibodies.
Cecal microbiome analysis
On both sampling days (days 28 and 42), cecal content was collected from three
birds in each group. Following the manufacturer’s instructions, DNA was
extracted from 0.2 g cecal content using the QIAamp DNA Stool Mini Kit (Qiagen,
Hilden, Germany). Between 400 and 450 base pairs of bacterial 16S rDNA were
amplified by polymerase chain reaction (PCR) using a Taq PCR Master Mix Kit
(Qiagen). For the amplification, 2 µL template DNA, 10 pmol forward primer 515F
(5′-GTGCCAGCMGCCGCGGTAA-3′) with the linker sequence CS1 and 10 pmol reverse
primer 926R (5′-CCGYCYYTTYMTTTRAGTTT-3′) with the linker sequence CS2 were used
in a total volume of 25 µL[28,29]. The PCR conditions were as follows: an
initial denaturation step of 3 min at 94°C, followed by 28–40 cycles of
denaturation for 30 s at 94°C, annealing at 50°C for 30 s, extension at 72°C for
60 s, and a final elongation at 72°C for 10 min. PCR products were observed
using agarose gel electrophoresis, purified, and sent to the University of
Illinois, Chicago DNA Service Facility for targeted amplicon sequencing on an
Illumina MiSeq platform[30]. The
resulting demultiplexed paired-end reads were imported into qiime2 2023.2[31]. The Dada2 plugin was used to trim 19
nucleotides of the forward reads and 20 nucleotides of the reverse reads, based
on the given primer sequence lengths, and to truncate the sequences to a length
of 250 nucleotides[32]. The sequences
were denoised and amplicon sequence variants were obtained. The metadata sheet
was written on Google sheets, validated by Keemei[33], and imported into qiime2. The taxonomic composition of
the bacterial communities was assessed using a Naïve Bayes classifier trained on
99% full-length sequences sourced from the SILVA (version 138) ribosomal RNA
gene database project[34].
The data were imported into R using the qiime2R package version 0.99.6, and
subsequent analysis was conducted using the phyloseq package version 3.17 and
vegan package version 2.5-7[35,36,37]. All non-bacterial taxa were excluded from further analysis and
samples containing less than 5000 reads were removed from the dataset to ensure
data quality. Additionally, features with abundance below 0.01 were filtered out
to enhance the visualization of the relative abundance.
Pathway analysis was performed using picrust2 version 2.5.1[38]. The output was imported into R, and differential
analysis and visualization were conducted using ggpicrust2 1.7.0 and the Kyoto
Encyclopedia of Genes and Genomes (KEGG) database[39]. Raw reads were deposited into the NCBI Sequence Read
Archive (SRA) database under accession number PRJNA1011958.
Relative gene expression in the cecal wall
On days 28 and 42, a piece of the cecal wall, approximately 1 cm upstream of the
cecal apex, was collected from five broilers per group and stored in 1 mL RNA
stabilization solution (Qiagen). After 24 h at 4°C, the supernatant was
discarded and the samples were frozen at −80°C. RNA was extracted from 15 mg of
tissue using an RNeasy kit, according to the manufacturer’s instructions
(Qiagen). The procedure included DNA digestion using Qiagen RNase-Free DNase
(Qiagen). Based on the concentration of RNA determined by spectrophotometry
using a Nanodrop 1000 (Thermo Scientific, Waltham, MA, USA), the samples were
diluted with nuclease-free water to approximately 1 µg/µL RNA. Total RNA was
transcribed into cDNA using a LunaScript RT SuperMix Kit (New England Biolabs,
Ipswich, MA, USA). The thermal program consisted of 2 min at 25°C for primer
annealing, 10 min at 55°C for cDNA synthesis, and 1 min at 95°C for heat
inactivation.
Two technical replicates containing 2 µL cDNA of each sample were amplified by
quantitative PCR (qPCR) using the PerfeCta SYBR Green FastMix (QuantaBio,
Beverly, MA, USA) and primers for the genes of interest (claudin 1, 2, 4, 5;
zonula occludens 1, 2; E-cadherin; and β-catenin) and the reference genes
glyceraldehyde-3-phosphate dehydrogenase (GAPDH) and
hydroxymethylabilane synthase (HMBS) (Sigma-Aldrich, Darmstadt,
Germany). Detailed primer sequences are provided in Table 2. The cycling parameters for each gene were
standardized and included the following steps: an initial denaturation cycle at
95°C for 10 min, followed by 40 cycles of denaturation (30 s at 95°C), annealing
(1 min at 60°C), and extension (30 s at 72°C). PCR was performed using
qTower3G (Analytik Jena, Jena, Germany). To calculate primer
efficiency, a standard curve for each primer was performed using sample
dilutions of 1, 1:10, 1:100 and 1:1000, with two technical replicates each. The
slope was calculated using the slope function in Microsoft Excel based on the
average Ct value and log quantity range. The primer efficiency was calculated
using the formula:
Table 2. Primers used for quantitative polymerase chain reaction (qPCR) to
investigate relative gene expression
|
Target gene
|
Primer sequences (5′-3′)
|
PCR efficiency
|
Amplicon length (base pairs)
|
Reference
|
| Claudin 1
(CLDN1) |
F: CTG ATT GCT TCC AAC CAG
R:
CAG GTC AAA CAG AGG TAC AAG1 |
1.86 |
662 |
[40] |
| Claudin 2
(CLDN2) |
F: CCT CAG CCC TCC ATC AAA
R:
CTG CGT CTT CTC CTC TTA CTGT |
2.04 |
162 |
[41] |
| Claudin 4
(CLDN4) |
F: GAA GCG CTG AAC CGA TAC CA
R: TGC TTC TGT GCC TCA GTT TCC |
1.85 |
137 |
[42] |
| Claudin 5
(CLDN5) |
F: CAT CAC TTC TCC TTC GTC AGC
R: GCA CAA AGA TCT CCC AGG TC |
1.95 |
224 |
[40] |
| Zonula occludens 1
(ZO1) |
F: CTT CAG GTG TTT CTC TTC CTC CTC
R: CTG TGG TTT CAT GGC TGG ATC |
1.98 |
101 |
[43] |
| Zonula occludens 2
(ZO2) |
F: CGG CAG CTA TCA GAC CAC TC
R: CAC AGA CCA GCA AGC CTA CAG |
2.02 |
89 |
[44] |
| E-cadherin
(Ecad) |
F: TCA CGG GCA GAT TTC TAT
R:
CAC GGA GTT CGG AGT TTA |
1.92 |
109 |
[45] |
| β-catenin (Bcat) |
F: CTG TTC AGA ATG TCG GAG GA
R: CTG GGC ACC AAT GTC AAG |
1.95 |
|
[46] |
|
GAPDH
|
F: TGG AGA AAC CAG CCA AGT AT
R: GCA TCA AAG GTG GAG GAAT |
2.07 |
145 |
[46] |
|
HMBS
|
F: GAT GGA TCC GAT AGC CTG AA
R: GAT GTG CTT AGC TCC CTT GC |
2.01 |
195 |
[47] |
1 F = forward, R = reverse. GAPDH,
glyceraldehyde-3-phosphate dehydrogenase; HMBS,
hydroxymethylabilane synthase.
efficiency %=(-110slope-1) x 100.
Relative gene expression (RGE) was calculated using the Vandesompele method with
two reference genes (REF) and eight genes of interest (GOI) and considering
primer efficiencies (E) using the formula
|
R
G
E
=
(
E
G
O
I
)
∆
C
t
G
O
I
G
e
o
M
e
a
n
E
R
E
F
∆
C
t
R
E
F
|
[40,41].
Statistical analyses
All statistical tests were performed using R version 4.3.1[50] with a critical value of α = 0.05. Non-parametric methods
were used when the dataset did not meet the assumptions for parametric testing.
Re-isolation rates were compared between groups using the chi-square test and
logistic binomial regression, followed by pairwise comparison with Tukey’s
correction.
Statistical analysis of differences in the sample to positive (S/P) ratio of
immunoglobulins between groups was performed using the Kruskal–Wallis test and
Dunn’s post hoc test with Bonferroni adjustment.
For the evaluation of bacterial composition, the taxonomic levels tested were phylum,
family, and genus. The test groups were sorted by treatment, coccidia vaccination,
or ST vaccination. Alpha diversity was analyzed using Kruskal–Wallis and Dunn’s post
hoc tests with Bonferroni adjustment based on Shannon diversity, Simpson evenness,
and observed richness. Beta diversity was analyzed using permutational multivariate
analysis of variance (PERMANOVA) and pairwise PERMANOVA with Bonferroni adjustment,
based on Jaccard distance, Bray–Curtis distance, and weighted and unweighted UniFrac
distances. Analysis of compositions of microbiomes with bias correction was
performed using qiime2 to test for differential abundance[51].
Differential abundance analysis of functional pathways was performed using the
ANOVA-like differential expression (ALDEx) package ALDEx2 with the Kruskal–Wallis
test, Benjamini Hochberg adjustment, and a generalized linear model[39,52,53].
For statistical analysis of relative gene expression, the data were base 2 log
transformed, followed by Kruskal–Wallis and pairwise Wilcoxon rank sum tests with
Bonferroni adjustment for outliers and a skewed distribution.
Results
Re-isolation of ST
The ST challenge strain was re-isolated from five cecal tonsil samples from birds
in the unvaccinated control group but not from liver samples. In birds
vaccinated only against coccidia (group C), ST was re-isolated from two cecal
tonsils and three liver samples. In the group that was vaccinated only against
ST (group ST), one cecal tonsil sample was positive for ST, and no ST was
detected in the liver samples. In birds vaccinated against both pathogens (group
CST), two cecal tonsil samples and one liver sample were positive for ST. In
summary, the lowest number of ST-positive samples was observed in birds
vaccinated only against ST, and re-isolation of the ST challenge strain from the
liver was successful only in birds vaccinated against coccidia, with or without
ST vaccination. The control group showed active ST infection in the ceca, with
no systemic spread to other organs (Table
3). Counts between groups were not significantly different.
Table 3. Number of liver and cecal tonsil samples of 42-day-old broilers
from which a
Salmonella Typhimurium (ST) marker strain
was isolated
|
Group1
|
Cecal tonsils
|
Liver
|
| Ctrl |
5/152 |
0/15 |
| C |
2/15 |
3/15 |
| ST |
1/15 |
0/15 |
| CST |
2/15 |
1/15 |
1 Group names: Control (Ctrl), unvaccinated; C, vaccinated
only with coccidia on day 1; ST, vaccinated only with
Salmonella Typhimurium (ST) on day 14; CST,
vaccinated with both coccidia on day 1 and ST on day 14. All groups were
challenged with the ST marker strain on day 28.
2 Positive samples/Tested samples.
Anti-ST IgG antibodies were observed in both blood serum and cecal contents,
whereas IgA antibodies were observed only in the cecal content. Statistical
analysis revealed no significant differences in the IgG and IgA antibody
responses between the experimental groups on day 28. On day 42, 14 days after
challenge with ST, there were no differences in serum IgG antibodies between the
groups. IgA antibodies in the cecal contents were significantly lower in birds
vaccinated against coccidiosis and ST (group CST) than those in all other groups
(Table 4). Levels of IgG
antibodies in the cecal contents of birds vaccinated only against coccidiosis
(group C) were significantly lower than those in the group that received only
the ST vaccine (group ST).
Table 4. Detection of immunoglobulin A (IgA) and IgG in cecal content and
blood serum of 28-day-old and 42-day-old broilers (n = 10 per
group)
| Group1 |
Day 28 |
Day 42 |
| IgA in cecal content |
IgG in cecal content |
IgG in serum |
IgA in cecal content |
IgG in cecal content |
IgG in serum |
| Ctrl1 |
0.643
(0.391)2 |
0.024
(0.025) |
0.017
(0.008) |
0.500A
(0.270) |
0.021AB
(0.010) |
0.113
(0.073) |
| ST |
−0.0714
(0.416) |
−0.001
(0.002) |
0.013
(0.008) |
0.320A
(0.085) |
0.061A
(0.025) |
0.062
(0.031) |
| C |
−0.400
(0.213) |
0.012
+0.006) |
0.012
(0.004) |
0.360A
(0.181) |
0.027B
(0.024) |
0.118
(0.042) |
| CST |
−0.171
(0.308) |
0.060
(0.033) |
0.009
(0.005) |
−0.580B
(0.144) |
0.026AB
(0.011) |
−0.007
(0.022 |
1 Group names: Control (Ctrl), unvaccinated; C, vaccinated
only with coccidia on day 1; ST, vaccinated only with
Salmonella Typhimurium (ST) on day 14; CST,
vaccinated with both coccidia on day 1 and ST on days 14. All groups
were challenged with the ST marker strain on day 28.
2 Mean and standard error of sample to positive (S/P)
ratio.
Different superscripts indicate significant differences between groups
(P ≤ 0.05).
Before filtering, 677 taxa were detected in the 12 samples collected on day 28,
and 952 taxa in the 12 samples collected on day 42. Filtering based on the
bacterial kingdom resulted in the detection of 638 taxa on day 28 and 877 taxa
on day 42. Four samples from day 28 and one sample from day 42 had less than
5000 read counts and were excluded from the analysis (one Ctrl, two C, and one
ST on day 28, and one Ctrl on day 42).
Analysis of the relative abundance on day 28 revealed that the phylum Firmicutes
exhibited the highest relative abundance across all groups, followed by
Bacteroidota, Cyanobacteria, Proteobacteria, and Desulfobacterota (Fig.1A). Among families, the most
abundant were Clostridia_vadin_BB60 group,
Bacteroidaceae, Rikenellaceae,
Ruminococcaceae, and Oscillospiraceae
(Fig. 1B). The genera with the
highest abundances were Clostridia_vadinBB60_group,
Bacteroides, Alistipes,
Faecalibacterium, and Izemoplasmatales
(Fig. 1C). On day 42, the phyla
with the highest relative abundances were Firmicutes, Bacteroidota,
Proteobacteria, Desulfobacterota, and Actinobacteriota (Fig. 2A). The most abundant families were
Clostridia_vadin_BB60 group,
Rikenellaceae, Ruminococcaceae,
Bacteroidaceae, and Clostridia_UCG-014
(Fig. 2B). On day 42, the most
abundant genera were Clostridia_vadinBB60_group,
Alistipes, Bacteroides,
Faecalibacterium, and Clostridia_UCG_014
(Fig. 2C). No significant
differences in relative abundances were observed on either day of the
experiment.


Analysis of alpha diversity revealed no significant differences between the
groups on days 28 and 42 (Figs. 3
and 4). On day 28, beta diversity
analysis based on Bray–Curtis distance (P = 0.024) and Jaccard
distance (P = 0.023) showed significant differences when groups
vaccinated against coccidiosis were compared to those that were not vaccinated
(Fig. 5A). Beta diversity
differences between the groups vaccinated against coccidiosis and those with no
coccidia vaccination were also significant on day 42 (Bray–Curtis distance,
P = 0.025; Jaccard distance, P = 0.028)
(Fig. 5B). Vaccination against ST
did not significantly influence beta diversity on day 28 (P =
0.495) (Fig. 6A) or 42 (P
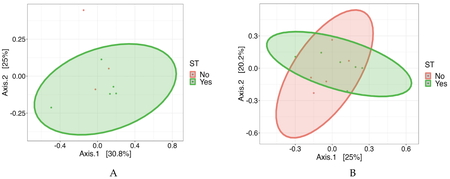
= 0.751) (Fig. 6B).


In the functional pathway analysis, significant differences were observed between
the treatment groups on day 28 (Fig.
7). Pathways associated with pentose and glucuronate interconversion
(class: carbohydrate metabolism metabolites, P = 0.025),
galactose metabolism (class: carbohydrate metabolism, P =
0.033), and arachidonic acid metabolism (class: lipid metabolism, P
= 0.033) differed among the treatment groups. The abundance of
these pathways was elevated in the group vaccinated against ST compared to that
in other groups. Analysis of data from day 42 did not reveal any significant
differences in functional pathways between the treatment groups.
Relative gene expression
On day 28, four of the eight tested genes showed significant differences in
expression (Fig. 8). Claudin 1 was
overexpressed in group C compared to that in the control group (P
= 0.042). Claudin 4 expression was higher in group C than in the
control group (P = 0.012), as well as groups ST (P
= 0.040) and CST (P < 0.001). E-cadherin was
overexpressed in group C compared to that in group ST (P =
0.040). β-catenin was overexpressed in group C than in group Ctrl (P
= 0.030). On day 42, 14 days after challenge with the ST marker
strain, significant changes in the expression of two out of eight tight
junction- related genes were observed (Fig.
8). Zonula occludens 2 was upregulated in group ST (P
= 0.012) and in group C compared to that in the control group
(P < 0.001). E-cadherin expression was significantly
lower in group C than that in group ST (P = 0.031).
Discussion
The objective of this study was to assess how the efficacy of an ST vaccine was
influenced by the administration of a coccidiosis vaccine and how the combination of
both vaccines influenced intestinal health parameters. In poultry production, both
vaccines are typically administered in the hatchery, with an ST booster administered
on day 14. This pilot experiment was conducted to obtain proof-of-concept that both
vaccines interacted with each other. For this reason, birds were vaccinated against
ST only on day 14 because it seemed more likely that the potential influence of the
coccidiosis vaccine on protection after ST vaccination would be more pronounced
after coccidia had time to replicate. The administration route for the vaccine
recommended by the manufacturer is via spray or drinking water[54]. However, oral gavage was selected as the route of
administration in this study to ensure that each chicken received exactly one dose
of the vaccine.
Previous studies have demonstrated a positive association between coccidiosis and
salmonellosis in chickens[17,18,55].
In the current study, ST was isolated from cecal tonsils in all groups. However, ST
was only detected in the livers of groups that received the coccidiosis vaccine.
Consistent with the previously mentioned studies, these results indicate that the
presence of coccidia infection enhances the establishment and systemic invasion of
ST.
The reasons for this finding are unknown. To better understand the specific mechanism
involved, the specific humoral immune response against Salmonella,
cecal microbiota composition, and the expression of cell-junction genes in the ceca
were investigated.
Given that ST primarily targets the intestinal tract, mucosal immunity, which is
characterized by an IgA-dominated antibody response, serves as the first line of
defense against microorganisms[56,57]. The current study revealed significantly
decreased mean S/P value of IgA on day 42 in birds vaccinated against both
coccidiosis and ST compared to those in all other groups. Additionally, there was a
significant decrease in IgG levels in the cecal content of the group vaccinated
against coccidiosis compared to that of the group vaccinated against ST. The reasons
for these differences in antibodies are unclear.
Systemic antibodies play critical roles in targeting extracellular
Salmonella[58]. Notably,
no significant differences were observed in IgG antibody levels between the groups
in either blood serum or cecal contents on day 42. This contrasts with the findings
of Baba et al.[18], who have
detected serum antibodies against S. Enteritidis (SE) only in birds
co-challenged with coccidia and SE, but not in birds challenged solely with SE. We
hypothesize that the vaccination before the challenge in the present study is the
cause of this difference.
Analysis of microbiota and pathway data has confirmed that imbalances in the
microbiota are associated with various disease states. The microbial composition on
days 28 and 42 revealed no significant differences in the relative abundance of taxa
or alpha diversity among treatment groups. Previous studies have also found no
effect of coccidiosis on alpha diversity[59].
Research on the impact of ST vaccines on intestinal microbiota has observed no
significant differences in relative abundance or alpha diversity compared to those
in control groups[60]. However, one study
reported elevated alpha diversity and significant differences in beta diversity in
groups vaccinated against ST compared to those in the control group[61].
Beta diversity analysis based on Bray–Curtis and Jaccard distances showed significant
differences between groups vaccinated with and without coccidiosis on days 28 and
42, indicating distinct microbial community structures in response to coccidiosis
vaccination. Supplementation with coccidiostats, such as nicarbazin, does not affect
microbiota composition in chickens or influence Salmonella invasion
or colonization[62,63].
Significant differences in the functional KEGG Orthology pathways were observed among
treatment groups on day 28. The pentose and glucuronate interconversions pathway
plays a crucial role in detoxification and metabolite excretion, potentially
contributing to reduced oxidative stress[64,65]. As a precursor to
proinflammatory mediators, arachidonic acid significantly influences inflammation,
while its metabolites are closely linked to oxidative stress, lipid metabolism, and
immune function[66,67,68]. The high
abundance of sequences associated with these metabolic pathways suggests increased
inflammation response in the chicken cecum, when chicken are vaccinated and
challenged with ST.
Overall, these findings highlighted the influence of both vaccinations on the cecal
microbial community and its metabolic activities.
One of the key components of the intestinal barrier is the formation of tight
junctions, adherens junctions, gap junctions, and desmosomes between epithelial
cells[69,70]. These junctions, which are multiprotein complexes, seal the
paracellular space between adjacent epithelial cells and regulate intestinal barrier
permeability[71,72]. Pathogen-induced damage to these junction complexes and
disruption of the intestinal barrier allow macromolecules, such as antigens,
bacterial toxins, and pathogens from the intestinal lumen, to cross into
circulation[73].
Our findings revealed changes in the expression of claudin 1 on day 28, claudin 4 on
days 28 and 42, and zonula occludens 2 on day 42. Claudins are primary transmembrane
proteins that contribute to tight junctions, while zonula occludens 1 serves as a
cytoplasmic plaque protein that interacts with both transmembrane and cytoskeletal
proteins[74,75]. Salmonella infection downregulates
claudin 1 gene expression in the ileum and jejunum of broiler chickens[76]. Similarly, ST infection reduces claudin 1
and claudin 4 expression in the jejunum of broiler chickens[77].
E-cadherin was differentially expressed on day 28. This gene is involved in growth
regulation and cell-cell adhesion in enterocytes, with increased levels observed in
proliferating cells[78]. β-catenin is
involved in a pathway responsible for intestinal cell growth[79]. Previous studies have shown elevated β-catenin levels
following Salmonella infection in chickens[78,80]. Overall, more
significant differences were observed between groups before the ST challenge (day
28), possibly because the effect of the ST challenge was greater than the subtle
differences between vaccination programs.
This pilot experiment indicated that coccidiosis vaccination interfered with the
efficacy of ST vaccination administered on day 14, although the results were not
significantly conclusive. Minor differences were also observed in the intestinal
antibody response, microbiota abundance, and expression of tight junction genes.
Larger-scale studies are required to fully investigate whether coccidiosis
vaccination influences the effectiveness of ST vaccination following the recommended
schedule on days 1 and 14.
Acknowledgements
This research was partially funded by the United States Department of
Agriculture-Agricultural Research Services (USDA-ARS, Project Number:
6040-32000-085-002-S) and the Alabama Agricultural Experiment Station.
Author Contributions
Conceptualization: Rüdiger Hauck, Kenneth Macklin, and Xu Wang; formal analysis,
Rüdiger Hauck, Andrea Pietruska; investigation, Rüdiger Hauck, Andrea Pietruska,
Teresa Dormitorio, James Krehling; data curation, Andrea Pietruska; writing—original
draft preparation, Andrea Pietruska; writing—review and editing, Andrea Pietruska,
Rüdiger Hauck; project administration, Rüdiger Hauck; funding acquisition, Rüdiger
Hauck, Kenneth Macklin and Xu Wang All authors have read and agreed to the published
version of the manuscript.
Conflicts of Interest
The authors declare no conflict of interest.
References
- [1] Voetsch AC, Van Gilder TJ, Angulo FJ,
Farley MM, Shallow S, Marcus R, Cieslak PR, Deneen VC andTauxe RV; Emerging
Infections Program FoodNet Working Group. FoodNet estimate of the burden of
illness caused by nontyphoidal Salmonella infections in the United States. Clin
Infect Dis, 38: S127–S134. 2004. PMID:15095181,
https://doi.org/10.1086/381578
- [2] European Food Safety Authority and
European Centre for Disease Prevention and Control (EFSA and ECDC). The European
Union One Health 2018 Zoonoses Report. EFSA J, 17: e05926. 2019. PMID:32626211,
https://doi.org/10.2903/j.efsa.2019.5926
- [3] Scallan E, Hoekstra RM, Angulo FJ, Tauxe
RV, Widdowson MA, Roy SL, Jones JL andGriffin PM. Foodborne illness acquired in
the United States--major pathogens. Emerg Infect Dis, 17: 7–15. 2011.
PMID:21192848, https://doi.org/10.3201/eid1701.P11101
- [4] Morningstar-Shaw BR, Mackie TA, Barker DK
andPalmer EA. Salmonella Serotypes Isolated from Animals and Related Sources.
Ames: United States Department of Agriculture (USDA), National Veterinary
Services Laboratories 2016, 4.
- [5] Gast RK andPorter RE. Salmonella
Infections. In: Diseases of Poultry (Swayne DE Eds.) Wiley: Ames, Iowa, 2020;
pp. 719–754 ISBN 978-0-470-95899-5.
- [6] Barrow PA. Salmonella infections: immune
and non-immune protection with vaccines. Avian Pathol, 36: 1–13. 2007.
PMID:17364505, https://doi.org/10.1080/03079450601113167
- [7] Huberman YD, Velilla AV andTerzolo HR.
Evaluation of different live Salmonella enteritidis vaccine schedules
administered during layer hen rearing to reduce excretion, organ colonization,
and egg contamination. Poult Sci, 98: 2422–2431. 2019. PMID:30690627,
https://doi.org/10.3382/ps/pez003
- [8] Arsenault RJ, Genovese KJ, He H, Wu H,
Neish AS andKogut MH. Wild-type and mutant AvrA−Salmonella induce broadly
similar immune pathways in the chicken ceca with key differences in signaling
intermediates and inflammation. Poult Sci, 95: 354–363. 2016. PMID:26574031,
https://doi.org/10.3382/ps/pev344
- [9] Miska KB, Campos PM, Cloft SE, Jenkins MC
andProszkowiec-Weglarz M. Temporal changes in jejunal and ileal microbiota of
broiler chickens with clinical coccidiosis (Eimeria maxima). Animals, 14: 2976.
2024. PMID:39457906, https://doi.org/10.3390/ani14202976
- [10] Berghaus RD, Thayer SG, Law BF, Mild RM,
Hofacre CL andSinger RS. Enumeration of Salmonella and Campylobacter spp. in
environmental farm samples and processing plant carcass rinses from commercial
broiler chicken flocks. Appl Environ Microbiol, 79: 4106–4114. 2013.
PMID:23624481, https://doi.org/10.1128/AEM.00836-13
- [11] Hofacre CL, Rosales AG, Costa MD, Cookson
K, Schaeffer J andJones MK. Immunity and protection provided by live modified
vaccines against paratyphoid Salmonella in poultry—an applied perspective. Avian
Dis, 65: 295–302. 2021. PMID:34412461,
https://doi.org/10.1637/aviandiseases-D-20-00126
- [12] Blake DP, Knox J, Dehaeck B, Huntington
B, Rathinam T, Ravipati V, Ayoade S, Gilbert W, Adebambo AO, Jatau ID, Raman M,
Parker D, Rushton J andTomley FM. Re-calculating the cost of coccidiosis in
chickens. Vet Res, 51: 115. 2020. PMID:32928271,
https://doi.org/10.1186/s13567-020-00837-2
- [13] Dalloul RA andLillehoj HS. Poultry
coccidiosis: recent advancements in control measures and vaccine development.
Expert Rev Vaccines, 5: 143–163. 2006. PMID:16451116,
https://doi.org/10.1586/14760584.5.1.143
- [14] Zhou B, Jia L, Wei S, Ding H, Yang J
andWang H. Effects of Eimeria tenella infection on the barrier damage and
microbiota diversity of chicken cecum. Poult Sci, 99: 1297–1305. 2020.
PMID:32111306, https://doi.org/10.1016/j.psj.2019.10.073
- [15] Albanese GA, Tensa LR, Aston EJ, Hilt DA
andJordan BJ. Evaluation of a coccidia vaccine using spray and gel applications.
Poult Sci, 97: 1544–1553. 2018. PMID:29462420,
https://doi.org/10.3382/ps/pey011
- [16]Hauck R andR and Macklin KS.
Vaccination Against Poultry Parasites. Avian Dis, 67: 441–449.
2023.
- [17] Arakawa A, Baba E andFukata T. Eimeria
tenella infection enhances Salmonella typhimurium infection in chickens. Poult
Sci, 60: 2203–2209. 1981. PMID:7329903,
https://doi.org/10.3382/ps.0602203
- [18] Baba E, Furata T andArakawa A.
Establishment and persistence of Salmonella typhimurium infection stimulated by
Eimeria tenella in chickens. Res Vet Sci, 33: 95–98. 1982. PMID:6753076,
https://doi.org/10.1016/S0034-5288(18)32366-X
- [19] Hikasa Y, Baba E, Fukata T andArakawa A.
The invasion of salmonella typhimurium into the cecal wall of chickens infected
with Eimeria tenella. Zentralbl Bakteriol Mikrobiol Hyg A, 253: 344–354.
1982.
- [20]Stephens JF and Vestal . Effects of
intestinal coccidiosis upon the course of Salmonella typhimurium infection in
chicks. Poultry Sci. 39: 459–467. 1965.
- [21] Kosugi Y, Baba E, Fukata T andArakawa A.
Effects of cage contamination with coccidia and salmonella on acute
salmonellosis in young chickens. Avian Dis, 30: 313–318. 1986. PMID:3524544,
https://doi.org/10.2307/1590534
- [22] Arakawa A, Fukata T, Baba E, McDougald
LR, Bailey JS andBlankenship LC. Influence of coccidiosis on Salmonella
colonization in broiler chickens under floor-pen conditions. Poult Sci, 71:
59–63. 1992. PMID:1539023, https://doi.org/10.3382/ps.0710059
- [23] Takimoto H, Baba E, Fukata T andArakawa
A. Effects of infection of Eimeria tenella,E. acervulina, and E. maxima upon
Salmonella typhimurium infection in chickens. Poult Sci, 63: 478–484. 1984.
PMID:6371754, https://doi.org/10.3382/ps.0630478
- [24] Volkova VV, Wills RW, Hubbard SA, Magee
D, Byrd JA andBailey RH. Associations between vaccinations against protozoal and
viral infections and Salmonella in broiler flocks. Epidemiol Infect, 139:
206–215. 2011. PMID:20426884,
https://doi.org/10.1017/S0950268810000804
- [25] Lillehoj EP, Yun CH andLillehoj HS.
Vaccines against the avian enteropathogens Eimeria, Cryptosporidium and
Salmonella. Anim Health Res Rev, 1: 47–65. 2000. PMID:11706844,
https://doi.org/10.1017/S1466252300000050
- [26] NRC. Nutrient Requirements of Poultry: Ninth
Revised Edition, 1994; 1AD; ISBN 978-0-309-04892-7.
- [27] Williams ZT andMacklin KS. Reduction of
Salmonella and ammonia emissions in broiler litter using sulfuric acid and
aluminum sulfate. Int J Poult Sci, 12: 328–334. 2013.
https://doi.org/10.3923/ijps.2013.328.334
- [28] Caporaso JG, Lauber CL, Walters WA,
Berg-Lyons D, Lozupone CA, Turnbaugh PJ, Fierer N andKnight R. Global patterns
of 16S rRNA diversity at a depth of millions of sequences per sample. Proc Natl
Acad Sci USA, 108: 4516–4522. 2011. PMID:20534432,
https://doi.org/10.1073/pnas.1000080107
- [29] Walters W, Hyde ER, Berg-Lyons D,
Ackermann G, Humphrey G, Parada A, Gilbert JA, Jansson JK, Caporaso JG, Fuhrman
JA, Apprill A andKnight R. Improved bacterial 16S rRNA gene (V4 and V4-5) and
fungal internal transcribed spacer marker gene primers for microbial community
surveys. mSystems, 1: e00009-15. 2016. PMID:27822518,
https://doi.org/10.1128/mSystems.00009-15
- [30] Bustin SA, Benes V, Garson JA, Hellemans
J, Huggett J, Kubista M, Mueller R, Nolan T, Pfaffl MW, Shipley GL, Vandesompele
J andWittwer CT. The MIQE guidelines: minimum information for publication of
quantitative real-time PCR experiments. Clin Chem, 55: 611–622. 2009.
PMID:19246619, https://doi.org/10.1373/clinchem.2008.112797
- [31] Bolyen E, Rideout JR, Dillon MR, Bokulich
NA, Abnet CC, Al-Ghalith GA, Alexander H, Alm EJ, Arumugam M, Asnicar F, Bai Y,
Bisanz JE, Bittinger K, Brejnrod A, Brislawn CJ, Brown CT, Callahan BJ,
Caraballo-Rodríguez AM, Chase J, Cope EK, Da Silva R, Diener C, Dorrestein PC,
Douglas GM, Durall DM, Duvallet C, Edwardson CF, Ernst M, Estaki M, Fouquier J,
Gauglitz JM, Gibbons SM, Gibson DL, Gonzalez A, Gorlick K, Guo J, Hillmann B,
Holmes S, Holste H, Huttenhower C, Huttley GA, Janssen S, Jarmusch AK, Jiang L,
Kaehler BD, Kang KB, Keefe CR, Keim P, Kelley ST, Knights D, Koester I,
Kosciolek T, Kreps J, Langille MGI, Lee J, Ley R, Liu YX, Loftfield E, Lozupone
C, Maher M, Marotz C, Martin BD, McDonald D, McIver LJ, Melnik AV, Metcalf JL,
Morgan SC, Morton JT, Naimey AT, Navas-Molina JA, Nothias LF, Orchanian SB,
Pearson T, Peoples SL, Petras D, Preuss ML, Pruesse E, Rasmussen LB, Rivers A,
Robeson MS, II, Rosenthal P, Segata N, Shaffer M, Shiffer A, Sinha R, Song SJ,
Spear JR, Swafford AD, Thompson LR, Torres PJ, Trinh P, Tripathi A, Turnbaugh
PJ, Ul-Hasan S, van der Hooft JJJ, Vargas F, Vázquez-Baeza Y, Vogtmann E, von
Hippel M, Walters W, Wan Y, Wang M, Warren J, Weber KC, Williamson CHD, Willis
AD, Xu ZZ, Zaneveld JR, Zhang Y, Zhu Q, Knight R andCaporaso JG. Reproducible,
interactive, scalable and extensible microbiome data science using QIIME 2. Nat
Biotechnol, 37: 852–857. 2019. PMID:31341288,
https://doi.org/10.1038/s41587-019-0209-9
- [32] Callahan BJ, McMurdie PJ, Rosen MJ, Han
AW, Johnson AJA andHolmes SP. DADA2: high-resolution sample inference from
Illumina amplicon data. Nat Methods, 13: 581–583. 2016. PMID:27214047,
https://doi.org/10.1038/nmeth.3869
- [33] Rideout JR, Chase JH, Bolyen E, Ackermann
G, González A, Knight R andCaporaso JG. Keemei: Cloud-based validation of
tabular bioinformatics file formats in Google Sheets. Giga Science, 5:
s13742-016-0133-6. 2016.
https://doi.org/10.1186/s13742-016-0133-6
- [34] Quast C, Pruesse E, Yilmaz P, Gerken J,
Schweer T, Yarza P, Peplies J andGlöckner FO. The SILVA ribosomal RNA gene
database project: improved data processing and web-based tools. Nucleic Acids
Res, 41: D590–D596. 2012. PMID:23193283,
https://doi.org/10.1093/nar/gks1219
- [35] Bisanz JE. qiime2R: Importing QIIME2
Artifacts and Associated Data into R Sessions 2018.
- [36] McMurdie PJ andHolmes S. phyloseq: an R
package for reproducible interactive analysis and graphics of microbiome census
data. PLoS One, 8: e61217. 2013. PMID:23630581,
https://doi.org/10.1371/journal.pone.0061217
- [37]Oksanen J. Vegan: Ecological
Diversity. 2022. https://doi.org/10.32614/CRAN.package.vegan
- [38] Douglas GM, Maffei VJ, Zaneveld JR,
Yurgel SN, Brown JR, Taylor CM, Huttenhower C andLangille MGI. PICRUSt2 for
prediction of metagenome functions. Nat Biotechnol, 38: 685–688. 2020.
PMID:32483366, https://doi.org/10.1038/s41587-020-0548-6
- [39]Yang C,C, Mai J, J, Cao X, X,
Burberry A,A, Cominelli F and F and Zhang L. Ggpicrust2: An R package for
PICRUSt2 predicted functional profile analysis and visualization.
Bioinformatics, 39: btad470. 2023.
https://doi.org/10.1093/bioinformatics/btad470
- [40] Derveaux S, Vandesompele J andHellemans
J. How to do successful gene expression analysis using real-time PCR. Methods,
50: 227–230. 2010. PMID:19969088,
https://doi.org/10.1016/j.ymeth.2009.11.001
- [41] Mestdagh P, Van Vlierberghe P, De Weer A,
Muth D, Westermann F, Speleman F andVandesompele J. A novel and universal method
for microRNA RT-qPCR data normalization. Genome Biol, 10: R64. 2009.
PMID:19531210, https://doi.org/10.1186/gb-2009-10-6-r64
- [42] García EA, Zárate CIS, Díaz FRG, Bordes
JLN, Fariña GIG andTovar CGG. Determination of mRNA expression of typical
proteins of tight junctions in the intestinal mucosa of broilers (Gallus gallus
domesticus). Open J Vet Med, 11: 212–225. 2021.
https://doi.org/10.4236/ojvm.2021.116014
- [43] Ozden O, Black BL, Ashwell CM, Tipsmark
CK, Borski RJ andGrubb BJ. Developmental profile of claudin-3, -5, and -16
proteins in the epithelium of chick intestine. Anat Rec (Hoboken), 293:
1175–1183. 2010. PMID:20583258,
https://doi.org/10.1002/ar.21163
- [44] Rahner C, Fukuhara M, Peng S, Kojima S
andRizzolo LJ. The apical and basal environments of the retinal pigment
epithelium regulate the maturation of tight junctions during development. J Cell
Sci, 117: 3307–3318. 2004. PMID:15226402,
https://doi.org/10.1242/jcs.01181
- [45] Hunziker W, Kiener TK andXu J. Vertebrate
animal models unravel physiological roles for zonula occludens tight junction
adaptor proteins. Ann N Y Acad Sci, 1165: 28-33. 2009.
https://doi.org/10.1111/j.1749-6632.2009.04033.x
- [46] Honkatukia M, Tuiskula-Haavisto M, Ahola
V, Uimari P, Schmutz M, Preisinger R, Cavero D, Vennerström P, Arango J,
O’Sullivan N, Fulton J andVilkki J. Mapping of QTL affecting incidence of blood
and meat inclusions in egg layers. BMC Genet, 12: 55. 2011. PMID:21668941,
https://doi.org/10.1186/1471-2156-12-55
- [47] Ghiselli F, Rossi B, Felici M, Parigi M,
Tosi G, Fiorentini L, Massi P, Piva A andGrilli E. Isolation, culture, and
characterization of chicken intestinal epithelial cells. BMC Mol Cell Biol, 22:
12. 2021. PMID:33579204,
https://doi.org/10.1186/s12860-021-00349-7
- [48] Wang L, Li L, Lv Y, Chen Q, Feng J
andZhao X. Lactobacillus plantarum Restores Intestinal permeability disrupted by
Salmonella infection in newly-hatched chicks. Sci Rep, 8: 2229. 2018.
PMID:29396554, https://doi.org/10.1038/s41598-018-20752-z
- [49] Zhang J, Gao YY, Huang YQ, Fan Q, Lu XT
andWang CK. Selection of housekeeping genes for quantitative gene expression
analysis in yellow-feathered broilers. Ital J Anim Sci, 17: 540–546. 2018.
https://doi.org/10.1080/1828051X.2017.1365633
- [50]R Core Team R: A Language and
Environment for Statistical Computing 2023.
https://www.r-project.org/
- [51] Lin H andPeddada SD. Analysis of
compositions of microbiomes with bias correction. Nat Commun, 11: 3514. 2020.
PMID:32665548, https://doi.org/10.1038/s41467-020-17041-7
- [52] Fernandes AD, Macklaim JM, Linn TG, Reid
G andGloor GB. ANOVA-like differential expression (ALDEx) analysis for mixed
population RNA-Seq. PLoS One, 8: e67019. 2013. PMID:23843979,
https://doi.org/10.1371/journal.pone.0067019
- [53] Kanehisa M, Furumichi M, Sato Y,
Kawashima M andIshiguro-Watanabe M. KEGG for taxonomy-based analysis of pathways
and genomes. Nucleic Acids Res, 51: D587–D592. 2023. PMID:36300620,
https://doi.org/10.1093/nar/gkac963
- [54] Da Costa M, Cookson K, Sander J, Niino T,
McRee A, Schaeffer J andDickson J. Live Salmonella typhimurium vaccination of
broilers results in cross-protection against other salmonella serotypes at
different ages of exposure. Proceedings of the 68th Western Poultry Disease
Conference, Puerto Vallarta, Jalisco, Mexico, pp. 59–61. 2019.
- [55] Baba E, Yaono M, Fukata T andArakawa A.
Infection by Salmonella typhymurium, S. agona, S. enteritidis or S. infantis of
chicks with caecal coccidiosis. Br Poult Sci, 26: 505–511. 1985. PMID:4075192,
https://doi.org/10.1080/00071668508416841
- [56] Pasetti MF, Simon JK, Sztein MB andLevine
MM. Immunology of gut mucosal vaccines. Immunol Rev, 239: 125–148. 2011.
PMID:21198669, https://doi.org/10.1111/j.1600-065X.2010.00970.x
- [57] Chappell L, Kaiser P, Barrow P, Jones MA,
Johnston C andWigley P. The immunobiology of avian systemic salmonellosis. Vet
Immunol Immunopathol, 128: 53–59. 2009. PMID:19070366,
https://doi.org/10.1016/j.vetimm.2008.10.295
- [58] Dougan G, John V, Palmer S andMastroeni
P. Immunity to salmonellosis. Immunol Rev, 240: 196–210. 2011. PMID:21349095,
https://doi.org/10.1111/j.1600-065X.2010.00999.x
- [59] Pietruska A, Bortoluzzi C andHauck R. A
meta-analysis of the effect of Eimeria spp. and/or Clostridium perfringens
infection on the microbiota of broiler chickens. Poult Sci, 102: 102652. 2023.
PMID:37019075, https://doi.org/10.1016/j.psj.2023.102652
- [60] Redweik GAJ, Daniels K, Severin AJ, Lyte
M andMellata M. Oral treatments with probiotics and live Salmonella vaccine
induce unique changes in gut neurochemicals and microbiome in chickens. Front
Microbiol, 10: 3064. 2020. PMID:32010110,
https://doi.org/10.3389/fmicb.2019.03064
- [61] Park SH, Kim SA, Rubinelli PM, Roto SM
andRicke SC. Microbial compositional changes in broiler chicken cecal contents
from birds challenged with different Salmonella vaccine candidate strains.
Vaccine, 35: 3204–3208. 2017. PMID:28479173,
https://doi.org/10.1016/j.vaccine.2017.04.073
- [62] Künzel S, Borda-Molina D, Kraft R,
Sommerfeld V, Kühn I, Camarinha-Silva A andRodehutscord M. Impact of
coccidiostat and phytase supplementation on gut microbiota composition and
phytate degradation in broiler chickens. Anim Microbiome, 1: 5. 2019.
PMID:33499963, https://doi.org/10.1186/s42523-019-0006-2
- [63] Manning JG, Hargis BM, Hinton A, Jr,
Corrier DE, DeLoach JR andCreger CR. Effect of selected antibiotics and
anticoccidials on Salmonella enteritidis cecal colonization and organ invasion
in Leghorn chicks. Avian Dis, 38: 256–261. 1994. PMID:7980273,
https://doi.org/10.2307/1591946
- [64] Guo C, Ma J, Zhong Q, Zhao M, Hu T, Chen
T, Qiu L andWen L. Curcumin improves alcoholic fatty liver by inhibiting fatty
acid biosynthesis. Toxicol Appl Pharmacol, 328: 1–9. 2017. PMID:28476407,
https://doi.org/10.1016/j.taap.2017.05.001
- [65] Shi K, Zhao Q, Shao M, Duan Y, Li D, Lu
Y, Tang Y andFeng C. Untargeted metabolomics reveals the effect of selective
breeding on the quality of chicken meat. Metabolites, 12: 367. 2022.
PMID:35629871, https://doi.org/10.3390/metabo12050367
- [66] Meng J, Ma N, Liu H, Liu J, Liu J, Wang
J, He X andZhao X. Untargeted and targeted metabolomics profiling reveals the
underlying pathogenesis and abnormal arachidonic acid metabolism in laying hens
with fatty liver hemorrhagic syndrome. Poult Sci, 100: 101320. 2021.
PMID:34274572, https://doi.org/10.1016/j.psj.2021.101320
- [67] Shini S, Shini A andBryden WL.
Unravelling fatty liver haemorrhagic syndrome: 2. Inflammation and
pathophysiology. Avian Pathol, 49: 131–143. 2020. PMID:31621393,
https://doi.org/10.1080/03079457.2019.1682119
- [68] Sonnweber T, Pizzini A, Nairz M, Weiss G
andTancevski I. Arachidonic acid metabolites in cardiovascular and metabolic
diseases. Int J Mol Sci, 19: 3285. 2018. PMID:30360467,
https://doi.org/10.3390/ijms19113285
- [69] Anderson JM andVan Itallie CM. Tight
junctions and the molecular basis for regulation of paracellular permeability.
Am J Physiol Gastrointest Liver Physiol, 269: G467–G475. 1995. PMID:7485497,
https://doi.org/10.1152/ajpgi.1995.269.4.G467
- [70] Mitic LL, Van Itallie CM andAnderson JM.
Molecular physiology and pathophysiology of tight junctions i. tight junction
structure and function: lessons from mutant animals and proteins. Am J Physiol
Gastrointest Liver Physiol, 279: G250–G254. 2000. PMID:10915631,
https://doi.org/10.1152/ajpgi.2000.279.2.G250
- [71] Chen J, Tellez G, Richards JD andEscobar
J. Identification of potential biomarkers for gut barrier failure in broiler
chickens. Front Vet Sci, 2: 14. 2015. PMID:26664943,
https://doi.org/10.3389/fvets.2015.00014
- [72] Ulluwishewa D, Anderson RC, McNabb WC,
Moughan PJ, Wells JM andRoy NC. Regulation of tight junction permeability by
intestinal bacteria and dietary components. J Nutr, 141: 769–776. 2011.
PMID:21430248, https://doi.org/10.3945/jn.110.135657
- [73] Wang W, Li Z, Han Q, Guo Y, Zhang B
andD’inca R. Dietary live yeast and mannan-oligosaccharide supplementation
attenuate intestinal inflammation and barrier dysfunction induced by Escherichia
coli in broilers. Br J Nutr, 116: 1878–1888. 2016. PMID:27989252,
https://doi.org/10.1017/S0007114516004116
- [74] Fanning AS, Jameson BJ, Jesaitis LA
andAnderson JM. The tight junction protein ZO-1 establishes a link between the
transmembrane protein occludin and the actin cytoskeleton. J Biol Chem, 273:
29745–29753. 1998. PMID:9792688,
https://doi.org/10.1074/jbc.273.45.29745
- [75] Yu D andTurner JR. Stimulus-induced
reorganization of tight junction structure: the role of membrane traffic.
Biochim Biophys Acta Biomembr, 1778: 709–716. 2008. PMID:17915190,
https://doi.org/10.1016/j.bbamem.2007.07.027
- [76] Chang CH, Teng PY, Lee TT andYu B.
Effects of multi-strain probiotics combined with Gardeniae fructus on intestinal
microbiota, metabolites, and morphology in broilers. J Poult Sci, 56: 32–43.
2019. PMID:32055194, https://doi.org/10.2141/jpsa.0170179
- [77] Shao Y, Guo Y andWang Z. β-1,3/1,6-Glucan
alleviated intestinal mucosal barrier impairment of broiler chickens challenged
with Salmonella enterica serovar Typhimurium. Poult Sci, 92: 1764–1773. 2013.
PMID:23776263, https://doi.org/10.3382/ps.2013-03029
- [78] Stockinger A, Eger A, Wolf J, Beug H
andFoisner R. E-cadherin regulates cell growth by modulating
proliferation-dependent β -catenin transcriptional activity. J Cell Biol, 154:
1185–1196. 2001. PMID:11564756,
https://doi.org/10.1083/jcb.200104036
- [79] Zechner D, Fujita Y, Hülsken J, Müller T,
Walther I, Taketo MM, Bryan Crenshaw E, III, Birchmeier W andBirchmeier C.
β-Catenin signals regulate cell growth and the balance between progenitor cell
expansion and differentiation in the nervous system. Dev Biol, 258: 406–418.
2003. PMID:12798297,
https://doi.org/10.1016/S0012-1606(03)00123-4
- [80] Xie S, Li Y, Zhao S, Lv Y andYu Q.
Salmonella infection induced intestinal crypt hyperplasia through Wnt/β-catenin
pathway in chicken. Res Vet Sci, 130: 179–183. 2020. PMID:32199176,
https://doi.org/10.1016/j.rvsc.2020.03.008

