Abstract
The consumption of products made from Tartary buckwheat (Fagopyrum tataricum (L.) Gaertn.) has increased in recent years in Japan. Increased consumer demand has led to recognition of the need for early varieties of this crop with high and stable yields. In order to accomplish this, more information is needed on the genetic mechanisms affecting earliness and yield. We conducted genetic analysis of 3 agronomic traits (days to flowering, plant height and total seed weight per plant) to segregate F2 and F3 populations derived from a cross between Tartary buckwheat cultivars ‘Hokuriku No. 4’ and ‘Ishisoba’. Broad-sense heritability estimates for days to flowering, plant height and total seed weight were 0.70, 0.62 and 0.75, respectively, in F3 population. Narrow-sense heritability for total seed weight (0.51) was highest, followed by heritability for days to flowering (0.37), with heritability for plant height (0.26) lowest. Later flowering was associated with increased plant height and higher yields. From the F4 generation, we identified twelve candidate plants with earlier maturity and reduced plant height compared to ‘Hokuriku No. 4’, but almost the same total seed weight. These results suggest that hybridization breeding using the single seed descent (SSD) method is an effective approach for improving agronomic characteristics of Tartary buckwheat.
Introduction
Tartary buckwheat (Fagopyrum. tataricum (L.) Gaertner) is an annual self-pollinated species. On the other hand, common buckwheat, which is familiar to Japanese food culture, is an outcrossing plant. Tartary buckwheat originated in China and is currently cultivated in China, neighboring countries and other countries of the world (Brunori et al. 2006, Lin and Song 2006). In China, Tartary buckwheat has historically been cultivated in areas with harsh environmental conditions (Campbell 2004), such as those found at high elevations on the Loess and Yungui plateaus in the western part of the country. These areas are characterized by a thin soil layer, low temperatures, lower-than-average rainfall, minimal agricultural infrastructure and low crop yields (Lin et al. 2006). Recently, the cultivation of Tartary buckwheat has been receiving increased attention in Japan, China, South Korea, Europe, the United States and other countries, where it is recognized as having health-promoting and nutraceutical properties (Joshi 2005, Kreft et al. 2003, Wang and Campbell 2007).
In Japan, Tartary buckwheat is considered a functional food that is used for the production of noodles (‘sobakiri’) and tea (‘soba cha’). The annual consumption of products produced from Tartary buckwheat has increased and the demand for this grain is expected to grow several-fold in the coming years (Honda et al. 2006). At the present time, most of the Tartary buckwheat consumed in Japan is imported from China. Due to concerns about domestic food security and rising market prices, increased domestic production of Tartary buckwheat has been suggested by both consumers and farmers (Honda et al. 2010).
Cultivation of Tartary buckwheat in Japan has relied heavily upon varieties introduced from China, Nepal and Russia (Minami 2004); however, recently, ten varieties of Tartary buckwheat were released and are now cultivated in Japan. For example, cultivar ‘Hokkai T No. 8’ was developed from ‘Rotundatum’ (abbreviation of F. rotundatum–syn. F. tatarticum) at the National Agricultural Research Center for the Hokkaido Region in Memuro. The parental genetic material was obtained from the N. I. Vavilov All-Russian Research Institute of Plant Industry (Honda et al. 2010). ‘Rotundatum’ is noted for its resistance to lodging. Cultivar ‘Hokuriku No. 4’ was developed on the main island of Japan (Ito 2004); it is shorter, with earlier flowering time, and has larger grains than ‘Hokkai T No. 8’. ‘Hokuriku No. 4’ was developed via individual selection utilizing genetic resources obtained from Nepal.
The ten varieties so far released in Japan were bred from imported local varieties or genetic resources via individual plant selection (MAFF 2010). Although presently cultivated in Japan, these cultivars are not well adapted to the various local growing environments of the districts and are prone to problems associated with lodging due to excessive plant height, frost damage due to late maturity, and low yield. Although attempts to improve these materials via plant selection continue, the genetic base of these cultivars is relatively narrow. Hence, it is not expected that traditional selection methods may result in lines with the desired characteristics. Thus, Japanese plant breeders are challenged with the task of developing new varieties adapted to the diverse environmental conditions within the country.
Hybridization breeding is a very popular method for the improvement of self-pollinating crop plants and can serve to broaden their genetic base. In order to successfully utilize this approach, data are required on the heritability of and correlations between the traits that are to be improved or altered. A typical experimental approach would involve the following: (1) determining the relative importance of genetic effects of the loci for the traits to be improved, (2) determining which selection method(s) would be most efficient for the transfer of these traits and (3) predicting the gain to be expected from the selection process (Poehlman and Sleper 1995). This information can be obtained from populations derived from crosses between appropriate parental lines by examining the segregation patterns and estimating genetic parameters and the relationships among traits.
In this study, we examined heritability and estimated phenotypic and genetic correlations for three traits (days to flowering, plant height, and total seed weight) of F2 and F3 populations derived from a cross of the Tartary buckwheat cultivars ‘Hokuriku No. 4’ and ‘Ishisoba’. In addition, we identified superior individuals in the F4 generation.
Materials and Methods
Plant materials
Cultivars ‘Hokuriku No. 4’ and ‘Ishisoba’ were selected as parents for segregating generation analysis; the suitability of these cultivars as parents was demonstrated in a previous study (Li et al. 2011). The higher yielding ‘Hokuriku No. 4’ was developed at Hokuriku Agricultural Station (Ito 2004). This cultivar contains many dominant alleles for several agronomic traits, such as plant height and total seed weight (Li et al. 2011). The local variety ‘Ishisoba’ was originally acquired from Sakhalin (Honda et al. 2004). ‘Ishisoba’ matures earlier, is shorter and contains many recessive alleles for several agronomic traits, such as plant height and total seed weight (Li et al. 2011).
The procedures for preparing the segregating populations that were utilized in our experiment are presented in Fig. 1. The initial hybridization of ‘Hokuriku No. 4’ × ‘Ishisoba’ was performed in 2005. In 2006, 367 F2 seeds were produced from a single F1 plant. One hundred and forty F2 individuals (Fig. 1A) were utilized to estimate heritability. Of the remaining F2 seeds, 140 individuals (Fig. 1B) were selected and an F3 generation was produced from them by single seed descent (SSD) in 2007.
The F3 population (Fig. 1C) was composed of 140 F3 individuals that were selected from each F3 line. To estimate the mode of inheritance, we used 140 F2 (Fig. 1A) and 140 F3 (Fig. 1C) individuals.
In addition, one plant in each F3 line (Fig. 1D) was grown to maturity and F4 seeds were produced from them in 2009. To investigate the possibility of the occurrence of superior individuals, in 2010 we used the F4 population (Fig. 1E), which consisted of 140 lines, each of which was composed of 20 individuals.
Plant cultivation
The 140 individual F2 (Fig. 1A) and F3 (Fig. 1C) plants and 25 plants of each parent, were grown in a net house at the Agriculture and Forestry Research Center, University of Tsukuba (Ibaraki, Japan). Seeds were sown on August 13, 2010 in 24 cm diameter vinyl pots filled with a standard potting mix (Tsuchitaro, Sumitomo Forestry Co., Ltd.). Each pot contained a single plant.
The 2800 individual plants derived from the 140 F4 lines and 20 plants of each parent, were grown in the field at the same location as mentioned previously. Seeds were sown on August 11, 2010. The plot size was 1.35 m2 for each line. The distance between rows in each plot was 25 cm; the distance between individual plants within plots was 20 cm. Nitrogen, phosphorus and potassium fertilizer was applied prior to planting at a rate of 4, 2 and 2 kg/ha, respectively.
Phenotypic measurements
The three traits evaluated for their heritability were days to flowering, plant height and total seed weight per plant. In the present study, total seed weight per plant is considered a yield trait. When we evaluated candidate individuals in the F4 generation, both the number of seeds per plant and the 1000 seed weight were measured in order to determine whether the high-yielding selections produced heavier individual seeds or a larger number of seeds. Days to flowering were determined as the number of days from sowing to the date of the first flowering of each plant. Plants were harvested when 70 to 80% of the total seeds per plant were mature. Plant height was measured at harvest time. The 1000 seed weight, number of seeds per plant and total seed weight per plant were measured two weeks after harvesting and drying.
In the F4 generation, plants with total seed weight per plant heavier, and flowering period earlier than ‘Hokuriku No. 4’ and plant height 100 cm or less (Li et al. 1999) were selected.
Data analysis
Tests of significance between parents, and between F2 population and F3 population distribution, for each trait
The t-test was performed to test the significance of differences between parents, and the F-test to test for similarities between the F2 and F3 distributions of the three traits. JMP 5.0.1 software was utilized for these tests (SAS Institute Inc., Cary, NC, USA).
Estimation of genetic parameters
We estimated the genetic parameters and heritability from the within-generation variances of each trait. According to Mather and Jinks (1971), within-generation variances are composed of an additive variance component (A), a dominance variance component (D) and an environmental variance component (E) and the phenotypic variance (VP) of the F2 generation is expressed as follows:
|
V
P
(
F
2
)
=
1
/
2
A
+
1
/
4
D
+
E
1
, |
and that of the F3 as follows:
|
V
P
(
F
3
)
=
3
/
4
A
+
3
/
16
D
+
E
1
. |
The number of individuals of each parent was different. Hence, we defined E1 as follows (National Agricultural Research Center 1995):
|
E
1
=
(
S
1
+
S
2
)
/
(
n
1
+
n
2
-
2
)
, |
where S1 and S2 are the sums of squares, and n1 and n2 are the numbers of plants, of each respective parent. The broad-sense (h2B[Ft]) and narrow-sense (hN2 [Ft]) heritability estimates were defined as follows:
|
h
B
2
[
F
t
]
=
(
1
-
(
1
/
2
)
t
-
1
)
A
+
(
1
/
2
)
t
-
1
(
1
-
(
1
/
2
)
t
-
1
)
D
(
1
-
(
1
/
2
)
t
-
1
)
A
+
(
1
/
2
)
t
-
1
(
1
-
(
1
/
2
)
t
-
1
)
D
+
E
1 |
and
|
h
N
2
[
F
t
]
=
(
1
-
(
1
/
2
)
t
-
1
)
A
(
1
-
(
1
/
2
)
t
-
1
)
A
+
(
1
/
2
)
t
-
1
(
1
-
(
1
/
2
)
t
-
1
)
D
+
E
1 |
where t is the generation. We also calculated the 95% confidence intervals for broad-sense heritability in each generation with the following formulas (Hashiguchi 1955):
|
ρ
¯
=
1
-
1
F
n
1
n
2
(
0.025
)
(
1
-
h
^
2
)
ρ
_
=
1
-
F
n
2
n
1
(
0.025
)
(
1
-
h
^
2
) |
where ρ̄ and ρ_ are the upper and lower limits of the 95% confidence intervals, respectively and n1 and n2 are the sample numbers in the segregating and non-segregating generations, respectively. Furthermore, using the additive variances, we determined true-sense heritability—which is independent of generation—defined as follows (Ukai, 2002):
|
h
t
r
u
e
2
=
A
A
+
E
1
. |
In the F3 population, phenotypic correlations (rp) and genetic correlations (rG) among traits were estimated as follows (Ukai 2002):
|
γ
P
=
Cov
(
Y
A
,
Y
B
)
Var
(
Y
A
)
×
Var
(
Y
B
)
, |
and
|
γ
G
=
Cov
(
Y
A
,
Y
B
)
-
Cov
(
e
A
,
e
B
)
(Var
(
Y
A
)
-
Var
(
e
A
)
)
×
(
Var
(
Y
B
)
-
Var
(
e
B
)
)
, |
where YA and YB are the phenotypic variances of traits A and B, respectively and eA and eB are the environmental variances of traits A and B, respectively.
Results
Distributions of parents, F2 and F3 generations for each agronomic trait
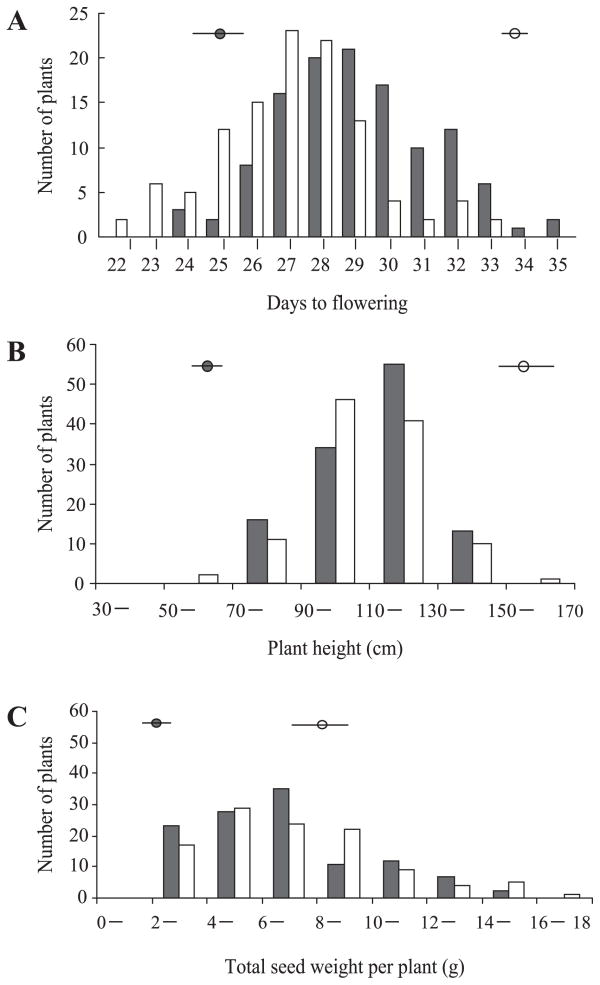
The differences between parents and the F2 and F3 generations were significant (P < 0.01) for the observed values of all three traits (Fig. 2). In both F2 and F3 generations, the three traits showed similar continuous distribution patterns with a single peak. In general, the patterns show that these are quantitative traits. Moreover, the observed values for days to flowering (A) and plant height (B) of F2 and F3 individuals were distributed between those observed for the parental lines. Transgressive segregation was observed for total seed weight (C) in both the F2 and F3 generations where it exceeded that of the parental line ‘Hokuriku No. 4’.
Genetic parameters of each agronomic trait
For all three traits examined, dominance variance exceeded additive variance, and the average degrees of dominance were greater than 1.0 (Table 1). Broad-sense heritability of days to flowering, plant height and total seed weight were 0.69, 0.63 and 0.73 in the F2 generation and 0.70, 0.62 and 0.75, in the F3 generation, respectively. Confidence intervals for both generations were similar. Narrow-sense heritability for the three traits in the F3 generation was higher than in the F2 generation. Narrow-sense heritability for total seed weight (0.51) was highest, followed by the heritability for days to flowering (0.37), with heritability for plant height (0.26) lowest in F3 population. True-sense heritability ranged from 0.48 (plant height) to 0.73 (total seed weight).
Table 1
Genetic parameters of three agronomic traits
| Traits |
Additive variance (A) |
Dominance variance (D) |
Average degree of dominanace (
D
/
A) |
Environmental variance (E) |
Broad sense heritability (95% confidence interval) |
Narrow sense heritability |
True sense heritability (A/(A + E)) |
| F2 |
F3 |
F2 |
F3 |
| Days to flowering |
2.66 |
9.17 |
1.86 |
1.62 |
0.69 (0.48–0.81) |
0.70 (0.49–0.81) |
0.25 |
0.37 |
0.62 |
| Plant height |
93.69 |
528.36 |
2.37 |
103.29 |
0.63 (0.39–0.77) |
0.62 (0.36–0.76) |
0.17 |
0.26 |
0.48 |
| Total seed weight per plant |
6.98 |
12.98 |
1.36 |
2.54 |
0.73 (0.54–0.83) |
0.75 (0.58–0.84) |
0.38 |
0.51 |
0.73 |
The coefficients of genetic correlation for all three traits were higher than their corresponding coefficients of phenotypic correlation (Table 2). Days to flowering were phenotypically and genetically correlated with plant height (r = 0.356, 0.621), but were not significantly correlated with total seed weight. Plant height was phenotypically and genetically correlated with total seed weight (r = 0.546, 0.800).
Table 2
Phenotypic and genetic correlation among three agronomic traits
| Traits |
Days to flowering |
Plant height |
Total seed weight per plant |
| Days to flowering |
— |
0.621 |
0.240 |
| Plant height |
0.356 |
— |
0.800 |
| Total seed weight per plant |
0.131 |
0.546 |
— |
Below the diagonal: phenotypic correlation; Above the diagonal: genetic correlation; Bold font: significant at 1% level.
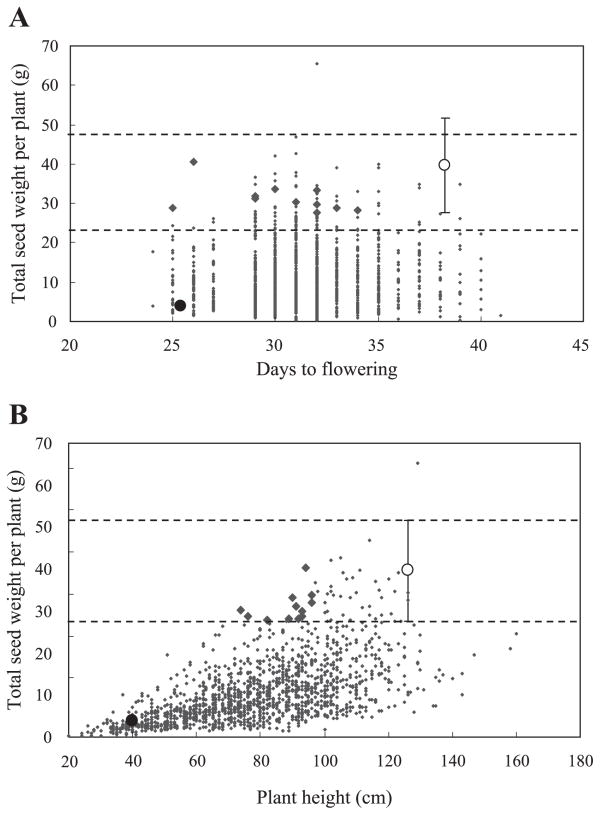
Individuals could not be found that met all requirements for selection, so 12 F4 individuals were identified with total seed weight within the standard deviation for ‘Hokuriku No. 4’ (27~52 g), with earlier flowering time than the mean of ‘Hokuriku No. 4’ (38 days) and with plant height lower than 100 cm (Table 3). When the 12 individuals (bold diamonds in Fig. 3A, 3B) were compared with the mean of ‘Hokuriku No. 4’, they showed flowering time 4 to 13 days earlier, plant height 59 to 76% and total seed weight 70 to 100%.
Table 3
Agronomic traits measured in 12 candidate individuals selected from F
4 population and a parental line (‘Hokuriku No. 4’)
| Plant number |
Days to flowering (day) |
Plant height (cm) |
Total seed weight per plant (g) |
Number of seeds per plant |
1000 seed weight (g) |
| 18–8 |
31 |
74 |
30 |
1,795 |
16.8 |
| 18–15 |
34 |
92 |
28 |
1,571 |
18.0 |
| 21–10 |
33 |
93 |
29 |
1,294 |
22.2 |
| 25–6 |
30 |
96 |
34 |
1,889 |
17.9 |
| 27–14 |
32 |
93 |
30 |
1,826 |
16.3 |
| 70–12 |
29 |
91 |
31 |
1,452 |
21.5 |
| 73–3 |
32 |
89 |
28 |
1,171 |
23.9 |
| 73–6 |
32 |
82 |
28 |
1,224 |
22.9 |
| 75–1 |
26 |
94 |
40 |
1,883 |
21.5 |
| 81–4 |
25 |
76 |
29 |
1,610 |
17.9 |
| 86–8 |
32 |
90 |
33 |
1,916 |
17.3 |
| 94–15 |
29 |
96 |
32 |
1,582 |
20.2 |
| u |
38 |
126 |
40 |
1,920 |
20.5 |
| u − σ |
36 |
106 |
27 |
1,358 |
19.4 |
| u + σ |
40 |
146 |
52 |
2,482 |
21.6 |
u and σ are the mean and standard deviation for Hokuriku No. 4, respectively.
Discussion
Heritability of agronomic traits
In the present study, broad-sense heritability was around ~0.7 for the three traits examined (Table 1). The results indicate that all traits examined were affected by environmental factors to a comparable degree. Previously, Li et al. (2011) reported that all of the 8 traits examined in analyses of a 6 parent diallel cross of Tartary buckwheat had high broad-sense heritability ranging from 0.87 to 0.98. These differences in heritability estimates may come from the estimation methods adopted for environmental variances. They estimated the environmental variance E1 based on the means of six parental lines with two replications while, in the present study, we estimated E1 from the distributions of two parental line populations according to the procedure described by the National Agricultural Research Center (1995).
Unlike broad-sense heritability, narrow-sense heritability differed among the traits. Total seed weight showed the highest narrow-sense heritability, followed by days to flowering and plant height was lowest in both F2 and F3. The lowest narrow-sense heritability for plant height was attributed to the large dominance variance (528.36) associated with this trait. True-sense heritability defined by Ukai (2002), which is independent of the generation in which the heritability is measured, was also lowest for plant height among the three traits.
In lentils, narrow-sense heritability estimates for plant height and days to flowering were 0.65 and 0.31, respectively, in F2 population (Tullu et al. 2008). In chickpeas, narrow-sense heritability estimates of plant height and days to flowering were 0.65 and 0.46, respectively, in F2 population (Anbessa et al. 2006). Narrow-sense heritability of plant height and days to flowering in Tartary buckwheat were lower than in these crops, suggesting that plant height and days to flowering should be selected in advanced generations in Tartary buckwheat.
In rice, broad-sense and narrow-sense heritability estimates of total seed weight were 0.79 and 0.37, respectively, in F2 generation (Ahmadikhan 2010). In cowpeas, those values were 0.80 and 0.28, respectively, in F3 generation (Padi 2007). In comparison with these crops, broad-sense heritability of total seed weight in Tartary buckwheat was lower, but its narrow-sense heritability was larger. This suggested that the additive effect for total seed weight was large in Tartary buckwheat, and it indicated that more rapid fixation of alleles for this trait was possible.
Broad-sense heritability of the three traits was nearly equal between F2 and F3; however, as the generations advanced, narrow-sense heritability increased. These results are natural, since the contribution of dominance variance in narrow-sense heritability decreases with the generation.
Correlation between traits
In gramineous crop plants, taller stature is usually associated with higher yield. Our data also indicated significant positive phenotypic and genetic correlations between plant height and total seed weight. In previous studies, Arshad et al. (2004), Khan et al. (1989) and Malik et al. (1987) reported significant positive correlations of grain yield with plant height. In the history of wheat improvement, this positive correlation has hindered breeding efforts in simultaneous selecting of short-strawness and high yield (Law et al. 1978). Similarly, the data presented here suggest that breeding for short stature in combination with high yield in Tartary buckwheat may be difficult. It is well known that utilization of the semi-dwarf growth characteristic of ‘Norin 10’ greatly increased production efficiency in wheat (Vogel et al. 1963). The detection or mutagenic induction of semi-dwarfing genes in Tartary buckwheat, if possible, could potentially facilitate the improvement of this crop in a similar manner.
Concerning the use of hybridization breeding for the improvement of Tartary buckwheat
In the present study, the generations were advanced using SSD until F4, in which selection of promising lines was carried out. Days to flowering, plant height and total seed weight were effectively selected for in the F4 generation. We obtained 12 candidate individuals in the F4 generation with total seed weight values comparable to that of ‘Hokuriku No. 4’, but with days to flowering earlier than ‘Hokuriku No. 4’ and plant height less than 100 cm (Fig. 3 and Table 3). Of particular note was line Number 75-1 (Table 3), which was 26 days earlier in flowering, shorter in plant height by 94 cm and had nearly equal total seed weight (40 g) to ‘Hokuriku No. 4’.
In addition, in their study of lentils, Haddad and Muehlbauer (1981) reported that the genetic variances of plant height, days to maturity and yield in the F4 generation were significantly higher with SSD than with bulking methods. The results obtained using the F4 generation would not differ greatly from the results obtained using the F5 generation, as 87.5% of all loci are expected to be fixed by F4.
In conclusion, our results indicate that hybridization breeding using the SSD method can be effective for the improvement of yield in Tartary buckwheat. This approach would be especially valuable when combined with QTL analysis.
Acknowledgments
We express our gratitude to members of the Plant Breeding Laboratory, University of Tsukuba, for their generous assistance in carrying out this research.
Literature Cited
- Ahmadikhan, A. (2010) Study on selection effect, genetic advance and genetic parameters in rice. Ann. Biol. Res. 1: 45–51.
- Anbessa, Y., T. Warkentin, A. Vandenberg and M. Bandara (2006) Heritability and predicted gain from selection in components of crop duration in divergent chickpea cross populations. Euphytica 152: 1–8.
- Arshad, M., A. Bakhsh and A. Ghafoor (2004) Path coefficient analysis in chickpea (Cicer arietinum L.) under rainfed conditions. Pak. J. Bot. 36: 75–81.
- Brunori, A., A. Brunori, G. Baviello, E. Marconi, M. Colonna, M. Ricci and P. Mandarino (2006) Yield assessment of twenty buckwheat (Fagopyrum esculentum Moench and Fagopyrum tataricum Gaertn.) varieties grown in Central (Molise) and Southern Italy (Basilicata and Calabria). Fagopyrum 23: 83–90.
- Campbell, C. (2004) Present state and future prospects for buckwheat. In: “Proc. 9th Intl. Symp. Buckwheat”, Prague, pp. 26–29.
- Haddad, N.I. and F.J. Muehlbauer (1981) Comparison of random bulk population and single-seed-descent methods for lentil breeding. Euphytica 30: 643–651.
- Hashiguchi, S. (1955) Confidence interval of broad-sense heritability. Nogyo Toukei Kenkyu 3: 36.
- Honda, Y., Y. Mukasa, T. Suzuki and N. Abe (2004) Stone buckwheat. Genetic resources of buckwheat in Japan. In: “9th Int. Symp. Buckwheat”, Prague, pp. 185–189.
- Honda, Y., T. Suzuki, A. Sabitov and O.I. Romanova (2006) Collaborative exploration and collection of resources crops including Tartary buckwheat, Fagopyrum tataricum L, in Sakhalin, Russia. Plant inheritance resource search investigation report. 22: 1–99.
- Honda, Y., Y. Mukasa, T. Suzuki, S. Yokota, K. Nakatsukasa, M. Kimura, M. Kawakatsu and M. Agatsuma (2010) Breeding and Characteristics of a Tartary buckwheat, ’Hokkai T No. 8’ Res. Bull. Natl. Agric. Res. Cent. Hokkaido Region 192: 1–13.
- Ito, S. (2004) A new common buckwheat variety ‘TOYOMUSUME’ and new Tartary buckwheat lines. Hokuriku Crop Sci. 40: 146–149.
- Joshi, B.K. (2005) Correlation, regression and path coefficient analyses for some yield components in common and Tartary buckwheat in Nepal. Fagopyrum 22: 77–82.
- Khan, I.A., M. Bashir and B.A. Malik (1989) Character association and their implication in chickpea breeding. Pak. J. Agric. Sci. 26: 214–220.
- Kreft, I., N. Fabjan and M. Germ (2003) Rutin in buckwheat: Protection of plants and its importance for the production of functional food. Fagopyrum 20: 7–11.
- Law, C.N., J.W. Snape and A.J. Worland (1978) The genetical relationship between height and yield in wheat. Heredity 40: 133–151.
- Li, C.H., K. Kobayashi, T. Hara and R. Ohsawa (2011) Diallel analysis of agronomic characters in Tartary buckwheat (Fagopyrum tataricum L. Gaertn.) Breed. Res. 13: 42–48.
- Li, F.L., W.L. Li and J.X. Cao (1999) Discussion of breeding objectives and methods on Tartary buckwheat. Buckwheat Trend 1: 12–14.
- Lin, R.F. and J.C. Song (2006) To the point of Tartary buckwheat. In: “Proceedings of the International Forum on Tartary buckwheat Industrial Economy”, pp. 3–4.
- Lin, R.R., F. Shan, J.S. Bian, H.M. Li and G.X. Ren (2006) The practice of Tartary buckwheat industrialization. In: “Proceedings of the International Forum on Tartary buckwheat Industrial Economy”, pp. 5–6.
- Malik, B.A., M. Tahir, I.A. Khan, M. Zubair and A.H. Choudhary (1987) Genetic variability, character correlations and Path analysis of yield components in mungbean (Vigna radiata (L.) Wilczek). Pak. J. Bot. 9: 89–97.
- MAFF, Ministry of Agriculture, Forestry and Fisheries (2010) http://www2.hinsyu.maff.go.jp/maff/hinshu.nsf/.
- Mather, K. and J.L. Jinks (1971) Biometrical Genetics. Chapman and Hall Ltd., London, p. 382.
- Minani, M. (2004) Tartary buckwheat cultivar, buckwheat cultivar. Japan Noodle Association President Award, Tokyo, pp. 92–94.
- National Agricultural Research Center (1995) Rice Breeding Manual, pp. 252–256.
- Padi, F.K. (2007) Early generation selection for high yielding cowpea genotypes in additive series intercropping systems with sorghum. Ann. Appl. Biol. 151: 391–400.
- Poehlman, J.M. and D.A. Sleper (1995) Breeding Field Crops, 4th edition, Iowa State University Press, Ames, Iowa, pp. 71–75.
- Tullu, A., B. Taran, T. Warkentin and A. Vandenberg (2008) Construction of an intraspecific linkage map and QTL analysis for earliness and plant height in lentil. Crop Sci. 48: 2254–2264.
- Ukai, Y. (2002) Genetic Analysis of Quantitative Traits. Igaku Shuppan Inc., Tokyo, pp. 66–123.
- Vogel, O.Q., R.E. Allan and C.J. Peterson (1963) Plant performance characteristics of semi-dwarf winter wheats producing most efficiently in Eastern Washington. Agron. J. 55: 397–398.
- Wang, Y. and C. Campbell (2007) Tartary buckwheat breeding (Fagopyrum tataricum Gaertn.) through hybridization with its rice-tartary type. Euphytica 156: 399–405.