Abstract
Laser ablation-inductively coupled plasma mass spectrometry (LA-ICP-MS) is capable of metal imaging by acquiring local spatial information. However, the preparation of an appropriate standard for quantitative analysis is difficult because the matrices between the standard and the sample should match, and homogeneity of metal concentration in the standard is required. Hence, the aim of this study was to establish a highly quantitative mercury imaging method that utilizes LA-ICP-MS and an appropriate mercury standard consisting of rat tissue. Our standard showed homogeneous mercury concentration and good linearity between concentration and signal intensity, and met the qualifications for quantitative imaging by LA-ICP-MS. Mercury concentration in MeHg-exposed rat kidneys obtained by LA-ICP-MS measurement of the standard (7.84 ± 0.57 µg/g) was comparable to that obtained by cold vapor atomic absorption spectrophotometry (AAS, 7.27 ± 0.46 µg/g). The results indicate that LA-ICP-MS enabled quantitative imaging with the appropriate standard.
INTRODUCTION
The chemical forms of naturally occurring mercury (Hg) can be divided into inorganic, metallic/elemental, and organic Hg. Methylmercury (MeHg) is an organic Hg compound that is de novo synthesized in the environment. Because MeHg is easily accumulated and condensed in organisms through the food web, it can become the primary source of Hg exposure to humans (Clarkson et al., 2007; Fernandes Azevedo et al., 2012). The toxicokinetics of Hg compounds also depends on the chemical form. It is well known that MeHg has a higher intestinal absorption rate than inorganic Hg, and is preferably distributed to the central nervous system, in particular, the cerebral cortex and the cerebellar hemisphere (Clarkson et al., 2007; Fernandes Azevedo et al., 2012). Indeed, complex disorders in the central nervous system, which are characteristic of the Hunter-Russell syndrome, are the typical clinical symptoms of MeHg toxicity (Eto, 1997). Contrary to MeHg, as inorganic Hg is preferably distributed to kidney, in particular, the renal cortex, the critical acute toxicity of inorganic Hg is renal toxicity. Thus, the quantitative and qualitative analyses of Hg would give us useful information to understand Hg toxicity.
Atomic absorption spectrophotometry (AAS) is the first choice and widely used for Hg determination. AAS for Hg analysis is carried out in combination with thermal decomposition or reducing vaporization for sample introduction. Because Hg ions in a sample solution are introduced as elemental Hg into the AAS apparatus, marked adsorption of Hg to the apparatus is avoided. Thus, we can achieve accurate and reproducible determination of Hg by AAS. However, as tissue sample must be ashed before introduction into the AAS apparatus, spatial information of Hg in the tissue sample cannot be accessed. An alternative technique is required to obtain quantitative and qualitative information of Hg in tissues.
Proton-induced X-ray emission photometry (PIXE) (Stoltenberg et al., 2003), scanning electron microscopy (SEM) (Trzeciakowski et al., 2014), and X-ray fluorescence (XRF) (O’Meara et al., 2000) are widely used for elemental imaging of biological samples. These techniques allow for the elemental analysis of solid samples and have high spatial resolution. However, the equipment and pretreatment methods for these techniques are complicated and unsuitable for routine analysis. Inductively coupled plasma mass spectrometry (ICP-MS) is another technique for the determination of elements, including Hg, with high sensitivity and robustness to matrices, and in a wide dynamic range. Laser ablation (LA) is a local sampling technique in which a solid sample is irradiated with a laser beam and the energy is used to evaporate and atomize elements on the sample surface. By connecting LA and ICP-MS, a solid sample can be directly subjected to elemental analysis without ashing, and elemental contents in a local region can be estimated. Thus, elemental imaging can be accomplished by LA-ICP-MS. Several biological applications of LA-ICP-MS have been reported. Pessôa et al. (2017) demonstrated the specific accumulation of cadmium in sunflower seeds. Hachmöller et al. (2016) reported the imaging of copper and iron in the liver of Wilson disease patients. Hare et al. (2011) showed the high intensities of lead, zinc, and cadmium in human teeth. LA-ICP-MS was also used for metal determination in hair. Ash and He (2018) measured thallium concentration in hair of a thallium-poisoned person and Pozebon et al. (2008) measured platinum concentration in hair of patients administered cisplatin. In those studies, certified standard samples were used primarily for quantification. However, those determinations were considered semi-quantitative due to the lack of an appropriate standard. A standard containing a known amount of a target element is needed to perform quantitative analysis by LA-ICP-MS. In the standard, high homogeneity of elemental content, consistent composition between matrix and sample, and an appropriate elemental concentration range are required. It is challenging to prepare a standard that meets these qualifications for biological samples.
In this study, we prepared an appropriate standard for Hg quantification in rat tissue by LA-ICP-MS. Then, we demonstrated the quantitative imaging of Hg in organ tissue of rats exposed to MeHg.
MATERIALS AND METHODS
Reagents
Methylmercury chloride (> 75.0%) was purchased from Tokyo Chemical Industry Co., Ltd. (Tokyo, Japan). Sulfuric acid (98%) and tin(II) chloride dihydrate were purchased from Kanto Chemical Industry Co., Ltd. (Tokyo, Japan). Nitric acid (analytical grade), mercury standard solution (Hg: 1000 mg/L), L-cysteine hydrochloride monohydrate, and isoflurane (for biological use) were purchased from Fujifilm Wako Pure Chemical Corporation (Osaka, Japan). Milli-Q water (18.3 MΩ cm; Merck Millipore, Burlington, MA, USA) was used for all experiments.
Instrumentation
AAS with reducing vaporization (cold vaporization AAS, CVAAS; mercury analyzer RA-5A, Nippon Instruments Corporation, Tokyo, Japan) was used to measure Hg concentration. The accuracy, precision and repeatability of Hg quantitative analysis by AAS were validated by analyzing NIES CRM No.13: Human Hair (National Institute for Environmental Studies, Ibaraki, Japan). A laser ablation system (NWR 213; Nd: YAG 213 nm; ESI, CA) was coupled to an Agilent 8800 ICP-MS/MS (Agilent Technologies, Tokyo, Japan) with a tube (Tygon® ND-100-65; Saint-Gobain, Courbevoie, France). LA measurement parameters were calibrated by using NIST 612 (NIST, Gaithersburg, MD, USA). Each parameter was optimized to maximize the signal intensities of m/z 11, 138, and 208. Analysis software iQuant2 (Suzuki et al., 2018) was used to analyze spot and imaging data by LA-ICP-MS. Samples for LA-ICP-MS analysis were embedded with O.C.T. Compound (Sakura Finetek Japan, Tokyo, Japan) and sectioned with a cryostat (Leica CM3050 S Research Cryostat; Leica, Wetzlar, Germany).
In vivo experiments
The animal experiment in this study was approved by the ethics committee for experimental animals of Chiba University, Japan, and conducted according to the “Principles of Laboratory Animal Care” (NIH version, revised 1996). Nine-week-old male Wistar rats were purchased from Japan SLC, Inc. (Shizuoka, Japan). The animals were bred in a laboratory under a 12-hr light/dark cycle with controlled humidity (50 ± 10%) and temperature (25 ± 2°C). The rats were fed a commercial diet (MF; Oriental Yeast Co., Ltd., Tokyo, Japan) and tap water ad libitum. After a one-week acclimation period, six rats were divided into two groups and used in the experiments described below. MeHg was dissolved in saline at a concentration of 1 mg Hg/mL. In this solution, a ratio of inorganic Hg as a contaminant was less than 0.01%. The first group of three rats was orally administered MeHg at 250 µg Hg/rat. The second group of three rats was administered saline as control. Eleven days after the administration, the rats were dissected under isoflurane anesthesia, and kidneys and livers were collected.
Preparation of Hg standards
The livers were homogenized in PBS with a polytron homogenizer (Model PT10/35; Kinematica AG, Lucerne, Switzerland). The homogenate was filtered through a nylon mesh (mesh size: 108 μm) to remove coarse tissue pieces and a 3.6 mL aliquot was dispensed into a 15-mL plastic tubes. Then a 0.4 mL aliquot of Hg standard solution (containing Hg as mercury chloride) was added to each tube of homogenate at the final concentration of 0, 1, 5, 10, 50 or 100 µg/mL. After incubation at 37°C for 17 hr, the homogenate was ultracentrifuged at 105,000 × g at 4°C for 30 min to remove the soluble fraction. The precipitate containing Hg at each of the six concentration levels was frozen and embedded with O.C.T. Compound, and the frozen sample was sliced with a cryostat microtome into 30-μm-thick sections using Cryofilm® (Section-Lab, Hiroshima, Japan). The frozen sections were attached on a glass slide (Azlab, Tokyo, Japan), and used as Hg standards.
Hg quantitative analysis by CVAAS
Each of the sliced Hg standards and tissue samples was mixed with a 0.5 mL aliquot of Milli-Q water, a 1 mL aliquot of nitric acid (60%), and a 1 mL aliquot of sulfuric acid (98%), and the mixture was heated to 230°C on a hot plate for 2 hr to decompose organic matter. Milli-Q water was added to adjust the volume to 5 mL. The volume-adjusted sample was subjected to CVAAS to determine Hg concentration. Tin(II) chloride dihydrate was dissolved in sulfuric acid (4.9%) to prepare a 10% tin(II) chloride solution. A 0.5 mL aliquot of the 10% tin(II) chloride solution was mixed with the sample solution in a glass tube. The generated Hg vapor was quantified by an external standard method by CVAAS. The limit of detection (LOD) and limit of quantification (LOQ) of Hg in CVAAS analysis were 3.51 and 10.6 ng/g, respectively.
As water content in biological samples would affect the determination of Hg concentration by AAS, water content in liver and kidney was accurately determined from the tissue weights before and after freeze-drying. Hg concentration of Hg standard (Cstd) was compensated by multiplying by the correction factor (F) obtained from equations 1 and 2. The F values of liver and kidney were 0.595 and 0.521, respectively.
Xs: water content in biological sample
Xstd.: water content in Hg standard
mHg: Hg mass of Hg standard obtained by AAS
mstd.: sample mass of Hg standard
Quantitative analysis of tissue samples by LA-ICP-MS
The livers and the kidneys obtained from the above experiments were embedded with O.C.T. Compound and the frozen samples were sliced with a cryostat into 30-µm-thick sections. The signal intensities of 13C and 201Hg in the samples were measured by raster scanning with LA-ICP-MS. The intensity ratio of 201Hg to 13C was converted into Hg concentration using the calibration curve obtained from the measurement of Hg standards. The analysis conditions are presented in Table 1. The LOD and LOQ of Hg in LA-ICP-MS analysis were 41.9 and 127 ng/g, respectively. The R2 value of the calibration curve was 0.997.
Table 1. Operational settings for LA-ICP-MS measurement.
| ICP-MS |
|
| RF power (W) |
1550 |
| Cones |
Nickel |
| Dwell time (msec) |
100 |
| Monitored m/z |
13, 31, 34, and 201 for C, P, S, and Hg, respectively |
| He carrier gas (L/min) |
0.8 |
| Ar makeup gas (L/min) |
1.0 |
| LA |
|
| Laser energy (%) |
1.0 |
| Spot size (diameter, µm) |
100 |
| Scan speed (µm/sec) |
100 |
| Raster spacing (µm) |
150 |
| Repetition rate (Hz) |
20 |
RESULTS AND DISCUSSION
Evaluation of Hg standards
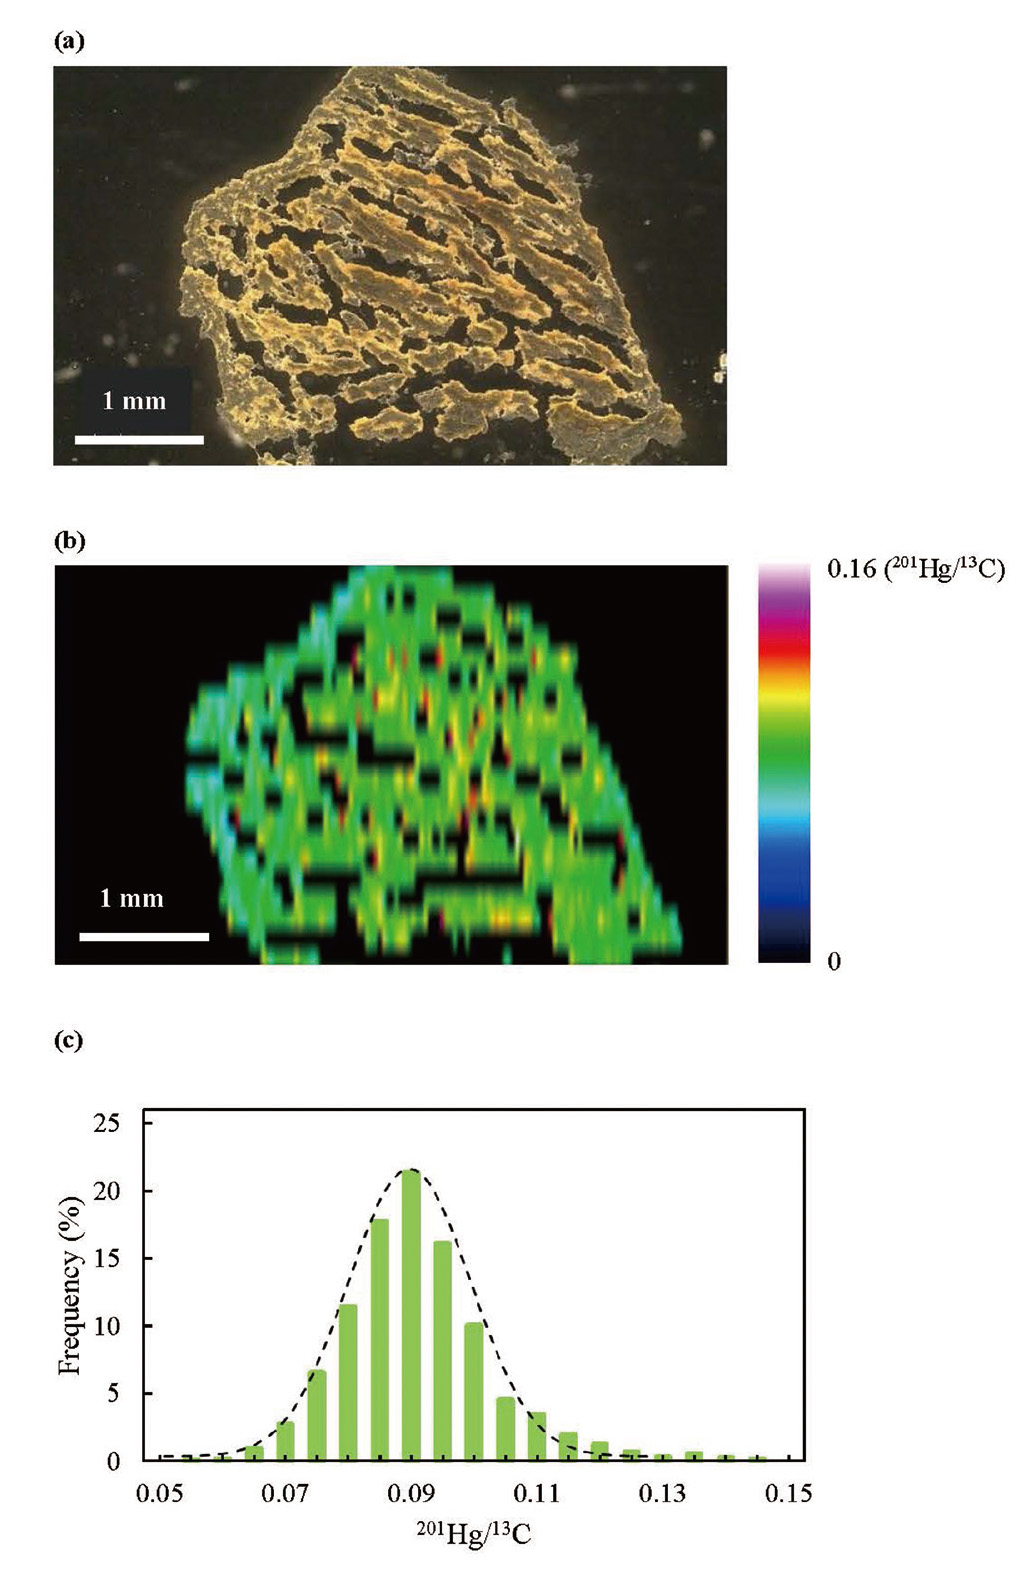
The homogeneity of the standards was evaluated by imaging analysis using LA-ICP-MS. Tissue samples were observed under a stereomicroscope and 201Hg/13C images were obtained by LA-ICP-MS analysis (Fig. 1(a) and (b)). The figures show that 201Hg/13C ratio in the standard is homogeneously distributed. The frequency for each pixel-by-pixel 201Hg/13C image data is shown in Fig. 1(c). Fig. 1(a) shows that the 201Hg/13C ratio was 0.0885 ± 0.012 (RSD: 13.6%) in the region where the tissue component was present, despite the presence of cracks in the frozen sections of Hg standard.
Imaging and quantitative analysis of Hg by LA-ICP-MS
The liver is composed of a collection of the units called liver lobules. The liver is less susceptible to bias during sample collection because of the small functional differences between sites and the high homogeneity of the tissue. Hg distribution images of the liver exposed to saline or MeHg are shown together with photomicrographs (Fig. 2). The Hg distribution images showed that the distribution of Hg in rat liver was homogeneous. The results of measurement of Hg concentration by AAS and the average Hg concentration per pixel in the Hg distribution image obtained by LA-ICP-MS are shown in Table 2. Bulk Hg concentrations in the livers of control and MeHg-exposed rats were 0.00656 ± 0.00051 and 0.605 ± 0.062 μg/g, respectively, as determined by AAS. Hg concentration in the liver of control rat could not be calculated by LA-ICP-MS because the signal intensities were below LOQ. On the other hand, LA-ICP-MS revealed that Hg concentration in the liver of MeHg-exposed rat was 0.595 ± 0.11 μg/g, which was in good agreement with the bulk concentration value. The difference between Hg concentration determined by AAS and that determined by LA-ICP-MS in the liver of MeHg-exposed rats was 1.65%, suggesting that the quantification by LA-ICP-MS using the standards gave reasonable results.
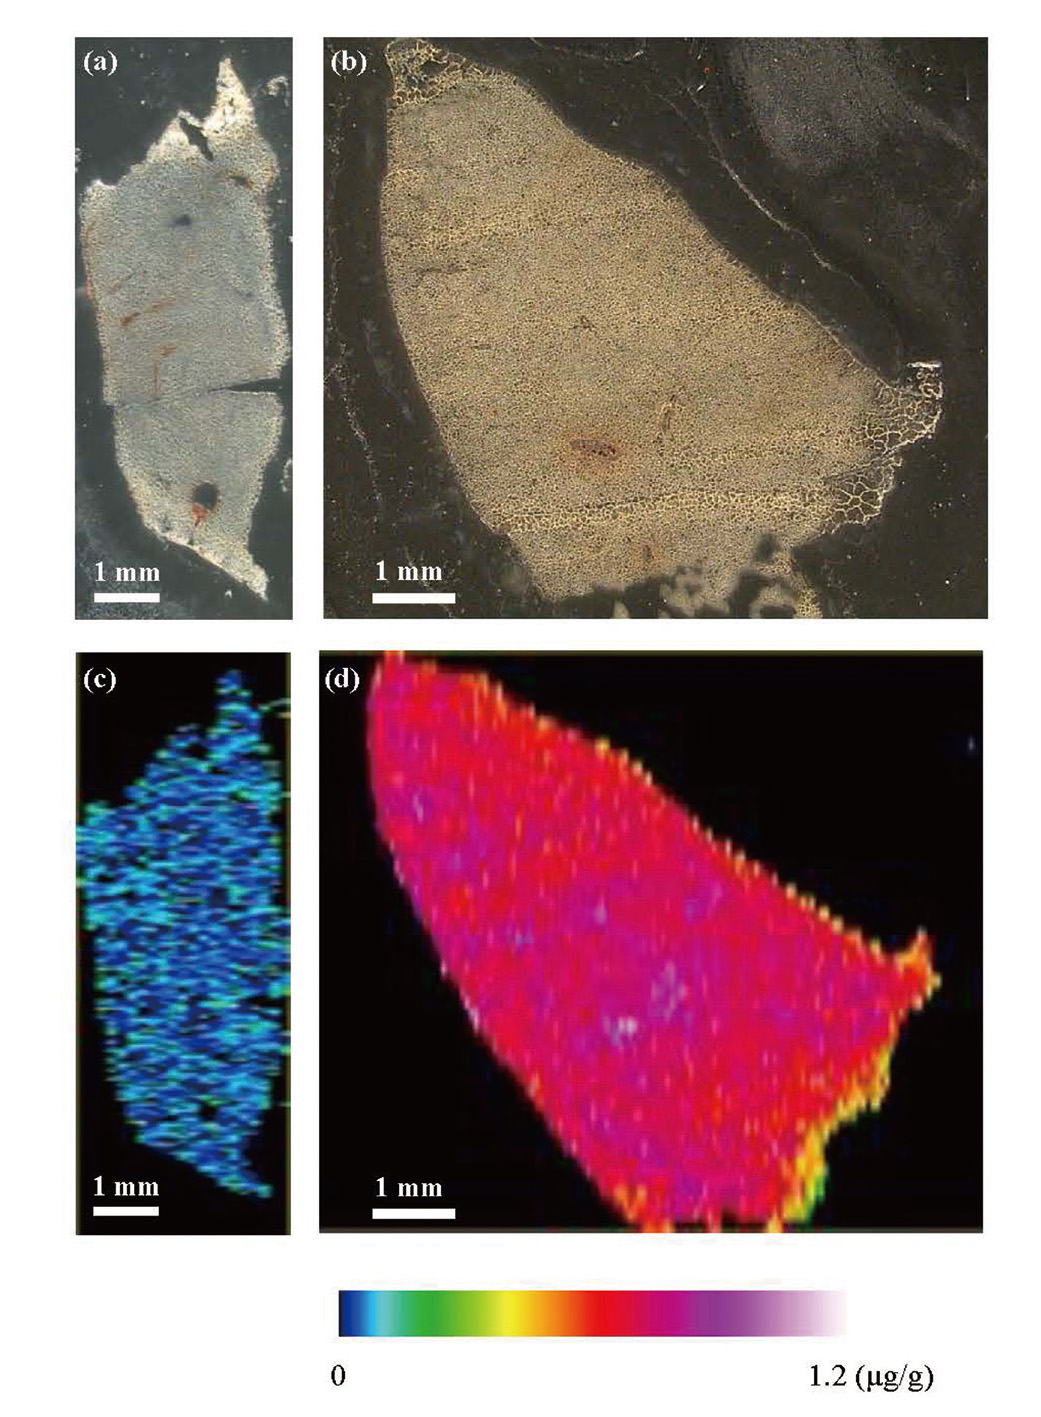
Table 2. Comparison of Hg concentration in rat liver obtained by AAS and LA-ICP-MS.
| (µg/g) |
AAS |
LA-ICP-MS |
| Control |
0.00656 |
± |
0.00051 |
|
- |
|
| MeHg-exposed |
0.605 |
± |
0.062 |
0.595 |
± |
0.11 |
The Hg distribution images of the kidney exposed to saline or MeHg are shown together with photomicrographs (Fig. 3). The photomicrographs in Fig. 3(a) and (b) showed no difference between the control and MeHg-exposed rats. Hg in the kidney was mainly enriched in the renal cortex and the outer medulla, as shown in Fig. 3(c) and (d). This coincides with the fact that MeHg was reabsorbed by the proximal tubule of kidney and was bound to thiol groups in proximal tubule cells (Zalups, 2000). The results of Hg concentration determination by AAS and the average of the cumulative values of Hg concentration obtained by LA-ICP-MS are shown in Table 3. AAS measurements of Hg concentrations in the kidneys of control and MeHg-exposed rats yielded 0.0598 ± 0.015 and 7.27 ± 0.46 µg/g, respectively. Contrary to AAS, LA-ICP-MS measurement of Hg concentration in the kidney of MeHg-exposed rat gave 7.84 ± 0.57 µg/g. The difference between bulk concentration value determined by AAS and the average Hg concentration pixel data obtained by LA-ICP-MS was -7.84%, and this difference was less than 13.6% of the relative standard deviation (RSD) of Hg content in the Hg standard (Fig. 1). These results validated the quantitative analysis by LA-ICP-MS. Consequently, LA-ICP-MS made quantitative imaging possible with the use of appropriate standards.

Table 3. Comparison of Hg concentration in rat kidney obtained by AAS and LA-ICP-MS.
| (µg/g) |
AAS |
LA-ICP-MS |
| Control |
0.0598 |
± |
0.015 |
|
- |
|
| MeHg-exposed |
7.27 |
± |
0.46 |
7.84 |
± |
0.57 |
In conclusion, we developed a method that employs LA-ICP-MS for the analysis of local Hg concentration by using Hg standards and rat liver as organ matrix. The prepared standard met the qualification for quantitative analysis in terms of homogeneous Hg distribution and high linearity between concentration and signal intensity.
The use of LA-ICP-MS and our standards offer several advantages over the conventional method, including use of a small amount of sample and short data acquisition time. The technique developed in this study is expected to lead to a more detailed understanding of the Hg behavior in living organisms.
ACKNOWLEDGMENTS
This study was supported by JSPS KAKENHI Grant Numbers 18H03380, 19H01081, 19K16346, and 19H05772.
Conflict of interest
The authors declare that there is no conflict of interest.
REFERENCES
- Ash, R.D. and He, M. (2018): Details of a thallium poisoning case revealed by single hair analysis using laser ablation inductively coupled plasma mass spectrometry. Forensic Sci. Int., 292, 224-231.
- Clarkson, T.W., Vyas, J.B. and Ballatori, N. (2007): Mechanisms of mercury disposition in the body. Am. J. Ind. Med., 50, 757-764.
- Eto, K. (1997): Pathology of Minamata disease. Toxicol. Pathol., 25, 614-623.
- Fernandes Azevedo, B., Barros Furieri, L., Peçanha, F.M., Wiggers, G.A., Frizera Vassallo, P., Ronacher Simões, M., Fiorim, J., Rossi de Batista, P., Fioresi, M., Rossoni, L., Stefanon, I., Alonso, M.J., Salaices, M. and Valentim Vassallo, D. (2012): Toxic effects of mercury on the cardiovascular and central nervous systems. J. Biomed. Biotechnol., 2012, 949048.
- Hachmöller, O., Aichler, M., Schwamborn, K., Lutz, L., Werner, M., Sperling, M., Walch, A. and Karst, U. (2016): Element bioimaging of liver needle biopsy specimens from patients with Wilson’s disease by laser ablation-inductively coupled plasma-mass spectrometry. J. Trace Elem. Med. Biol., 35, 97-102.
- Hare, D., Austin, C., Doble, P. and Arora, M. (2011): Elemental bio-imaging of trace elements in teeth using laser ablation-inductively coupled plasma-mass spectrometry. J. Dent., 39, 397-403.
- O’Meara, J.M., Börjesson, J. and Chettle, D.R. (2000): Improving the in vivo X-ray fluorescence (XRF) measurement of renal mercury. Appl. Radiat. Isot., 53, 639-646.
- Pessôa, G.S., Lopes Júnior, C.A., Madrid, K.C. and Arruda, M.A. (2017): A quantitative approach for Cd, Cu, Fe and Mn through laser ablation imaging for evaluating the translocation and accumulation of metals in sunflower seeds. Talanta, 167, 317-324.
- Pozebon, D., Dressler, V.L., Matusch, A. and Becker, J.S. (2008): Monitoring of platinum in a single hair by laser ablation inductively coupled plasma mass spectrometry (LA-ICP-MS) after cisplatin treatment for cancer. Int. J. Mass Spectrom., 272, 57-62.
- Stoltenberg, M., Larsen, A., Kemp, K., Bloch, D. and Weihe, P. (2003): Autometallographic tracing of mercury in pilot whale tissues in the Faroe Islands. Int. J. Circumpolar Health, 62, 182-189.
- Suzuki, T., Sakata, S., Makino, Y., Obayashi, H., Ohara, S., Hattori, K. and Hirata, T. (2018): iQuant2: Software for Rapid and Quantitative Imaging Using Laser Ablation-ICP Mass Spectrometry. Mass Spectrom. (Tokyo), 7, A0065.
- Trzeciakowski, J.P., Gardiner, L. and Parrish, A.R. (2014): Effects of environmental levels of cadmium, lead and mercury on human renal function evaluated by structural equation modeling. Toxicol. Lett., 228, 34-41.
- Zalups, R.K. (2000): Molecular interactions with mercury in the kidney. Pharmacol. Rev., 52, 113-143.