1. Introduction
Modern micro- and nanoparticle systems are key to advancements in various applications including additive manufacturing (Ngo et al., 2018; Ligon et al., 2017), printable electronics (Kim D. and Moon, 2005), solar cells (Kim S.S. et al., 2008), fuel cells (Chan K.Y. et al., 2004), batteries (Wessells et al., 2012), medical applications (Murthy, 2007) and biomedical sensors (Polavarapu and Liz-Marzán, 2013). Functional particle systems are widely applied in many different fields because of their wide range of tunable physical properties. This rich behavior is the direct result of the five-dimensional parameter space that is defined by particle size, shape, surface, structure, and composition. The relationship between particle properties and the dispersity is known as property function and was first coined by (Rumpf, 1967)
|
Property
=
f
(
dispersity
) | (1) |
where the dispersity includes particle size, shape, surface, structure in terms of inner porosity, crystalline or amorphous phases and composition as well as their respective distributions. Examples for the manifold realizations of multidimensional (nD) particle systems are provided in Table 1 and are highlighted in Fig. 1. The particle size ranges from about one nanometer for quantum dots up to several tens of centimeters for mineral particles. With the advent of nanoparticle technology, also particle shape came into focus. Prominent examples are plasmonic nanoparticles, where the shape influences the number and the position of the plasmonic resonance peaks (Yu R. et al., 2017). Below particle sizes of a few microns, particle surfaces become increasingly important. The ratio of van der Waals attraction between two spherical particles and particle weight scales with the inverse diameter squared, i.e. the dispersive particle interactions are orders of magnitude larger than the particle weight. Moreover, surface functionalization by molecules or small nanoparticles can be used to tailor particle-particle interactions and adhesion forces (Soto-Cantu et al., 2012; Giesbers et al., 2002). Core-shell structures are used for controlled release in life sciences or to enhance chemical stability.
Table 1
Application examples of micro- and nanoparticle systems with multidimensional property distributions beyond size.
| Disperse property |
Application example |
| Shape |
Plasmonic metal NPs a, nanorods b, platelets a |
| 2D materials, e.g. graphene c, BN d, MoS2 e |
| Semiconducting NPs, e.g. nanorods f, tetrapods g |
| Surface |
Control of surface energy h, Hydrophilic-lipophilic balance i |
| Roughness for controlled adhesion and powder flow j |
| Surface chemistry for controlled reactivity k |
| Charge for controlled colloidal stability l |
| Toner size-charge (see E-SPART analyzer) m |
| Core-shell microparticles, e.g. controlled release in life sciences n |
| Core-shell semiconducting nanoparticles, e.g. CdSe@ZnS o |
| Structure |
Amorphous vs crystalline particles p |
| Polymorphic forms in pharmacy q |
| Controlled pore size, e.g. in MOFs r, zeolitess or pore size distributions, e.g. adsorbents such as activated carbon t, CO2-absorbers u |
| Magnetic properties v |
| Complex compositions |
Minerals w |
| Semiconducting NPs, e.g. CIS x, CZTS y |
| Electrode materials, e.g. hybrid NPs z, catalyst particles aa |

The internal structure is most important for porous systems such as activated carbon, zeolites or metal-organic frameworks (MOF) (Holst and Cooper, 2010; Wang T.C. et al., 2015; Hu Z. and Srinivasan, 2001). Also, particles, which are composed of several crystalline or amorphous phases, belong to that group. Minerals but also advanced semiconducting particles (e.g. CIS, CTZS, battery materials or active catalysts) often have a rich phase behavior (Hochella et al., 2008). Little is known if and how it depends on size. At the lower nanoscale, even the phase behavior of less intricate materials such as alumina (Sun J. and Simon, 2007) or CdS is size-dependent (Neeleshwar et al., 2005; Eom et al., 2013).
In order to study these complex phenomena, various nano- and microparticle systems have to be characterized with respect to structural (via the dispersity) and functional properties. Examples depending on the five-dimensional parameter space are highlighted in Table 2.
Table 2
Multi-dimensional particle properties for technological and functional properties.
| Technological properties |
Transport properties: size, density, shape a |
| Powder flow: surface, size, shape, structure b |
| Packing characteristics: size, shape, structure c |
| Colloidal stability: size, shape, composition d |
| Functional properties |
Mechanical properties: size, structure, composition e |
| Optical properties: size, shape, structure, composition f |
| Electronic and magnetic properties: size, shape, structure, composition, surface g |
| Chemical properties: surface, structure, composition h |
| Sensory properties, e.g. taste: size, composition, structure i |
| Thermodynamic properties, e.g. solubility, melting, sintering: size, surface, composition j |
Characterization tools provide single mean or distributed parameters like the volume-equivalent, the hydrodynamic or the sedimentation-equivalent diameter (Modena et al., 2019). With increasing complexity in terms of nD particle parameters it becomes more and more difficult to interpret direct measurement results. Different combinations of dispersed particle properties can lead to the same value of a measured quantity, e.g. the volume of a particle. Combining results from different measurement techniques or using experimental setups, which are sensitive to nD properties directly, are therefore required in order to gain more information on complex particle systems.
The objective of this review is to provide an overview of past and current developments concerning the multidimensional characterization of particles. In a few recent cases, two-dimensional (2D) information was obtained from one single experiment as will be highlighted in this review. First, a thorough mathematical description of multidimensional particle ensembles will be provided. Comparability of measurement results from different techniques can be achieved by taking different weightings into account. The derivation of one-dimensional (1D) distributions from multidimensional distributions is always possible while the reverse case, i.e. the derivation of multidimensional distributions from 1D ones, is an ill-posed problem. Based on this theoretical background, the focus of the review lies on experimental procedures. Therefore, comprehensive techniques based on microscopic imaging and characterization methods for gas phase and liquid phase analysis are reviewed and critically discussed with respect to their potential for nD particle characterization.
2. Multidimensional particle size distributions
As the properties of nano- and micron-sized particles are typically distributed, mathematical tools for property distributions require a comprehensive description. Most often the size of particles is the key parameter, as many properties of particulate products are influenced by their size distribution. Only for spherical particles, the size can be described by using a single parameter, i.e. the diameter. In the general case, particle size of an irregular particle is understood in terms of an equivalent size, such as the diameter of a sphere of equal volume, equal surface or equal hydrodynamic transport behavior. To date, disperse particle systems are mostly characterized by one-dimensional (1D) particle size distributions (PSDs), which were comprehensively described by Rumpf and Leschonski (Leschonski K. et al., 1974a; 1974b). This concept has proven to be very useful for rather simple particle systems but must be expanded for the description of more complex particle systems. One general difficulty is that different particle parameter sets can lead to the same equivalent diameter, e.g. different diameter and length combinations of a rod-like particle result in the same volume-equivalent diameter. Therefore, a nD description of complex particle ensembles is required. In general, nD PSDs are defined as (Frank U. et al., 2019)
|
q
r
(
x
→
)
=
Amount of kind
r
in interval d
x
→
interval size d
x
→
*
total amount of kind
r | (2) |
with the nD PSD qr of the random vector
x→∈ℝn.
The distribution qr fulfils several requirements, it is non-negative, integrable and normalized. The index r is related to the weighting of the PSD. Depending on the measurement technique, PSDs are differently weighted, based on the underlying physical measurement principles, e.g. counting (r = 0) or weighing, (r = 3). If not taken into account, the weighting introduces comparability issues between different measurement techniques (Modena et al., 2019). In the 1D scenario, it is very convenient to convert differently weighted PSDs into each other, e.g. from kind k to kind r (Leschonski K. et al., 1974a; 1974b)
|
q
r
(
x
)
=
x
r
-
k
q
k
(
x
)
M
r
-
k
,
k | (3) |
with the moment
M
r
-
k
,
k
=
∫
x
min
x
max
x
r
-
k
q
k
(
x
)
d
x, which is calculated by integration from the minimum xmin to the maximum particle size xmax. Of course, the situation is more complicated in the nD case. Here, weighting functions need to be considered and the notation is slightly adapted (Frank U. et al., 2019)
|
q
r
(
x
→
)
=
q
k
(
x
→
)
κ
(
x
→
)
M
r
,
k | (4) |
with the weighting function κ, which maps the random vector x→ to a positive scalar. An intuitive example is the volume of a regular, non-spherical particle (e.g. a rod or platelet), which is calculated from the particle geometry parameters of length and diameter. The denominator is defined as generalized moment
Mr,k=∫x→∈ℝnqkx→κx→dnx
. A simple example for a 2D PSD alongside the extraction of 1D distributions of linked variables is presented in the following paragraphs.
2.1 Two-dimensional particle size distributions
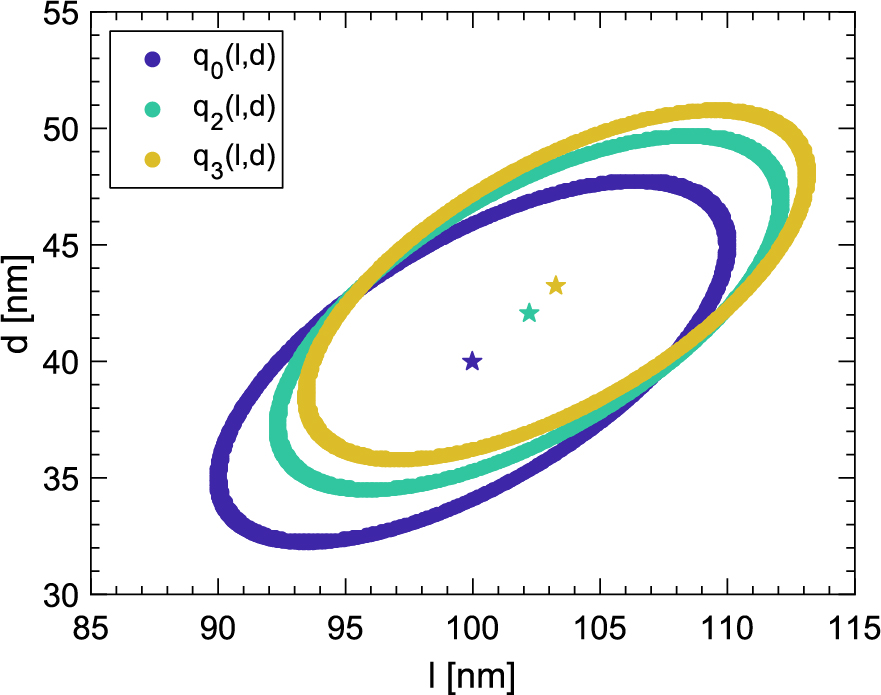
The concept of 2D PSDs was recently illustrated for the example of normal-distributed gold nanorods, which are characterized by their length l and diameter d (Frank U. et al., 2019), and is recapped here for an intuitive way of understanding multidimensional distributions. Similar conclusions and relations hold true for the case of a 2D log-normal distribution with two log-scaled axis.
To demonstrate the influence of different weightings, the surface weighted q2 and volume weighted q3 distributions were calculated from the number-weighted PSD q0 via Eq. 4. Here κ is replaced with functions for the surface and volume
|
S
(
d
,
l
)
=
1
2
π
d
2
+
π
d
l | (5) |
|
V
(
l
,
d
)
=
π
4
d
2
l | (6) |
A comparison of the obtained distributions can be found in Fig. 2. The function maximum is depicted with a star alongside an isoline, which illustrates the shape of the distribution. A significant shift within the distributions is clearly visible and stresses the importance of the different weightings. The stars indicate the modal values, which shift from finer to coarser values for the length and diameter.
2.2 Calculation of one-dimensional data from two-dimensional particle size distributions
With the 2D PSDs at hand, it is possible to calculate respective 1D distributions. This can be performed either via marginalization or via the calculation of a linked variable. Marginalization is the simpler case. Here one can calculate the distributions for length and diameter simply by integration with respect to the complementary variable, e.g.
|
q
0
(
l
)
=
∫
d
min
d
max
q
0
(
l
,
d
)
d
d | (7) |
The more general case is to obtain r weighted 1D distributions ρ of a linked variable y, like sedimentation coefficient, aspect ratio or volume. This can be achieved via conditional integration to obtain the cumulative distribution function (CDF) and subsequent derivation
|
ρ
(
y
)
=
d
d
y
∫
{
x
→
∈
ℝ
n
∣
f
(
x
→
)
≤
y
}
q
r
(
x
→
)
d
n
x | (8) |
with the mapping function
x→.
Applied to the 2D case of the aspect ratio ν of a rod-like particle, which is defined as the ratio of length to diameter ν = l/d, one obtains
|
ρ
(
v
)
=
d
d
v
∬
{
l
,
d
∣
1
d
≤
v
}
q
0
(
l
,
d
)
d
l
d
d
=
d
d
v
∫
d
min
d
max
∫
l
min
d
·
v
q
0
(
l
,
d
)
d
l
d
d | (9) |
This can be interpreted as calculation of a cumulative distribution of the aspect ratio with subsequent derivation, which is illustrated in Fig. 3. The calculation of other distributions can be performed analogously. This procedure enables the calculation of various quantities from 2D nanoparticle property distributions.
Furthermore, 1D weight-dependent expected values (weight averages) Er can be computed from the 1D distributions via evaluation of the integral
|
E
r
(
y
)
=
∫
ℝ
y
ρ
(
y
)
d
y
=
∫
ℝ
y
(
d
d
y
∫
{
x
→
∈
ℝ
n
∣
f
(
x
→
)
≤
y
}
q
r
(
x
→
)
d
n
x
)
d
y | (10) |
Applied to the example above, one can obtain the number-weighted mean aspect ratio via
|
E
0
(
v
)
=
∫
ℝ
v
ρ
(
v
)
d
v
=
∫
ℝ
v
(
d
d
v
∫
d
min
d
max
∫
l
min
d
·
v
q
0
(
l
,
d
)
d
l
d
d
)
d
v | (11) |
Equivalent calculations for other physical quantities, e.g. mean sedimentation coefficient, mean mobility diameter etc. are possible.
In summary, this section provided a detailed overview of the current state-of-the-art for the mathematical handling of nD particle property distributions. However, their experimental retrieval is a quite challenging task. Recent progress in novel experimental approaches allows the determination of higher dimensional property functions. In the following sections, we will present some of the most relevant characterization methods and briefly recap their underlying physical principle and the respective results.
3. Image analysis and microscopy
Manifold different analytical techniques exist to directly image particles. The underlying principles used for image characterization of samples vary across the length scales of the material systems under investigation. Apart from the multidimensional characterization in terms of geometry, other complementary techniques based on spectral or electronic characterization are used to retrieve correlations of certain physical properties like the size and chemical composition of particles. While it is possible to acquire detailed data on the single particle level, statistically reliable characterization of particle ensembles requires a significant number of measured particles. In the case of 1D properties, usually hundreds to thousands of particles are analyzed (Rice et al., 2013; Nacken T.J. et al., 2015; Verleysen et al., 2019). Estimations for sufficient particle numbers exist, see e.g. (Stieß, 1995). For instance, the determination of the median particle size within +/− 3 % accuracy and a confidence interval of 95 % requires counting of close to 5000 particles, counting only 400 particles leads an accuracy of only 10 %. For the determination of nD PSDs, the number of particles that need to be investigated must be even higher to avoid obtaining data of limited accuracy and reliability. Many publications using image based characterization are clearly below these numbers, even though software-based image analysis can help reducing the temporal effort of acquiring particle size and shape information (Verleysen et al., 2019; Frei and Kruis F.E., 2020).
Furthermore, microscopic techniques require careful sample preparation from the gas or liquid phase to separate individual particles on a substrate. Sampling can lead to various artefacts and systematic errors by size-selective deposition, drying or agglomeration.
3.1 Light microscopy
Imaging single particles (reasonably larger than the wavelength) with light enables determining their 2D projection on a substrate or directly in sufficiently dilute and thus optically transparent flowing systems. Particles on a substrate typically lie in their stable position while particles imaged in a flowing gas or liquid can be viewed from different projections. Analysis on-the-fly is excellent to image a very high numbers of particles to enhance the statistical reliability of such measurements. Image analysis of projected areas of particles in flow cells has been applied in order to retrieve nD information on particle properties (Bujak and Bottlinger, 2008). More details on the concepts of flow cells can be found in Section 5.1. Recently, a novel omics-like method has been proposed collecting images of > 2,000,000 particles (of several 10 μm in size) per sample in sediments, soils and dusts by a Sympatec GmbH QICPIC particle size and shape analyzer. The morphological descriptors of each particle including equivalent diameter, sphericity, aspect ratio and convexity were extracted as the “particle morphome”, an outcome of the large data set (Sun Y. et al., 2019).
Furthermore, light microscopy is often used as a prior step to find a valid measurement position in spectroscopy applications like Raman or fluorescence spectroscopy. The combination of these techniques is rather common and therefore not subject of this review.
Raman spectroscopy itself can be a valuable tool for the analysis of the composition of a sample or the identification of polymorphs of e.g. organic crystals in pharmaceutical applications. A current trend in energy conversion and storage is towards particles consisting of three (e.g. chalcogenide such as CuInS2), four (kesterites such as Cu2InZnS4) or even multinary components. The same holds true for complex catalyst or advanced battery materials. A particular challenge during synthesis is the formation and identification of binary, ternary or quaternary by-products (see e.g. (Ahmad et al., 2017)). Statistical composition mapping via Raman spectroscopy, supported by atomic force microscopy (AFM) co-localization, is very promising to study size-dependent composition in such particulate products (Nacken T. et al., 2015).
The limitations of using solely light microscopy in terms of particle projections can be overcome via the use of digital holography (DH), which allows determining the three-dimensional (3D) structure of micron-sized particles. DH is based on interferometric imaging. As shown in Fig. 4, interference patterns between diffracted light from the object and a reference wave are formed. Sophisticated image analysis allows to reconstruct intensity and phase images, which can be transformed to yield 3D information (Tahara et al., 2018).

The resolution of light-based microscopes is physically restricted by the Abbe diffraction limit, which hinders single particle investigations of nano-sized objects by conventional light microscopy (Siedentopf and Zsigmondy, 1902). The advent of super-resolution microscopy enhanced the measurement range for fluorescent labelled samples. The combination of other techniques with super-resolution microscopy is possible, although most applications are focusing on biological samples (Hauser M. et al., 2017). An example for the use of super-resolution microscopy for particle characterization is the determination of the particle geometry of anisotropic plasmonic particles. The single emission of the fluorophores that are attached to the particle can be utilized to determine the shape and size of the particle, as shown in Fig. 4. However, care needs to be taken to avoid localization errors due to the interaction of the fluorophore with the substrate or due to a changing dielectric environment (Willets et al., 2017).
3.2 Computed tomography
Using illumination sources with smaller wavelengths (electrons, X-rays, neutrons) considerably improves the resolution. The spatial resolution of X-ray computed tomography (X-ray CT) can reach below 100 nm (Maire and Withers, 2014) depending on the light source. Recently, Leißner et al. reviewed the application of X-ray CT in the field of particle technology (Leißner T. et al., 2020). The technique relies on the spatially resolved detection of the X-ray transmission of a sample. The 3D structure of an immobilized sample can be reconstructed from the detection of projections from different directions. Individual X-ray attenuations are assigned as grey values to volume elements. These depend on the material density and the average atomic number, which allows to distinguish between different materials but may also exclude certain materials or material combinations from thorough analysis due to similarities or - in contrast - large differences in grey values (Leißner et al., 2020; Ketcham and Carlson, 2001). This limitation can be overcome with higher experimental effort, by e.g. taking into account the energy- and material-specific attenuation of X-rays via hyperspectral X-ray tomography (Egan et al., 2015). Stochastic modelling of nD particle properties can further help to identify different material classes from a X-ray CT experiment (Furat et al., 2019). Correlations between particle composition and characteristic particle properties like volume, sphericity or the median grey value can be used to identify the 3D structure and material classes from an X-ray CT experiment. Therefore, the authors calibrated their stochastic model via scanning electron microscopy (SEM) – energy-dispersive X-ray (EDX) measurements (see Section 3.4). Particle characterization of e.g. crystals via X-ray tomography can be improved by utilizing models of particle shape. The identification of the crystal’s face normals offers thus interesting options for the robust evaluation of size- and shape distributions (Kovačević et al., 2014).
3.3 Atomic force microscopy
Atomic force microscopy (AFM) is a surface sensitive technique based on tracking the oscillation and the position of a cantilever equipped with a nano-sized tip close to the surface under investigation (Binnig et al., 1986). Various measurement modes exist, which not only allow the determination of the geometry of anisotropic particles via evaluation of the sample topography but also provide information on surface roughness or mechanical properties and adhesion forces (Voigtländer, 2019).
The combination of AFM with other techniques denoted as “Hybrid-AFM” provides access to additional information. Heating the sample at the measurement spot via an infrared light beam of a defined wavelength and measuring the heat-induced change in oscillation behavior of the cantilever enables measuring spectrally resolved infrared (IR) absorption. This way, correlating the chemical composition with topographic information is possible (Fu W. and Zhang W., 2017; Dazzi and Prater, 2017). Similar information can be obtained via a combination of Raman spectroscopy and AFM (Fu W. and Zhang W., 2017). For the example of the 2D material graphene, both techniques are complementary. While the lateral geometry of graphene sheets is easily accessible by AFM, the measured height of the sheets may be influenced by adsorbates at the surface. Using complementary Raman spectroscopy allows accurately determining the number of sheets (up to 5 layers) and their defect states (Eigler et al., 2014; Nacken T. et al., 2015). As the signals of both techniques are evaluated at the same sample position by co-localization, true multidimensional property distributions in terms of lateral sheet size and number of graphene sheets (thickness) can be acquired. This technique thus enables process optimization of the production of 2D materials (Halbig et al., 2016)
3.4 Electron microscopy
Scanning electron microscopy (SEM) and transmission electron microscopy (TEM) rely on the interaction of probing electrons with the sample. Typically, topographic or transmission images are used to determine the size and geometrical anisotropy of individual particles. Characterizing a significantly large number of particles allows obtaining the 2D length and diameter distributions of particles, see e.g. (Murphy et al., 2017; Elazzouzi-Hafraoui et al., 2008). However, the number of counted particles is often too small for a reliable statistical analysis. In other words, information on 2D distributions have to be taken with great care due to the underlying scatter of data.
The detection of secondary or backscattered electrons provides information on topography and composition. As for other microscopy-based techniques, the combination of imaging techniques with additional characterization methods can further enlarge the multidimensional dataset. SEM-based mineral liberation analysis can be used to determine the projected 2D area of a mineral via SEM, while complementary EDX measurements allow the characterization of the composition at the measurement position (Fandrich et al., 2007). From the overlay of 2D EDX and SEM images, equivalent circle diameters of particles can be calculated together with their densities from the individual specific mineral densities and EDX based area fractions. As a result 2D size and density distribution can be obtained, which allows analyzing e.g. separation processes in detail (Schach et al., 2019).
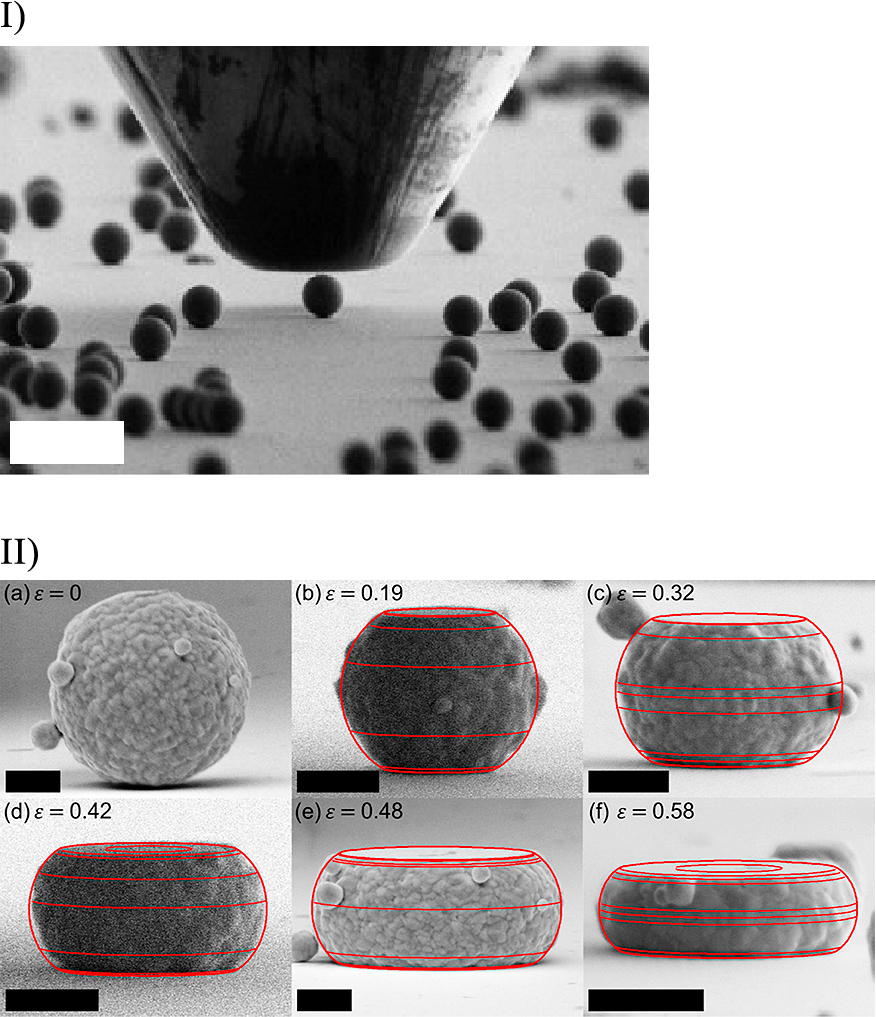
Furthermore, mechanical particle properties can be determined by mechanical testing directly in the SEM by nano-compression. The set-up described in (Romeis S. et al., 2012) allows to test several hundred particles for statistically reliable analysis (see Fig. 5 I). Elastic and inelastic deformation of carefully deposited individual particles allows to determine distributions of Young’s modulus, yield stress, hardness, energy absorption or strain at the onset of the crack formation. All these quantities can be investigated depending on size. Additionally, the influence of further size-dependent properties such as the brittle-ductile transition of glass particles, different compositions or internal structures can be studied (Paul J. et al., 2015b). Furthermore, quantitative shape analysis is possible as highlighted in Fig. 5 II, which shows gold particles of 1 μm in diameter for various states of compression and particle shapes obtained from finite-element-method (FEM) simulation.
TEM uses higher energetic electrons than SEM enabling the spatial material transmission (Fultz and Howe, 2008) and provides thus access to the local particle structure. The 2D characterization of particles can be extended to three dimensions by applying 3D tomography (Miao et al., 2016; Song H. et al., 2019). This method relies on tilt series of TEM images obtained after careful sample preparation (Przybilla T. et al., 2018) as shown in Fig. 6 I or on TEM images from freely rotating particles in a graphene based liquid cell (Park J. et al., 2015). The obtained images are used to reconstruct the 3D morphology including the inner structure (Park J. et al., 2015), the inner porosity (Distaso M. et al., 2017) or the exact position of any primary particle in self-assembled supraparticles (Wang J. et al., 2018) as shown in Fig. 6 II. Therefore, this technique enables obtaining vast information on the single particle level. Various other measurement techniques such as energy-filtered TEM imaging, high resolution TEM imaging or diffraction based modes, which allow chemical or structural analysis, are available, but are beyond the scope of this review (Fultz and Howe, 2008).

4. Gas phase measurements
In the following section, basic principles of multidimensional particle characterization in aerosols are presented. Moreover, recent results for the determination of full 2D mass-mobility distributions and additional 1D distributions extracted from this data set are discussed.
An excellent possibility to analyze multidimensional particle properties in a gaseous environment is the coupling of different measurement devices like the differential mobility analyzer (DMA) with a subsequent measurement device. Examples are the combination of a DMA with a low pressure impactor to obtain radius and mass simultaneously (Schleicher et al., 1995), the simultaneous measurement of mass, surface and mobility diameter of silver agglomerates via coupling of DMA, inductively coupled plasma atomic emission spectrometry (ICP-AES), epiphaniometer (EPI) and condensation particle counter (CPC) (Weber A.P. et al., 1991).
4.1 DMA and low-pressure impactor
One of the earlier works on the retrieval of 2D property distributions from aerosol measurements was carried out by Schleicher et al. The simultaneous determination of size and density for submicron aerosol particles was demonstrated for metal nanoparticles (Pd, Ag, Co), carbon particles, oil droplets and oil burner exhaust (Schleicher et al., 1995).
The measurement itself is a two-step process. First a particle fraction with a certain electrical mobility is selected in a DMA, afterwards a low-pressure impactor classifies the particles according to inertia. The combination of those two devices allows to determine the particle density and mobility diameter of single particles. Prior to the DMA, the particle surface charge needs to be brought to charge equilibrium via a 63Ni β− radioactive source. The applied electrical field in the DMA leads to the separation of a mobility-selected particle fraction, which enters the low-pressure impactor. The particle properties in the gas stream can be estimated by a critical Stokes number. After calibration of the two devices, the density for a previously mobility-selected particle regime is detected. It is possible to gain even more information by using a further classifying step with a subsequent scanning measurement device for particle counting.
4.2 Tandem differential mobility analyzer
In tandem DMA systems, two DMAs are used in series, whereby the properties of the particles exiting the first DMA are manipulated before entering the second DMA. Tandem DMA setups are used at least since the 1980’s for aerosol particle analysis. Depending on the type of manipulation performed on the particles that exit the first DMA, different properties of the particles can be derived from the second mobility analysis. One prominent type of manipulation is heating of the aerosol. Heating allows to determine the volume of metal particle aggregates by sintering the aggregates to a spherical shape or removal of organic material from particles which reveals properties on particle chemical composition (Shin W.G. et al., 2010; Tsai D.-H. et al., 2013).
The second prominent type of manipulation is the exposure of the particles to a different gas atmosphere that interacts with the particles either in form of condensation or chemical reactions (Wu et al., 2013; McMurry et al., 1983). Such gas phase manipulations reveal the fraction of hygroscopic particle material or the acidic material fraction, respectively.
4.3 Atmospheric-pressure ion mobility mass spectroscopy (IM-MS)
The outlined techniques in this section are related to ion mobility mass spectroscopy approaches, which consist generally of a two stage separation process. In the first step ions or particles are separated according to electrical mobility, while in the second step separation occurs according to the mass to charge ratio.
The development of atmospheric pressure mass analysis (APM) added a strong analytical tool for the analysis of aerosols (Ehara et al., 1996). The combination of a DMA and an APM is capable to attribute (effective) densities to particles as shown by McMurry for discrete particle sizes classified by the DMA (McMurry et al., 2002).
Pratsinis and co-workers analyzed nanoparticle agglomerates of silica in a diffusion flame. Upon leaving the flame, the agglomerates were classified with a DMA and their mass was measured with an APM resulting in their mass fractal dimension and dynamic shape factor while SEM/TEM images were used to determine primary particle diameters and agglomerate morphology. This combination was used to study the effects of flame process variables on particle characteristics in-depth (Scheckman et al., 2009).
Hogan et al. employed the DMA-APM combination to measure well resolved 2D size-density distributions. In their most recent publication (Li C. et al., 2020) it was demonstrated how a full 2D size-mass distribution can be obtained by ion mobility mass spectrometry and how 1D distributions can be derived from these datasets. The method was applied to several standard particles, i.e. polystyrene, latex and silica nanoparticles and porous mesostructured silica. In their setup, the aerosol is classified in a DMA according to the electrophoretic mobility. Subsequently, the particles are analyzed via an APM and condensation particle counter (CPC). This combination leads to a full 2D size-mass distribution function
∂
2
n
∂
d
p
∂
m
p, with particle diameter dp and mass mp. Notably, this quantity cannot be measured directly but was obtained via the system transfer function and data inversion algorithms (Li C. et al., 2020). The schematic setup is shown in Fig. 7 along with the 2D mass-diameter function, additional 1D data can be obtained from this 2D function.

For structural characterization of even smaller species, DMA classification can be combined with conventional mass spectrometry. Based on molecular dynamics (MD) simulations it is possible to attribute particle shapes to cluster ions (Ouyang et al., 2013). The observation of structural changes in molecular conformation is beautifully demonstrated on electrosprayed PEG, see e.g. Fig. 8, which is found in the gas phase in different - though very defined - levels of deconvolution (Larriba et al., 2014; Larriba and Fernandez de la Mora, 2012). These results show that the lower limit of the combined DMA-mass analysis is at the molecular level. Such analysis is though limited to narrow distributions of shape for each observed species. With broader shape distributions, different charge states, in which a species is observed, become indistinguishable

Beside the characterization of the mass of particles, access to the elemental composition of large particles is investigated since many years based on particle evaporation by either laser pulses or inductively coupled plasmas and mass analysis of the generated ions. A summary of such approaches that intend to reveal chemical compositions of particles is found in (Noble and Prather, 2000). While ICP ionization was quite rare in early setups for single particle mass spectrometry, this technology is on its way to a routine analysis today (Montaño et al., 2016). The access to particle morphology and composition has been shown using coherent X-ray radiation from a free electron laser for particle imaging and as ionization source (Loh et al., 2012).
4.4 Optical measurements
A cooperation between several universities and industrial partners in Germany demonstrated the benefits of multiparameter characterization approaches in the gas phase. Therefore, three new devices have been developed (Babick et al., 2018), which facilitate or support multidimensional characterization of aerosols and are principally suited for quasi-real-time measurements in technical processes. These systems probe the optical scattering pattern of single particles (laser light scattering in 3D, 3D-LSS) and aerosols (wide angle light scattering, WALS) or determine the aerodynamic diameter (or Stokes diameter) of finely resolved aerosol fractions (differential aerodynamic particle sizer, DAPS). The systems allow for a simultaneous determination of particle size and shape (WALS, 3D-LSS) or facilitate the rapid multiparameter characterization by combined analysis with other techniques, e.g., DAPS and differential electric mobility analysis (DEMA). For instance, the dynamic shape factor (obtained via e.g. DEMA and DAPS) and the fractal dimension (via WALS) reflect the morphology changes of SiO2 aggregates in a sintering furnace by increasing temperature. The two parameters are not equivalent but provide complementary information on shrinking and loss of fractal structure, respectively. Highly resolved PSDs that refer to different particle properties, i.e. to different equivalent diameters, facilitate the quantification of particle shape.
Two of these devices will briefly be introduced here, namely, the 3D LSS and the WALS device. With the first one it is possible to measure the spatially distributed scattering signal of a single particle. In contrast to most common laser scattering instruments, scattering signals depending on the azimuth angle ϕ are detected too (see Fig. 9), which allows for the measurement of anisotropic nanoparticles (Babick et al., 2018). Possible particle sizes for detection range from 500 nm up to 5 μm.

The second instrument, WALS, depicted in Fig. 10, records scattered light signals over many angles (including forward- and backscattering, but no azimuthal angles) in a scattering plane with high resolution. This setup directly measures the intensity distribution for different angles, which is directly linked to particle size and the structure of agglomerates (Babick et al., 2018). With these developments, the comprehensive multidimensional characterization of aerosol particles can be further improved.
5. Characterization in the liquid phase
The comprehensive multidimensional characterization of nanoparticle ensembles directly in the liquid phase is of outmost importance for understanding the formation of particles and their formulation including colloidal stability of (nano) particles in numerous technical applications. Often, detailed knowledge of the particle property space is required for the determination and optimization of the macroscopic properties of the dispersions. The choice of analytic techniques depends upon the state of the (nano) particles in the dispersion, the particles’ hydrodynamic behavior as well as the functional particle property (e.g. light absorption or emission).
Single particle counting is only possible for particles larger than roughly half a micron. The application of super-resolution microscopy and its combination with other techniques has been outlined in the respective chapter on light microscopy. In the liquid phase, super-resolution microscopy has also been used in order to characterize dispersed particles. One example is the investigation of particle wetting behavior at the oil/water interface depending on the particle geometry: single particles are immersed in water containing a fluorescent dye; the distribution of the dye within the liquid and on the particle surface is determined via super-resolution microscopy (Aloi et al., 2019).
Ensemble techniques are based on ultrasound attenuation, light extinction or emission measurement. Electroacoustic spectroscopy provides access to the particle size distribution and the zeta potential even in opaque dispersions up to 40 vol-% (Dukhin A.S. and Goetz, 1998; Richter et al., 2005). Fractionating techniques like analytical (ultra-)centrifugation (AUC) or field flow fractionation (FFF) require rather dilute systems but yield superior information on the entire particle ensembles.
Most techniques are well-established in literature and have been extensively used in the past. However, their application with respect to multidimensional characterization is still at an early stage although considerable progress was achieved in recent years, examples are given in the following sections.
5.1 Image analysis in the flow
In the first part, we briefly address commercial applications for the characterization of μm-sized particles. There are existing commercial systems from Sympatec GmbH for dynamic imaging techniques targeting particle systems in the liquid phase, namely QICPIC and PICTOS. These can be efficiently used in order to analyze particle sizes up to several tens of millimeters through a flow setup and an automated image analysis algorithm (Sympatec, 2021). Malvern Panalytical Ltd combines image analysis techniques with Raman spectroscopy in order to analyze particle size, shape and chemical composition within one measurement (Malvern, 2021).
Mazotti and coworkers described a method that uses focused beam reflectance measurement in order to measure particle size and shape on a 2D grid (Kempkes et al., 2008). In particular, 2D growth rates are extracted from the measurements (Schorsch et al., 2014). In short, the suspension is illuminated using a xenon-flash lamp. Two images are recorded. The transmission image allows the analysis of the planar view on the particles directly in suspension. The reflection image contains information on the lateral view. For the determination of the nD PSD (i.e. axis length distribution), an automated image analysis algorithm is applied for the sorting of the particles into distinct particle classes. Each pair of projections is analyzed individually in order to extract volumetric information from two orthogonal projections. Examples for the shape classes are spheres (1D, the diameter as the characteristic length), needles (2D, cylinders with length and diameter) and cuboids (3D: length, width, and height). The key of these studies is the accurate extraction of particle dimensions from directly measured and simulated images. A multidimensional PSD can be reconstructed from the data and moments can be computed.
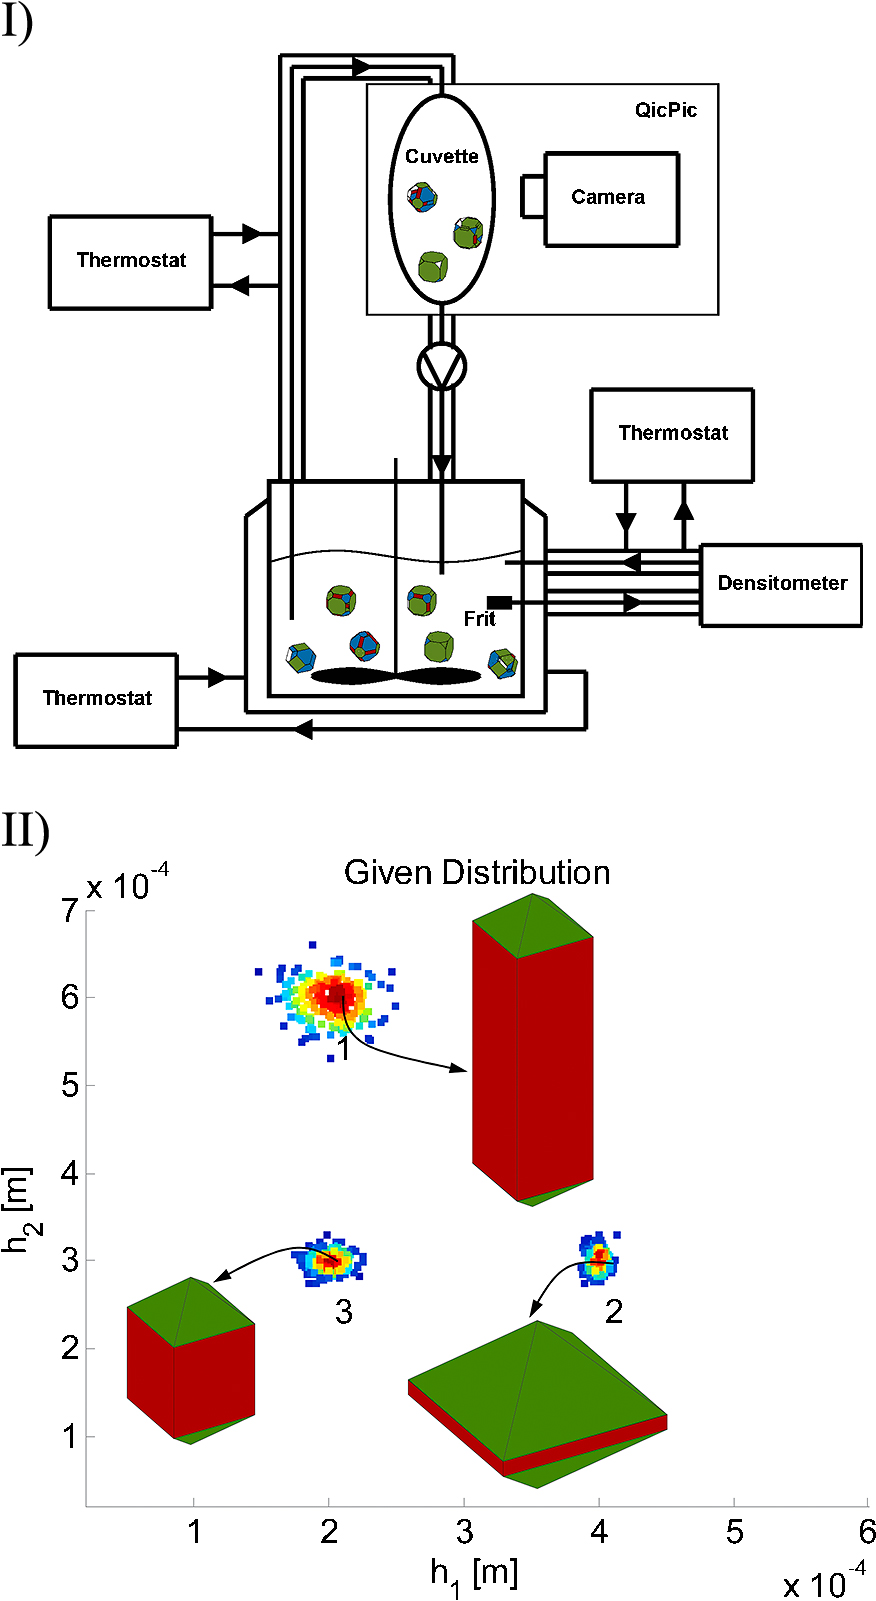
The group of Sundmacher developed a method to identify face-specific crystal growth rates based on an image analysis (Borchert et al., 2014). For this application, the flow cell analyzer QICPIC from Sympatec GmbH (Clausthal, Germany) was used in direct connection to a crystallizer. The authors reconstructed 3D crystal shapes from microscopic images with arbitrary orientations. A schematic representation of their setup and methodology is provided in the following figure. As nicely demonstrated in the lower panel of Fig. 11, it was possible to determine 2D PSDs of various particle shapes.
5.2 Laser diffraction
Laser diffraction (LD) also called laser diffraction spectroscopy or static light scattering or is a powerful and widely used technique to determine PSDs over a broad size range. Early developments were implemented by Leschonski and co-workers (Heuer and Leschonski K., 1985) by retrieving the one-dimensional PSDs of aerosols and particles in suspension. The technique is fast, precise, and cost efficient when compared to other characterization techniques. Eshel et al. critically evaluated the application of LD for the analysis of particle size distributions (Eshel et al., 2004).
The influence of particle shape on the measured PSD has been thoroughly investigated by the Scarlett group and others, see for instance (Ma et al., 2001; Eshel et al., 2004; Matsuyama and Yamamoto, 2005; Kang et al., 1994). Furthermore, 1D equivalent diameter distributions were measured for platelets and rods by calculating Fraunhofer diffraction patterns for arbitrary polyhedron particles (Heffels et al., 1996). Recently, a detailed analysis of LD of anisotropic particles was published providing information on particle orientation. Micropillars with elliptical cross-sections were used to determine the dependence between the spatial orientation of elongated particles and changes in the PSD (Font-Muñoz et al., 2020).
The angle-dependent intensity of scattered light can be correlated with the fractal dimension of aggregates comprised of a large number of primary nanoparticles. For the case of hematite aggregates, LD could be used to determine the fractal dimension of differently aggregated structures. High fractal dimensions could be correlated with slow (“reaction-limited”) aggregation, while loose tenuous aggregates were found within the diffusion-limited aggregation regime (Raper and Amal, 1993). In an application example from the papermaking process, flocculation dynamics and the stability of floc against shear stress could be monitored for different polymer additives using LD. In particular, the influence of the floc structure on the stability could be assessed via the determination of the fractal dimension of the flocs (Rasteiro et al., 2008). Further information on LD of aerosols can be found in the reviews by Sorensen (Sorensen C.M., 2001; Sorensen C.M. et al., 2018).
5.3 Dynamic light scattering
Dynamic light scattering (DLS) is a well-established technique, which has been extensively used for the characterization of nanoparticle dispersions (Xu R., 2015). In short, DLS allows for a temporal analysis of the scattered signal decay due to Brownian movement of nanoparticles in a suspension (Berne and Pecora, 2000). This approach is frequently applied in order to measure the translational diffusion in colloidal systems, which can be exploited to calculate the hydrodynamic diameter and the respective hydrodynamic diameter distribution via the Stokes-Einstein relation close to infinite dilution. At higher concentration, concentration-dependent diffusion properties can be extracted as well.
Moreover, there are approaches for the extraction of more than a single parameter from DLS measurements. For non-spherical particles, e.g. in the case of nanorods, the additionally occurring rotational diffusion can be separated into two parts, namely tumbling and spinning motion around the symmetry axis of the nanorods. The orientation-averaged rotational diffusion coefficients can be extracted from DLS measurements together with the translational one by analyzing the differently polarized components of scattered light (Berne and Pecora, 2000; Glidden and Muschol, 2012). The translational diffusion coefficient DT and the rotational diffusion coefficient DR can be retrieved from the decay times of the scattering intensity (Berger Bioucas et al., 2019)
|
τ
C
,
T
=
(
D
T
q
2
)
-
1 | (12) |
|
τ
C
,
mix
=
(
D
T
q
2
+
6
D
R
)
-
1 | (13) |
τC,T is the mean decay time associated with translation diffusion and τC,mix is the mean decay time associated with translation and rotational diffusion. The scattering vector is q. In particular, polarized DLS in a heterodyne detection scheme was shown to provide the orientation-averaged translational and rotational diffusion coefficients of gold nanorods in a single experiment (Berger Bioucas et al., 2019). The scattering geometry of the detection reduces multiple scattering effects and thus allows lower laser powers and hence reduced laser heating. This was demonstrated for non-transparent dispersions of gold nanorods dispersed in water and in water-glycerol mixtures (Berger Bioucas et al., 2019). Furthermore, from translational and rotational relaxation times, Glidden and Muschol derived an approach for directly obtaining particle dimensions of gold nanorods in the case of narrowly distributed samples (Glidden and Muschol, 2012), which was confirmed by confirmed by auxiliary TEM analysis.
5.4 Ultrasonic and electro-acoustic spectroscopy
The particle mass concentration and the PSD of suspended particles can be analysed by means of ultrasonic measurements. As the interaction of suspended particles and ultrasonic waves changes the sonic velocity as well as the extinction of sound waves, the changes of the frequency of the ultrasonic extinction can be evaluated in order to determine PSDs. The accessible particle sizes range from 10 nm up to 1 mm, which depends on the particle properties and the experimental setup (Riebel and Löffler, 1989).
Electroacoustic spectroscopy was pioneered by O’Brien (O’Brien, 1988) and Dukhin (Dukhin A.S. and Goetz, 2001). Electroacoustic spectroscopy deals with the interaction of electric and acoustic fields. In particular, it allows to measure the zeta potential of particles even in dense suspensions (O’Brien, 1988). The combination of both ultrasound sound absorption with electroacoustics provide the unique opportunity to characterize concentrated dispersions, emulsions and microemulsions in their natural state. Concentrated systems can reliably be measured with concentrations ranging up to 45 vol.-% (Dukhin A.S. and Goetz, 2001).
The combination of these techniques is extremely valuable for the characterization of colloidal stability without dilution and thus for the formulation of dispersions. Here we cite only one example from our own work. The simultaneous measurement of PSD and zeta potential paved the way to break the technical grinding limit around half a micron, which was postulated by Jimbo (Jimbo, 1992). Agglomeration during grinding in stirred media mills could be avoided by inline control of the particle stability in electrostatically stabilized dispersions. This way, the true grinding limit could be identified and clearly distinguished from an apparent grinding limit, which is the equilibrium of breakage and agglomeration. Nanomilling down to only 10 nm for refractory materials such as alumina and zirconia became thus possible (Stenger et al., 2005; Knieke et al., 2011), depending on the defect structures in the particles. So far, the defect structures in particles are largely unknown and remain a “universe inside” to be explored in future.
The strength of electroacoustic measurements can be extended to the determination of charge effects within pores. Electroacoustic measurements of the seismic electric current generated by ultrasound in wetted porous materials yield information on pore size distributions. This effect occurs when electric double layers inside the pore overlap or when the pore size is sufficiently large that for a given frequency the hydrodynamic flow cannot achieve a steady Poiseuille profile inside of the pores (Dukhin A. et al., 2013).
5.5 Small angle X-ray and neutron scattering
Li, Sensi and Lee published an extensive review on small angle X-ray scattering (SAXS) for nanoparticle research (Li T. et al., 2016). In short, the scattering behavior of a single particle depends on its geometry as well as on its surface properties (Hofman et al., 1993). Therefore, SAXS is a suitable method to characterize particle size and anisotropy. The measured intensity profile of a sample is the superposition of all particle scattering intensities and additionally influenced by the sample structure. Therefore, the analysis of disperse properties of nanoparticles via SAXS requires assumptions regarding size or shape. Typically, a suitable type of distribution must be chosen for the retrieval of particle size distributions. (Li T. et al., 2016).
As the intensity profile also depends on the particle shape, SAXS can also be used for the characterization of particle anisotropy. This was visualized for ellipsoids and cylinders in literature (Li T. et al., 2016) based on the Guinier-Porod model (Hammouda, 2010). However, it is not possible so far to determine full 2D PSDs solely from SAXS profiles due to the ill-posed inversion problem for the deconvolution of the scattering curve. A combination with other techniques can help to overcome this limitation. Hubert et al. were able to determine the growth dynamics of length and diameter of gold nanorods via SAXS based on prior information on the 2D PSD of the particles obtained by TEM (Hubert F. et al., 2012). Similar restrictions hold also true for Grazing Incidence Small Angle X-ray Scattering (GISAXS). This method allows the versatile characterization of nanostructures and thin films. To unravel its full potential for the investigation of the spatial organization, the depth profile or the morphology of the sample, the use of synchrotron radiation source is beneficial (Müller-Buschbaum, 2009; Renaud et al., 2009).
Another small angle scattering technique is small angle neutron scattering (SANS). In these experiments, neutron radiation is monitored in order to extract information about the particle size or shape. Further details on this technique have been provided by Blazek and Gilbert, focusing on the application of SAXS and SANS to the characterization of organic structures (Blazek and Gilbert, 2011). Strunz et al. characterized Ni3Si-type nanoparticles by SANS. Combining TEM and SANS, it could be demonstrated that an amorphous shell forms on the particle core (Strunz et al., 2007).
In another example, SAXS and SANS have been combined. Core size and shell properties of ZnO quantum dots with a size below 6 nm were characterized by Unruh and co-workers by a combination of SANS and SAXS for the same sample. The X-rays provide information on the core of the nanoparticles due to the fact that X-rays are scattered at the electrons of the core atoms, while the neutrons are scattered at the cores of the organic shell atoms. These results were in excellent agreement with the nanoparticle analysis via analytical ultracentrifugation (AUC) and allowed to monitor changes of the shell during the ripening processes as a function of temperature (Schindler et al., 2015). Moreover, gold nanorods in aqueous solution were characterized by a combination of SAXS and SANS alongside TEM measurements. Based on these results, a direct measurement of the thickness of the surfactant layer CTAB on the surface of the gold nanorods was derived (Gómez-Graña et al., 2012).
5.6 Field flow fractionation
Throughout FFF an external field is applied to a suspension flowing through a narrow channel. The laminar parabolic flow velocity profile in the channel induces faster particle transport in the middle of the channel. The external field acts perpendicular to the flow, whereby the interplay of acting drag and field forces leads to a separation of particles in field direction. With the different particle velocities present, particles elute from the channel at different times and position in dependence of particle properties and the applied external field. FFF is subdivided into e.g. thermal, centrifugal, gravitational and asymmetric FFF (Baalousha et al., 2011). In particular, centrifugal FFF has recently been applied to separate silica nanoparticles and to determine number-based PSDs (Kato et al., 2019).
A step towards the determination of nD PSDs was conducted by Cölfen and coworkers. The authors studied asymmetric field flow fractionation (AF4) coupled to a multiple laser light scattering detector (Schmid et al., 2018). AF4 was used to measure diffusion coefficient distributions based on peak broadening corrected by a new algorithm, which uses diffusion coefficient distributions instead of a single mean diffusion coefficient. With this, it was possible to obtain a hydrodynamic diameter distribution with increased resolution. Further evaluation of the scattered light by deconvolution of the detector signals allowed calculating the corresponding molecular weights of formerly not properly separated signals. Their results are summarized in the Fig. 12. While FFF has shown to be a powerful method for the determination of pairs of two different parameters, the determination of full 2D PSDs is yet to be demonstrated.

AF4 was coupled with single particle inductively coupled plasma mass spectrometry (spICP-MS). spICP-MS is an emerging technique with respect to nanomaterial characterization as outlined in detail in (Mozhayeva and Engelhard, 2020). Degueldre et al. presented the underlying theoretical background of spICP-MS for characterizing nanoparticle dispersions (Degueldre et al., 2004), while Pace et al. presented a detailed study with a focus on sizing of nanoparticles (Pace et al., 2011). With this, the particle mass diameter distributions of silver nanoparticles were measured. Notably, the detector system of the MS analyzer requires a transfer into a carrier gas. So far, these methods yield a particle mass diameter distribution. The main advantage of spICP-MS is the discrimination of the nanoparticle based on elemental composition, whereas many current characterization techniques are unable to differentiate between different types of nanoparticles. Further classification prior to spICP-MS analysis is necessary to distinguish between particles with the same composition (Pace et al., 2011).
The complex issue of fractionation prior to spICP-MS was directly addressed in (Huynh et al., 2016). The authors combined AF4 with spICP-MS to solve the current limitations of conventional ICP-MS or spICP-MS. This setup uses the advantages of two orthogonal characterization techniques based on different physical principles in order to simultaneously provide both mass and hydrodynamic diameters of the detected nanoparticles yielding a full 2D PSD. From this information relevant and otherwise hardly accessible properties such as layer thickness and aggregation states of nanoparticles can be obtained. AF4-spICP-MS was capable of measuring Ag NPs from suspensions, fractionating polydisperse AgNPs (see Fig. 13), and distinguishing AgNPs from Ag-SiO2 NPs with similar Ag mass. One limitation of the method still is the quantification of defined nanoparticle sizes in heterogeneous samples.
5.7 2D analysis by analytical ultracentrifugation
Over decades, AUC was mostly used in the biomedical field with a few exceptions for the analysis of colloidal systems (Planken and Cölfen, 2010; Karabudak and Cölfen, 2016). Due to recent progress in the development of new detector systems, AUC can be considered as gold standard due to its unprecedented accuracy, reproducibility and resolution in a large range of applications (Walter J. et al., 2014; Karabudak et al., 2016; Pearson et al., 2018; Wawra et al., 2019).
In AUC experiments, the sedimentation of nanoparticles is tracked under the influence of a centrifugal field directly in the liquid phase with the use of an optical detection system. The temporal and radial evolution of the concentration profiles allow for the extraction of sedimentation (s) and diffusion coefficients (D) alongside their associated optical properties. Available detection systems allow combining extinction and fluorescence spectra with hydro- and thermodynamic properties (Uchiyama et al., 2016; Wawra et al., 2019). While sedimentation and diffusion depend both on size and shape of the particle, the particle density further influences the sedimentation process.
As AUC measurements provide combined information on sedimentation, diffusion properties and optical properties for small particles, multidimensional information can be obtained from a single experiment. Carney et al. used the combination of s and D to study the particle size and particle density distribution (Carney et al., 2011). For the case of spherical core-shell gold nanoparticles, the sedimentation and the diffusion coefficient depend on size and density. Therefore, it was possible to determine the core diameter distribution alongside the shell properties of the polydisperse core-shell gold nanoparticles. The results are illustrated in Fig. 14 and were validated by auxiliary TEM analysis.

Furthermore, Nontapot et al. analyzed core-shell silica nanocrystals terminated with cyclohexane or allylamine via AUC (Nontapot et al., 2013). In their work, the effective particle density was determined by measuring the sedimentation properties of the nanoparticles in different solvents. Based on these results, the shell thickness could be calculated, which provided the effective 1D PSD in agreement with the data from other nanoparticle characterization techniques, namely DLS and TEM. Demeler et al. further addressed the issue of analyzing core-shell nanoparticles (Demeler et al., 2014). Their work demonstrated a powerful data evaluation tool, which is implemented in the UltraScan-III software. With this, it was possible to determine the effective density and molar mass for CdSe and PbS QDs from a single AUC experiment.
Thajudeen et al. (Thajudeen T. et al., 2017) combined the measured sedimentation coefficients from AUC in liquid phase and electrical mobility measurements from the combination of DMA and CPC in the gas phase via transfer of the nanorods from the liquid to the gas phase by an advanced electrospray technique (Lübbert and Peukert W., 2018). This work demonstrated that it is possible to determine mean values of length and diameter for Au and ZnO nanorods by combining the two techniques, as mobility diameter and sedimentation coefficients depend differently on the geometry of the rods. The results were validated by auxiliary TEM and SEM analysis. While this is a powerful technique for the description of this system, the measurement of a full 2D PSD was not yet possible.
Analytical centrifugation (AC) is an emerging technique for nanoparticle characterization (Detloff et al., 2007), which is more easily applicable than AUC, less expensive and delivers high sample throughput by parallelization of up 12 samples in one run. Interestingly, software tools for the comprehensive determination of PSD from AUC data have been transferred to AC (Walter J. et al., 2015). This step significantly enhanced the precision of the obtained distributions in particular for heterogeneous samples. Moreover, the recent development of sector-shaped centerpieces for AC experiments enabled the measurement of a full diffusion-corrected sedimentation coefficient distribution. With this, it is possible to determine the hydrodynamic diameter distribution and the core-diameter distribution of gold nanoparticles alongside the stabilizer shell thickness of 3 nm only (Uttinger et al., 2020).
5.8 Analytical ultracentrifugation: optical back coupling
A very promising technique for the characterization of plasmonic nanoparticles is the Optical Back Coupling (OBC) method (Wawra et al., 2018), which allows obtaining number-weighted 2D PSDs. Therefore, the sedimentation of particles within an AUC is tracked via a multiwavelength detector. This allows deducing sedimentation coefficient distributions for many different detection wavelengths. In return, extinction spectra can be extracted for defined intervals of the sedimentation coefficient distribution enabling to correlate the mean sedimentation coefficient of the respective interval with the spectra of the particles exhibiting these defined sedimentation properties, as shown in Fig. 15 for gold nanorods.

As the spectra of the gold nanorods as well as the sedimentation coefficients depend on the geometry of the particle, the combined optical and hydrodynamic information can be used to deduce length and diameter alongside the particle concentration. Therefore, the extracted spectra are analyzed using different optical models under the constrain of the interval’s mean sedimentation coefficient. The length, diameter, aspect ratio, volume, surface and cross-sectional distributions can be readily obtained from these results. As the technique can be extended to other nonspherical plasmonic particles and can be used for determining relative amounts of particles of different shapes, it provides complete and quantitative insights into such particulate systems.
An exemplary 2D measurement is depicted in Fig. 16 I. The displayed TEM inset shows very good agreement of OBC and TEM. An even better comparison is possible via the 1D length and 1D diameter distributions. Eq. 4 can be used for the calculation of the reduced 1D distributions from the 2D PSD, integration leads to the cumulative distributions. All used optical models show excellent agreement with TEM statistics, see Fig. 16 II, which emphasizes the accuracy and potential of the OBC method for 2D characterization of plasmonic nanoparticle ensembles.
In addition to advances in the data analysis of plasmonic nanoparticle ensembles, a multi-wavelength emission detector has recently been developed for AUC (Wawra et al., 2019). These hardware developments significantly enlarge the measurement window of AUC for the detection of size-dependent emission properties of nanoparticles.
6. Conclusions
Modern particle systems are associated with a wide range of applications. The necessary functionality of micro- and nanoparticle systems is a direct result of the five dimensional parameter space that is defined by particle size, shape, surface, structure, and composition.
In the first part of this review, we provided the mathematical background for the comprehensive description of particle property distributions. These concepts extent the well-known 1D PSD to a multidimensional description of particle property distributions. In particular, it was shown how to calculate 1D distributions from 2D property distributions.
While the determination of 1D PSDs is well established, the direct retrieval of nD PSDs is a challenging task but necessary next step towards the control of the full particle property space. Recent progress in the description and characterization of multivariate particle property distributions is summarized.
Well-established techniques such as light microscopy, SEM and TEM or AFM allow for the retrieval of 2D projections of particles while more advanced 3D tomography provides full 3D information. Moreover, correlating the chemical composition with topographic or geometric information is possible by coupling spectroscopic measurements with AFM co-localization. However, most of these techniques, are very tedious, time-consuming and require complex sample handling. Moreover, the results are typically associated with the common problem of poor statistics. For nD PSDs, large sample numbers are required.
Early works for the determination of 2D property distributions were conducted for aerosols. The coupling of different measurement devices like the DMA with a subsequent device allows to determine nD property distributions. This has been demonstrated by coupling DMA and inductively coupled plasma atomic emission spectrometry, epiphaniometer, CPC and MS, for instance.
For μm-sized particles dispersed in the liquid phase, there are several techniques for nD characterization by image analysis in flowing systems. These are applied in order to investigate crystal growth kinetics in situ. Well-established scattering techniques such as DLS, SAXS or SANS allow for extracting information on the particle size and shape directly in liquid phase.
Fractionating techniques, such as FFF and A(U)C bear the advantage of particle separation prior to their detection. This enables the detailed analysis of individual fractions of an entire particle ensemble. In particular, AUC was successfully applied for a 2D analysis of core-shell nanoparticles by the analysis of sedimentation and diffusion properties. Recently, novel approaches were demonstrated for the coupling of optical and hydrodynamic properties of plasmonic nanoparticles in combination with a multi-wavelength detector to analyze number-weighted 2D dimensional distributions of diameter and length of gold nanorods.
In summary, our review discusses advances and experimental possibilities to characterize particle ensembles with respect to nD property distributions. Few techniques are available, which deliver multidimensional particle properties directly. As the complexity continues to increase, further method development is required. We foresee that clever combinations of several techniques will allow to shed light on the complex multiparameter space of fine particle systems. As often in science, progress strongly depends on our ability to “see” what is going on, i.e. advances in multidimensional particle characterization are mandatory for the further development and full exploitation of particulate products of high-added value.
 https://ror.org/00f7hpc57


;%0A%09%09%09newWindow.document.open();%0A%09%09%09newWindow.document.write('<img src=%22./Graphics/39_2022005_17.jpg%22>');%0A%09%09%09newWindow.document.close();%0A%09%09)
;%0A%09%09%09newWindow.document.open();%0A%09%09%09newWindow.document.write('<img src=%22./Graphics/39_2022005_18.jpg%22>');%0A%09%09%09newWindow.document.close();%0A%09%09)
;%0A%09%09%09newWindow.document.open();%0A%09%09%09newWindow.document.write('<img src=%22./Graphics/39_2022005_19.jpg%22>');%0A%09%09%09newWindow.document.close();%0A%09%09)
;%0A%09%09%09newWindow.document.open();%0A%09%09%09newWindow.document.write('<img src=%22./Graphics/39_2022005_20.jpg%22>');%0A%09%09%09newWindow.document.close();%0A%09%09)