Abstract
The calcium-looping process, relying on the reversible calcination/carbonation of CaCO3, is one of the most promising solution to perform thermochemical energy storage (TCES) for concentrating solar power (CSP) plants. Indeed, CaO precursors such as limestone can rely on the high energy density, low cost, large availability and nontoxicity. In this work, the study of the sound-assisted carbonation of fine CaO particles (< 50 μm) for TCES-CSP has been furthered. In particular, a kinetic study has been performed to analyze the effect of the particular carbonation conditions to be used in TCES-CSP applications, i.e. involving carbonation under high CO2 partial pressure and at high temperature. All the experimental tests have been performed in a lab-scale sound-assisted fluidized bed reactor applying high intensity acoustic field with proper frequency (150 dB–120 Hz). The carbonation kinetics has been analyzed by applying a simple kinetic model, able to properly describe the fast (under kinetic control) and slow (under diffusion control) stage of the reaction. In particular, the reaction rate, the intrinsic carbonation kinetic constant and the characteristic product layer thickness have been evaluated, also highlighting their dependence on the temperature between 800 and 845 °C; a value of 49 kJ mol−1 has been obtained for the activation energy. Finally, a good agreement between the conversion-time profiles, evaluated from the applied kinetic models, and the experimental data has been obtained.
1. Introduction
One of the main challenge for a short-term wider utilization of solar energy, which is characterized by an intrinsic intermittency, is represented by energy storage (Ammendola et al., 2020). In this framework, the calcium-looping (CaL), performed in fluidized bed reactors, is attracting growing research interest for thermochemical energy storage (TCES) in concentrating solar power (CSP) plants, in light of the high energy density, small costs, non-toxicity, and large availability of natural CaO precursors (Chacartegui et al., 2016; Ortiz et al., 2018). It is based on the cyclic calcination/carbonation of CaCO3:
|
CaCO
3
⇌
CaO
+
CO
2
Δ
H
rxn
0
=
178
kJmol
-
1 | (1) |
The thermodynamics of the system is strongly dependent on the CO2 partial pressure (PCO2) (Ortiz et al., 2019), which can be evaluated as a function of the temperature (T) according to (Stanmore and Gilot, 2005):
|
P
eq
=
P
y
eq
=
4.137
×
10
7
exp
(
-
20474
T
) | (2) |
The equilibrium
P
CO
2
(
P
CO
2
eq
) of the carbonation-calcination reaction, calculated according to Eq. (2), is plotted in Fig. 1 between 650 and 1000 °C, at different inlet CO2 molar ratio (yCO2).
It is clear from Fig. 1 that increasing values of
P
CO
2
eq at a constant temperature or decreasing values of the temperature at a constant
P
CO
2
eq favors the carbonation reaction thermodynamically, i.e. thus yielding larger values of CaO carbonation conversion.
It is important to highlight that the optimal operating conditions of the CaL process and, therefore, also the CaO multicycle performance, deeply depend on the particular application (Ortiz et al., 2018). In particular, high CO2 partial pressure and temperature (≥ 800 °C) can be used to perform carbonation in order to obtain high global efficiency for energy storage and electricity production in CSP plants (Ortiz et al., 2018). In contrast, relatively low temperature (~750 °C) and CO2 partial pressure can be adopted to perform the calcination; this can be achieved using either steam or helium, namely a gas that can be easily separated from CO2 (Karasavvas et al., 2018). As discussed by (Chacartegui et al., 2016), this reduction of the calcination temperature would allow, on the one hand, to limit the sorbent deactivation over repeated cycle (i.e. increased residual effective conversions with respect to conventional CaL for CCS), and, on the the other, to use less expensive solar receivers. Lower calcination temperatures decrease the radiative losses, thus enhancing the efficiency of the process. Clearly, if He is used for calcination the He/CO2 gas mixture exiting from the calciner must be subjected to a separation step, which can be performed quite easily using selective membranes thanks to the different molecular size of He and CO2. Another crucial point to take into account is the necessity to have a process with free CO2 emissions. In this framework, a viable solution, proposed by (Chacartegui et al., 2016), is to realize the looping process according to a closed cycle scheme: the carbonator will be fed with a pure CO2 stream with a rate remarkably larger than the stoichiometric rate needed for the carbonation reaction. Then, the CO2 in excess exiting the carbonator will be used as heat carrier fluid in a closed Brayton cycle and finally sent to a compression stage before being stored for the subsequent cycles. Clearly, being a closed cycle entails that there is no need for a continuous feed of any fresh gas stream, which is especially important in the case of the expensive He (Chacartegui et al., 2016).
The strong reduction of the CaO carbonation conversion with cycling operations, caused by sintering and pore-plugging, is still one of the main drawbacks and open challenges in CaL (Benitez-Guerrero et al., 2018; Ortiz et al., 2019; Sarrión et al., 2018). In this context, it has been showed that the carbonation conversion can be enhanced by using fine CaO particles, thus also increasing the obtainable energy density, thanks to the maximization of the available sorbent surface (i.e. the surface which is actually in direct contact to the gaseous phase) and to the hindrance of the intrinsic loss of CaO multicyclic activity (Durán-Martín et al., 2020). However, the fluidization of fine particles is difficult; it is characterized by agglomeration, channeling and plugging (Raganati et al., 2018; Raganati and Ammendola, 2021) caused by the strong interparticle forces (Raganati et al., 2017; Seville et al., 2000). In this framework, the acoustic vibrations have been proved to promote and improve the fluidization of fine particles due to the dynamic break-up of the large particle clusters, thus also increasing the gas/solids contact efficiency (Raganati et al., 2020a, 2015). Besides this, sound waves can also promote other phenomena at the interface between the gaseous and the solid phase, such as acoustic streaming (Valverde, 2013), which also contributes to improve the mass and heat transfer rates (Raganati et al., 2020a). In fact, we demonstrated in a previous work that the carbonation performances of fine limestone particles under TCES-CSP operating conditions can be remarkably improved by the application of high intensity acoustic fields (Raganati et al., 2020a). Besides the multicycle carbonation conversion, also the carbonation kinetics is crucial for the reactor design, especially for the scale-up of thermal processes.
This work represents a further development of the above-mentioned research activity on the carbonation reaction of fine CaO particles (< 10 μm) for TCES-CSP. In particular, considering that the carbonation reaction (i.e. multicyclic CaO conversion and reaction kinetics) is remarkably affected by the operating conditions (carbonation thermodynamics and kinetics are strongly dependent on temperature and pressure), a kinetic study has been performed to point out the effect of the particular operating conditions to be applied for TCES-CSP, namely involving high CO2 partial pressure and high temperature carbonation. A lab-scale sound-assisted fluidized bed reactor has been used to perform all the experimental tests, applying acoustic fields of proper intensity (150 dB) and frequency (120 Hz). The carbonation kinetics has been studied using a simple kinetic model, able to properly describe the fast and slow stage of the of the reaction, thus obtaining valuable data for designing and operating the carbonation reactor. In particular, the evaluation of the reaction rate, activation energy and the characteristic product layer thickness has been performed.
2. Experimental
2.1 Materials and their fluidization behavior
A limestone provided by OMYA with a Sauter diameter of 3.61 μm and density of 2.71 g cm−3, namely belonging to Group C of Geldart’s classification, has been used as sorbent. Further details regarding both the chemico-physical characterization and the fluid-dynamic behavior can be found elsewhere (Raganati et al., 2020a). Briefly, the limestone particles are characterized by a natural tendency to form large agglomerates (tens of microns) and by a relatively low BET specific surface area (S0) of 1.6 m2 g−1, according to the typical values of natural limestones (Raganati et al., 2020a).
With reference to the fluid-dynamic behavior, as discussed by (Raganati et al., 2020a), the powder cannot be properly fluidized under ordinary conditions due to agglomeration and channeling; i.e. the pressure drops are always lower than the material weight per unit area, thus meaning that the bed is not completely fluidized, as typical of cohesive powders. More specifically, the predominance of the interparticle forces over weight and drag forces causes the individual particles to stick to each other and form agglomerates (agglomeration), which causes, in turn, a remarkable worsening of the permeability of the bed by the fluidizing gas (channeling and plugging). In contrast to this, the application of the acoustic perturbation makes it possible to remarkably enhance the fluidization quality; indeed, a regular pressure drop curve has been obtained. This improvement of the fluidization behavior is due to the fact that the propagation of the sound wave inside the bed causes a continuous break-up of the large particle agglomerates into smaller fluidizable structures. More specifically, the internal cohesive forces are counteracted by the external drag and inertial forces generated by the acoustic perturbation. In particular, according to the cluster/sub-cluster oscillators model discussed by (Raganati et al., 2017), the clusters break-up into smaller sub-clusters at the contact points between them, namely where the collision energy generated by the sound wave overcome the cohesive interparticle force. In line with these theoretical considerations, it has been obtained that under sound assisted conditions the fine limestone particles can be properly fluidized as agglomerates which are interested by a dynamic break-up and re-aggregation mechanism. In particular, the fluidizing agglomerate size (30–80 μm), i.e. the real size of the fluidizing structures, is always bigger than the nominal size of the powder (3.61 μm, the Sauter diameter obtained from the granulometric analysis), regardless of the applied acoustic parameters.
With reference to the effect of the sound parameters, it has been found that increasing the SPL (sound pressure level) value from 120 to 150 dB has a beneficial effect on the fluidization quality, thus meaning that acoustic field with higher intensity should be employed to maximize the fluidization quality. Indeed, both the fluidizing aggregate size and the minimum fluidization velocity are always decreased by passing from 120 to 150 dB. This is due to the enhancement of the energy introduced inside the bed when the SPL is increased, which implies that the break-up mechanism becomes more and more efficient. Indeed, when the SPL is increased from 120 to 150 dB, the size of the fluidizing agglomerates is reduced, thus resulting in the decrease of the minimum fluidization velocity. Sound frequency, on the contrary, has been found to have a non-monotonic effect on the fluidization quality. Indeed, both the fluidizing aggregate size and the minimum fluidization velocity are characterized by a nonlinear relationship with the sound frequency, i.e. an optimum value of frequency equal to 120 Hz can be observed. This behavior has been explained considering that the frequency directly affects the relative motion between clusters and sub-clusters, which, in turn, promotes the break-up and re-aggregation mechanism. In particular, for too high values of frequency, the propagation of the acoustic wave through the bed of particles is poor due to the increased sound absorption coefficient, which is proportional to the square of sound frequency. Hence, for a sound source positioned at the top of the fluidization column, the upper part of the bed absorbs most of the acoustic energy and only a very attenuated sound wave manages to reach the bottom part of the bed. Consequently, the disruption of the large agglomerates present at the bottom of the bed is very weak, thus causing a reduction of the fluidization quality, i.e. an increase of the minimum fluidization velocity. Contrarily, for too small sound frequencies, there is no relative motion between larger agglomerates and smaller sub-agglomerates, which also leads to a weak break-up mechanism and poor fluidization quality.
Finally, also the effect of the temperature on the fluidization behavior has been analyzed by (Raganati et al., 2020a) performing test at different temperatures (25–850 °C), pointing out that increased fluidization difficulty is encountered as the temperature is increased. This result has been explained referring to the fact that interparticle forces are intensified at higher temperatures. Then, as more and more particles tend to adhere to one another, larger fluidizing agglomerates (passing from 30 to 80 μm when temperature is increased from 25 to 850 °C) result from the intensification of the interparticle forces. Consequently, the minimum fluidization velocity is also increased when temperature is increased from 25 to 850 °C, as a result of the increased fluidizing agglomerates size.
2.2 Experimental apparatus and procedure
In this work, sound-assisted (150 dB–120 Hz) fluidization tests have been performed to experimentally study the kinetics of the carbonation reaction of fine natural CaO particles at operating conditions relevant in the CaL-CSP integration for TCES. Optimal parameters of the acoustic field, i.e. those providing the best fluidization quality, have been chosen according to the results obtained from the fluid-dynamic characterization of the limestone (Raganati et al., 2020a), briefly summarized in the Section 2.1.
All the experimental tests have been performed in a lab-scale sound-assisted fluidized bed (40 mm ID) at atmospheric pressure. Further details regarding the sound-generation system have been reported in previous works (Raganati et al., 2020a). The gas feed has been prepared using N2 and CO2 cylinders (99.995 % vol.); two mass flow controllers (Brooks 8550S) have been used to set/control the inlet flowrates. A heating jacket (Tyco Thermal Controls GmbH) has been used to heat the column up to the desired temperature. The temperature of the reactor is monitored and controlled by means of a type K thermocouple linked to a PID controller. The outlet CO2 concentration is continuously monitored by means of an analyzer provided with an infrared detector (ABB AO2020, URAS 14) (Raganati et al., 2020b). Before the carbonation tests, a pre-treatment of the limestone particles was performed; in order to obtain pure CaO, the CaCO3 sample (100 g) is calcined (T = 900 °C) under sound-assisted fluidization conditions (150 dB–120 Hz) for 2 h and using N2 as fluidizing gas (115 NL/h, corresponding to a superficial gas velocity of 2.5 cm/s, i.e. about five times the minimum fluidization velocity of the sorbent material (Raganati et al., 2020a)). On the basis of the fluid-dynamic characterization, optimal parameters (intensity and frequency) of the acoustic perturbation have been selected (Raganati et al., 2020a). Then, the sample is carbonated under sound-assisted fluidization conditions (150 dB–120 Hz) using CO2 (70 vol% CO2 in N2) as inlet gas flowrate (115 NL/h) and at different temperatures (800 °C, 815 °C, 830 °C, 845 °C and 860 °C) until the sorbent is completely saturated. The CaO conversion (X) has been calculated from the amount of CO2 reacted with CaO, which, in turn, has been evaluated from the measured outlet CO2 concentration profiles (Raganati et al., 2020a).
3. Carbonation kinetics
The carbonation involves the reaction of a solid reactant (CaO) with a gaseous reactant (CO2) to produce another solid (CaCO3) (Khawam and Flanagan, 2006).
In particular, the carbonation reaction takes place in two stages with two different kinetic regimes (Raganati et al., 2020a). At the beginning, the carbonation occurs fast under the control of by the kinetics of the chemical reaction between the CO2 molecules and the CaO (Stage A) (Raganati et al., 2020a). After this initial kinetically-controlled period, the free sorbent particle surface is covered by a thin layer of carbonate; therefore, the diffusion of CO2 molecules through this solid layer starts to control the reaction (stage B) (Raganati et al., 2020a). In this context, the product layer thickness is a very important factor to analyze the shift from the fast to the slow reaction stages (Alvarez and Abanades, 2005).
The reaction rate is evaluated as the time evolution of the conversion degree, X(t), which can assume characteristic shapes (Li Z. et al., 2012). Then, the kinetic analysis aims to examine these shapes and explain them by means of physical fundamental mechanisms (Khawam and Flanagan, 2006).
The reaction rate (dX/dt) can be written as:
|
d
X
d
t
=
r
(
T
)
f
(
X
) | (3) |
where
r(T) (min
−1) is the temperature-dependent reaction rate and
f(X) is the reaction model describing the reaction mechanism. By integrating
Eq. (3), the integral form of the kinetic model
g(X) can be obtained:
|
g
(
X
)
=
∫
0
t
d
X
(
t
)
f
(
X
) | (4) |
After the time evolution of the carbonation degree has been evaluated experimentally, the reaction kinetics can be analyzed by selecting the most appropriate apparent kinetic model to fit the experimental data (Ashraf and Olek, 2018; Khawam and Flanagan, 2006).
The most important feature of these models is that they lump together all the mass transfer resistances, such as external diffusion, diffusion in the pores, and surface reaction (Khawam and Flanagan, 2006; Sun J. et al., 2008). Then, the selected kinetic model is used to experimental data in order to calculate an apparent global kinetic rate (Ammendola et al., 2021; Khawam and Flanagan, 2006; Sun J. et al., 2008). By definition, an apparent kinetic rate is different from the intrinsic reaction rate, which will be dependent on a number of experimental variables and/or sorbent morphological features (Goodbrake et al., 1979; Khawam and Flanagan, 2006; Sun J. et al., 2008). Clearly, the use of apparent kinetic models holds the advantage to be more simple, i.e. all the reaction steps can be accounted in one expression (Salaudeen et al., 2018). However, these models are scale-dependent due to the influence of transport phenomena (Khawam and Flanagan, 2006; Sun J. et al., 2008).
So far, several apparent models have been developed for the carbonation reaction, based on different mechanistic assumptions (Fedunik-Hofman et al., 2019a). In this framework, Lee (Lee, 2004) proposed a model equation for the apparent kinetics of the CaO carbonation in differential and integral form:
|
d
X
d
t
=
r
(
1
-
X
X
u
)
2 | (5) |
|
X
(
t
)
=
X
u
t
(
X
u
/
r
)
+
t | (6) |
where
r (min
−1) is the apparent reaction rate and
Xu is the ultimate CaO carbonation conversion; with the time evolution of the carbonation reaction, the reaction becomes slower since the carbonate product layer starts to form, thus hampering the access of CO
2 molecules to the residual CaO and leading to values of ultimate conversions < 100 %. Then, the reaction rates of the two carbonation stages (stage A and B),
rA and
rB, can be determined by data fitting, using the linear form of
Eq. (6):
|
1
X
=
1
r
(
1
t
)
+
1
X
u | (7) |
In particular, a bi-linear plot will be obtained, i.e. two lines with different slopes depending on whether the reaction is either under kinetic control (stag A) or under diffusion control (stage B). Then, rA and rB are evaluated from the slope of the plot, whereas, the ultimate conversion at the end of stage A and B, XuA and XuB, can be calculated from the intercept of the plot (Lee, 2004). Since the carbonation reaction may be incomplete, the extent of conversion, α, is also used; it is evaluated as X/Xu.
The coefficient of correlation, R2, assuming values between 0 to 1, and the sum of squares errors function (SSE) (Foo and Hameed, 2010), where the lower the SEE value the better the fitting quality is, have been calculated to assess the fitting quality of the kinetic model to the experimental data. In particular, SSE can be calculated according to:
|
SSE
=
∑
i
=
1
i
=
n
(
X
mod
i
-
X
exp
i
)
2 | (8) |
where
Xexp and
Xmod are the experimental and modeled carbonation conversion degree, respectively, and
n is the number of experimental points.
According to several works available in the literature (Alvarez and Abanades, 2005; Biasin et al., 2015; Criado et al., 2018; Li Z. et al., 2012a,b), the conversion, XuA, at which the reaction shifts from stage A (i.e. kinetic control) to stage B (diffusion control) is also linked to the thickness of product layer. Hence, the effect of the temperature on XuA has been linked to the variation of the product layer thickness with the carbonation temperature. In fact, XuA represents the value of the CaO conversion degree specifically corresponding to the critical product layer thickness (Alvarez and Abanades, 2005). As discussed in (Alvarez and Abanades, 2005), knowing the value of XuA, the product layer thickness at the end of stage A, h, can be evaluated as:
|
h
=
X
uA
S
0
V
CaCO
3
M
M
CaO | (9) |
where
MCaO is the molecular weight of CaO,
V
CaCO
3
M is the molar volume of CaCO
3 and
S0 is the CaO specific surface area.
As proposed by in (Sun P. et al., 2008), the grain model has been used to calculate the intrinsic reaction rate constant (ks), which is an intrinsic feature of the material, of the carbonation reaction in the stage A (i.e. the kinetically-controlled period). The main assumptions of this model are: i) the diffusion resistance can be neglected at the beginning of the reaction (stage A) whereas the reaction is large; therefore, reaction is under kinetic control (Sun P. et al., 2008); ii) the reaction rate, rA, evaluated from the slope of the linear plot, as discussed above, is extended to represent the true rate at the zero conversion point (i.e. rA = r0) (Sun P. et al., 2008).
The reaction rate at the beginning can be written in power law as (Sun P. et al., 2008):
|
d
X
d
t
|
t
=
0
=
3
r
A
=
M
CaO
k
s
(
P
CO
2
-
P
CO
2
eq
)
n
S
0 | (10) |
where
(
P
CO
2
-
P
CO
2
eq
)is the reaction thermodynamic driving force,
n is the reaction order and
ks is the intrinsic chemical reaction rate constant.
ks can be calculated using the Arrhenius equation:
|
k
s
=
k
0
exp
(
-
E
R
T
) | (11) |
being
E the activation energy and
k0 the pre-exponential factor.
According to Sun P. et al. (2008), the reaction is zero-order (n = 0) for
(
P
CO
2
-
P
CO
2
eq
)
>
10
kPa. Considering that PCO2 of 0.7 atm has been used for all the tests performed in this work, the assumption that the reaction order is zero is always valid. Then, considering Eq. (11), Eq. (10) can be re-written in logarithmic form as:
|
ln
(
r
1
)
=
ln
(
M
CaO
k
0
S
0
/
3
)
-
E
R
T | (12) |
Hence, fitting Eq. (12) with the values of rA, obtained at the different investigated temperatures, E and k0 can be calculated.
4. Results and discussions
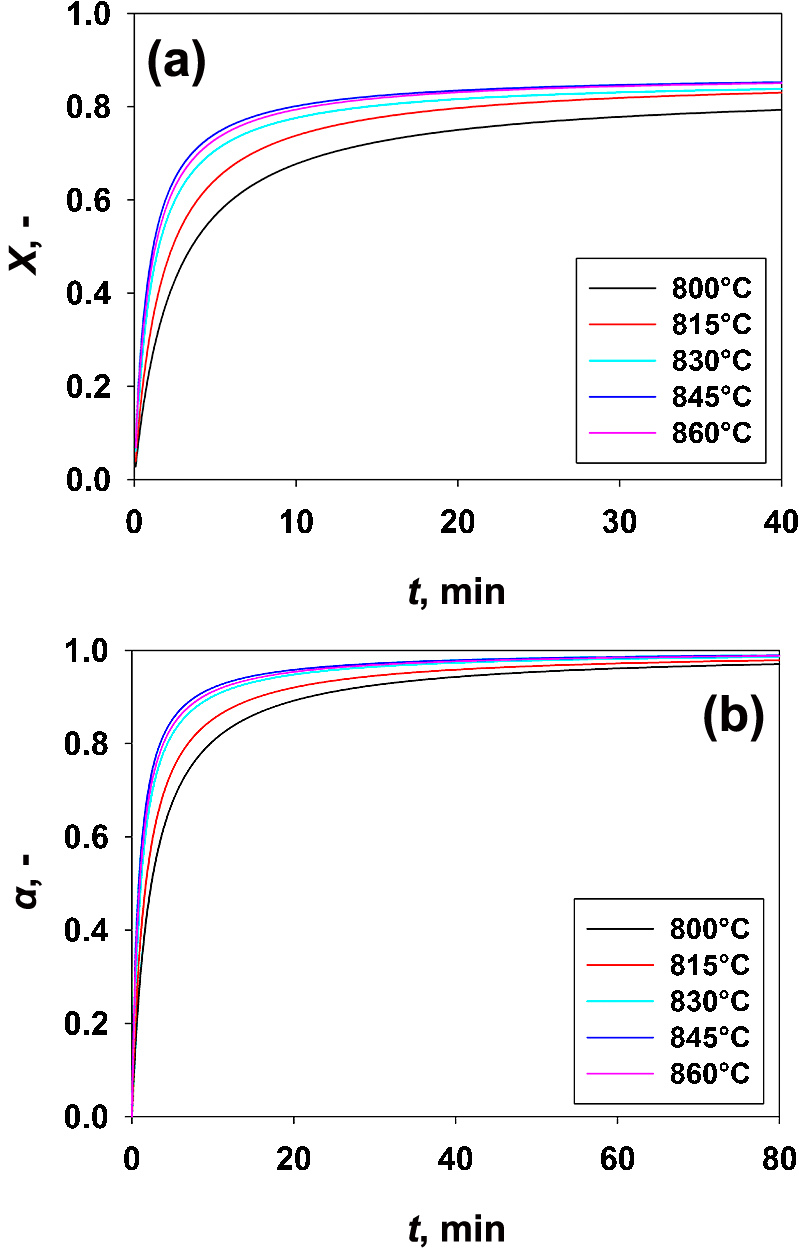
The results obtained in terms of time evolution of CaO carbonation conversion at different temperatures are reported in Fig. 2.
Clearly, the CaO carbonation rate varies with the evolution of the conversion degree, i.e. the reaction is kinetically-controlled at very small conversion values (stage A), whereas it is diffusion-controlled at larger conversion values (stage B). In particular, the reaction proceeds relatively fast at low levels of conversion degree, with the temperature strongly affecting the initial rates. After this initial stage, with the carbonation reaction going on and the conversion increasing and becoming closer to the ultimate conversion value, Xu, at which no more significant conversion is obtained at each temperature, the carbonation rate gets close to zero. More specifically, the dense product layer forming on the pore wall hinders the diffusion of the CO2 molecules through it and, therefore, the reaction continues to take place under diffusion control.
The tight link between the carbonation rate and the temperature has been more evidently highlighted plotting the extent of carbonation (α) (Fig. 1(b)), i.e. removing the effect of Xu which is itself temperature dependent.
Fig. 3 shows the plots of the experimental values of 1/X vs 1/t for the different temperatures. Then, the apparent reaction rates (rA and rB) and the ultimate conversion (XuA and XuB) have been evaluated (Fig. 3) from the slope and intercept of the two linear segments of the plot. In particular, XuA and XuB have been calculated as the values of carbonation conversion corresponding to the change of the slope and for 1/t tending to 0, respectively. It is clear that the experimental data reported in Fig. 3 follow a bi-linear pattern. The two different linear segments of the plots confirm the existence of stage A and stage B of the carbonation reaction, occurring under two different rate-controls (i.e. kinetic and diffusive controls).

As regards the fast kinetically controlled stage (stage A), it is evident, from the analysis of Fig. 4(a), that that the reaction rate does not monotonically increase with increasing temperatures. Indeed, increasing the temperature from 800 to 850 °C, rA, i.e. the rate of the fast carbonation stage, is increased according to the reaction kinetics being typically favored by increasing values of temperature. However, for temperature larger than 850 °C the carbonation rate decreases.

Therefore, rA reaches a maximum value at a certain temperature (845 °C); above this temperature, i.e. approaching the equilibrium temperature (870 °C), it gradually decreases. In accordance to thermodynamic principles and as clearly shown Fig. 1, the carbonation reaction occurs, at a certain temperature, for values of PCO2 larger than
P
CO
2
eq. In particular, at a fixed CO2 partial pressure,
P
CO
2
eq increases when the temperature is increased (Eq. (2)), thus leading to a decrease of
(
P
CO
2
-
P
CO
2
eq
), i.e. the thermodynamic pressure driving force; therefore, as typical of exothermic reactions, the carbonation reaction has the tendency to become thermodynamically unfavored with increasing temperatures (Fedunik-Hofman et al., 2019b; Sedghkerdar et al., 2015; Sun P. et al., 2008; Yin et al., 2014). In other words, increasing the temperature at fixed PCO2, the reverse reaction (calcination) tends to be favored thermodynamically as the equilibrium temperature is approached (870 °C) (Fedunik-Hofman et al., 2019b; Sedghkerdar et al., 2015; Sun P. et al., 2008; Yin et al., 2014).
This experimental evidence agrees with the data reported in (Ortiz et al., 2018) and (Kyaw et al., 1998) for the CaO/CaCO3 system when operated at the high temperatures useful for TCES, i.e. near equilibrium conditions. Clearly, the evidence that, at TCES-CSP operating conditions, the fast carbonation rate does not show a monotonic increasing trend when the temperature is increased is very important.
In particular, the temperature (845 °C) at which the reaction rate can be maximized is a key point for real applications. Indeed, it must be considered that the selection of the plant operating temperatures needs to be the result of a compromise between the kinetic and thermodynamic requirements. On the one hand, working at higher carbonation temperatures will enhance the power generation efficiency, in line with the second law of thermodynamics (Ortiz et al., 2018). But, on the other hand, working at temperatures approaching the thermodynamic equilibrium will eventually hinder the carbonation kinetics.
Also regarding stage A, of the carbonation reaction (namely the kinetics-controlled stage), it can be inferred from the corresponding linear segment of the plot (Fig. 3) that the ranges of data characterized by a linear correlation become narrower and narrower as the temperature is decreased from 845 °C (i.e. before the trend inversion caused by the thermodynamic equilibrium approach) to 800 °C. On the contrary, at lower values of temperature, the rate of the fast carbonation stage depends more on the diffusion limitation, thus moving away from the kinetic control even at lower values of carbonation conversion (Fig. 3). In fact, the carbonation reaction occurs mostly under kinetic control, i.e. almost up to the ultimate conversion (XuB), as the temperature is increased up to 845 °C, with less effect of the diffusion-controlled stage. This is also clearly inferable from Fig. 4(a), showing that the carbonation conversion achievable at the end of the kinetic-controlled stage (XuA), namely when the CaO conversion levels start to move away from the kinetic control, increases when the temperature is increased up to 845 °C. In contrast, XuA decreases with a further increase of the temperature. This agrees with the increase of the reaction rate when the temperature is increased up to 845 °C and with its decrease for larger values of the temperature. This same trend is also obtained for the extent of carbonation, α, which means that increasing the temperature up to 845 °C leads to an increase of the fraction of lime reacted in the fast kinetic-controlled stage, i.e. the fast carbonation stage provides a larger contribution to the global carbonation conversion.
The obtained non-linear dependence of ra on the temperature has been also linked to the critical product layer thickness, i.e. the values of product layer thickness at the end of stage A (Alvarez and Abanades, 2005), being maximum at 1000 °C (Fig. 4(c)). Evidently, the product layer thickness increases (from 301 to 342 nm) when the carbonation temperature is increased from 800 to 850 °C, namely for temperatures sufficiently away from the equilibrium temperature (i.e. before the inversion of the reaction rate caused by the thermodynamic limitations (Sun P. et al., 2008)). This result agrees with previous works available for the CaO/CaCO3 system even under different operation conditions (Abanades and Alvarez, 2003; Alvarez and Abanades, 2005; Biasin et al., 2015; Criado et al., 2018; Li Z. et al., 2012a,b; Mess et al., 1999). The explanation of this result can be found in a mechanistic kinetic study recently performed by Alvarez and Abanades (2005). The effect of the reaction temperature on the carbonation reaction has been studied through images of the CaO and CaCO3 surfaces reacting with CO2, obtained using atomic force microscopy. It was pointed out that larger product islands formed at higher carbonation temperatures, as a result of the diffusion of product molecules or ions becoming faster at higher temperatures (Alvarez and Abanades, 2005). Therefore, a bigger product layer tends to form at higher temperatures, thus enhancing the CO2 carrying capacity of CaO (Alvarez and Abanades, 2005).
As regards the slow carbonation stage, a monotonic increase with increasing temperatures has been observed (Fig. 4(b)), in agreement with the diffusion of CO2 molecules within the carbonate layer becoming more efficient at higher temperatures. It can also be inferred, from the analysis of Fig. 4(b), that, as the temperature is increased up to 845 °C, the carbonation reaction achieves greater conversion levels, even though, according to the thermodynamic principles, the carbonation reaction should be favored, thus resulting in greater conversion levels at lower temperatures. In fact, according to thermodynamics, higher final conversion should be achieved at lower temperatures. This is due to the exothermicity of the carbonation reaction and is in agreement with the fact that the thermodynamic driving force of the carbonation reaction
(
P
CO
2
-
P
CO
2
eq
) is reduced as the temperature gets close to the equilibrium temperature. However, even though in contrast to thermodynamic predictions, this result, which agrees with results previously reported on CaO carbonation (Bhatia and Perlmutter, 1983), is due to the enhancement of CO2 diffusion through the carbonate product layer at higher temperatures (Rouchon et al., 2013). On the contrary, at lower temperatures the diffusion becomes slower, thus hindering the achievement of larger ultimate conversions within reasonable time frames (Rouchon et al., 2013). Clearly, an excessive increase of temperature eventually ends up in decreasing the final conversion degree as the thermodynamic limitations outbalance the enhanced CO2 diffusional mobility.
Then, values of the rates obtained in the chemical reaction control regime (rA) have been used to evaluate the intrinsic rate constant (ks) and its temperature dependence between 800 and 850 °C, namely before the reaction rate is inverted due to thermodynamic limitations (Sun P. et al., 2008). In particular, the activation energy of the reaction, E, and the pre-exponential factor, k0, have been calculated (Fig. 5), thus obtaining the dependence of the intrinsic rate constant, ks, on the temperature in the temperature range of 800–850 °C:
|
k
s
=
3.56
×
10
-
2
exp
(
-
49.19
/
R
T
) | (13) |
The obtained activation energy (E = 49.19 kJ mol−1) for the carbonation reaction of the fine CaO is in line with data reported in the literature (Lee, 2004; Salaudeen et al., 2018).
Using the kinetic parameters obtained in the two carbonation reaction stages, the time evolution of the carbonation conversion has been evaluated, thus validating the results obtained from the kinetic analysis. In particular, the plots obtained applying the model equation, using the kinetic constants obtained in the stage A and B of the reaction, are shown in Fig. 6 in comparison with the experimental curves. Clearly, using the kinetic parameters obtained in the chemical reaction controlled regime makes it possible to fairly predict the initial stage of conversion, whereas, using the kinetic parameters obtained in the diffusion controlled regime makes it possible to predict well the last stage of conversion.
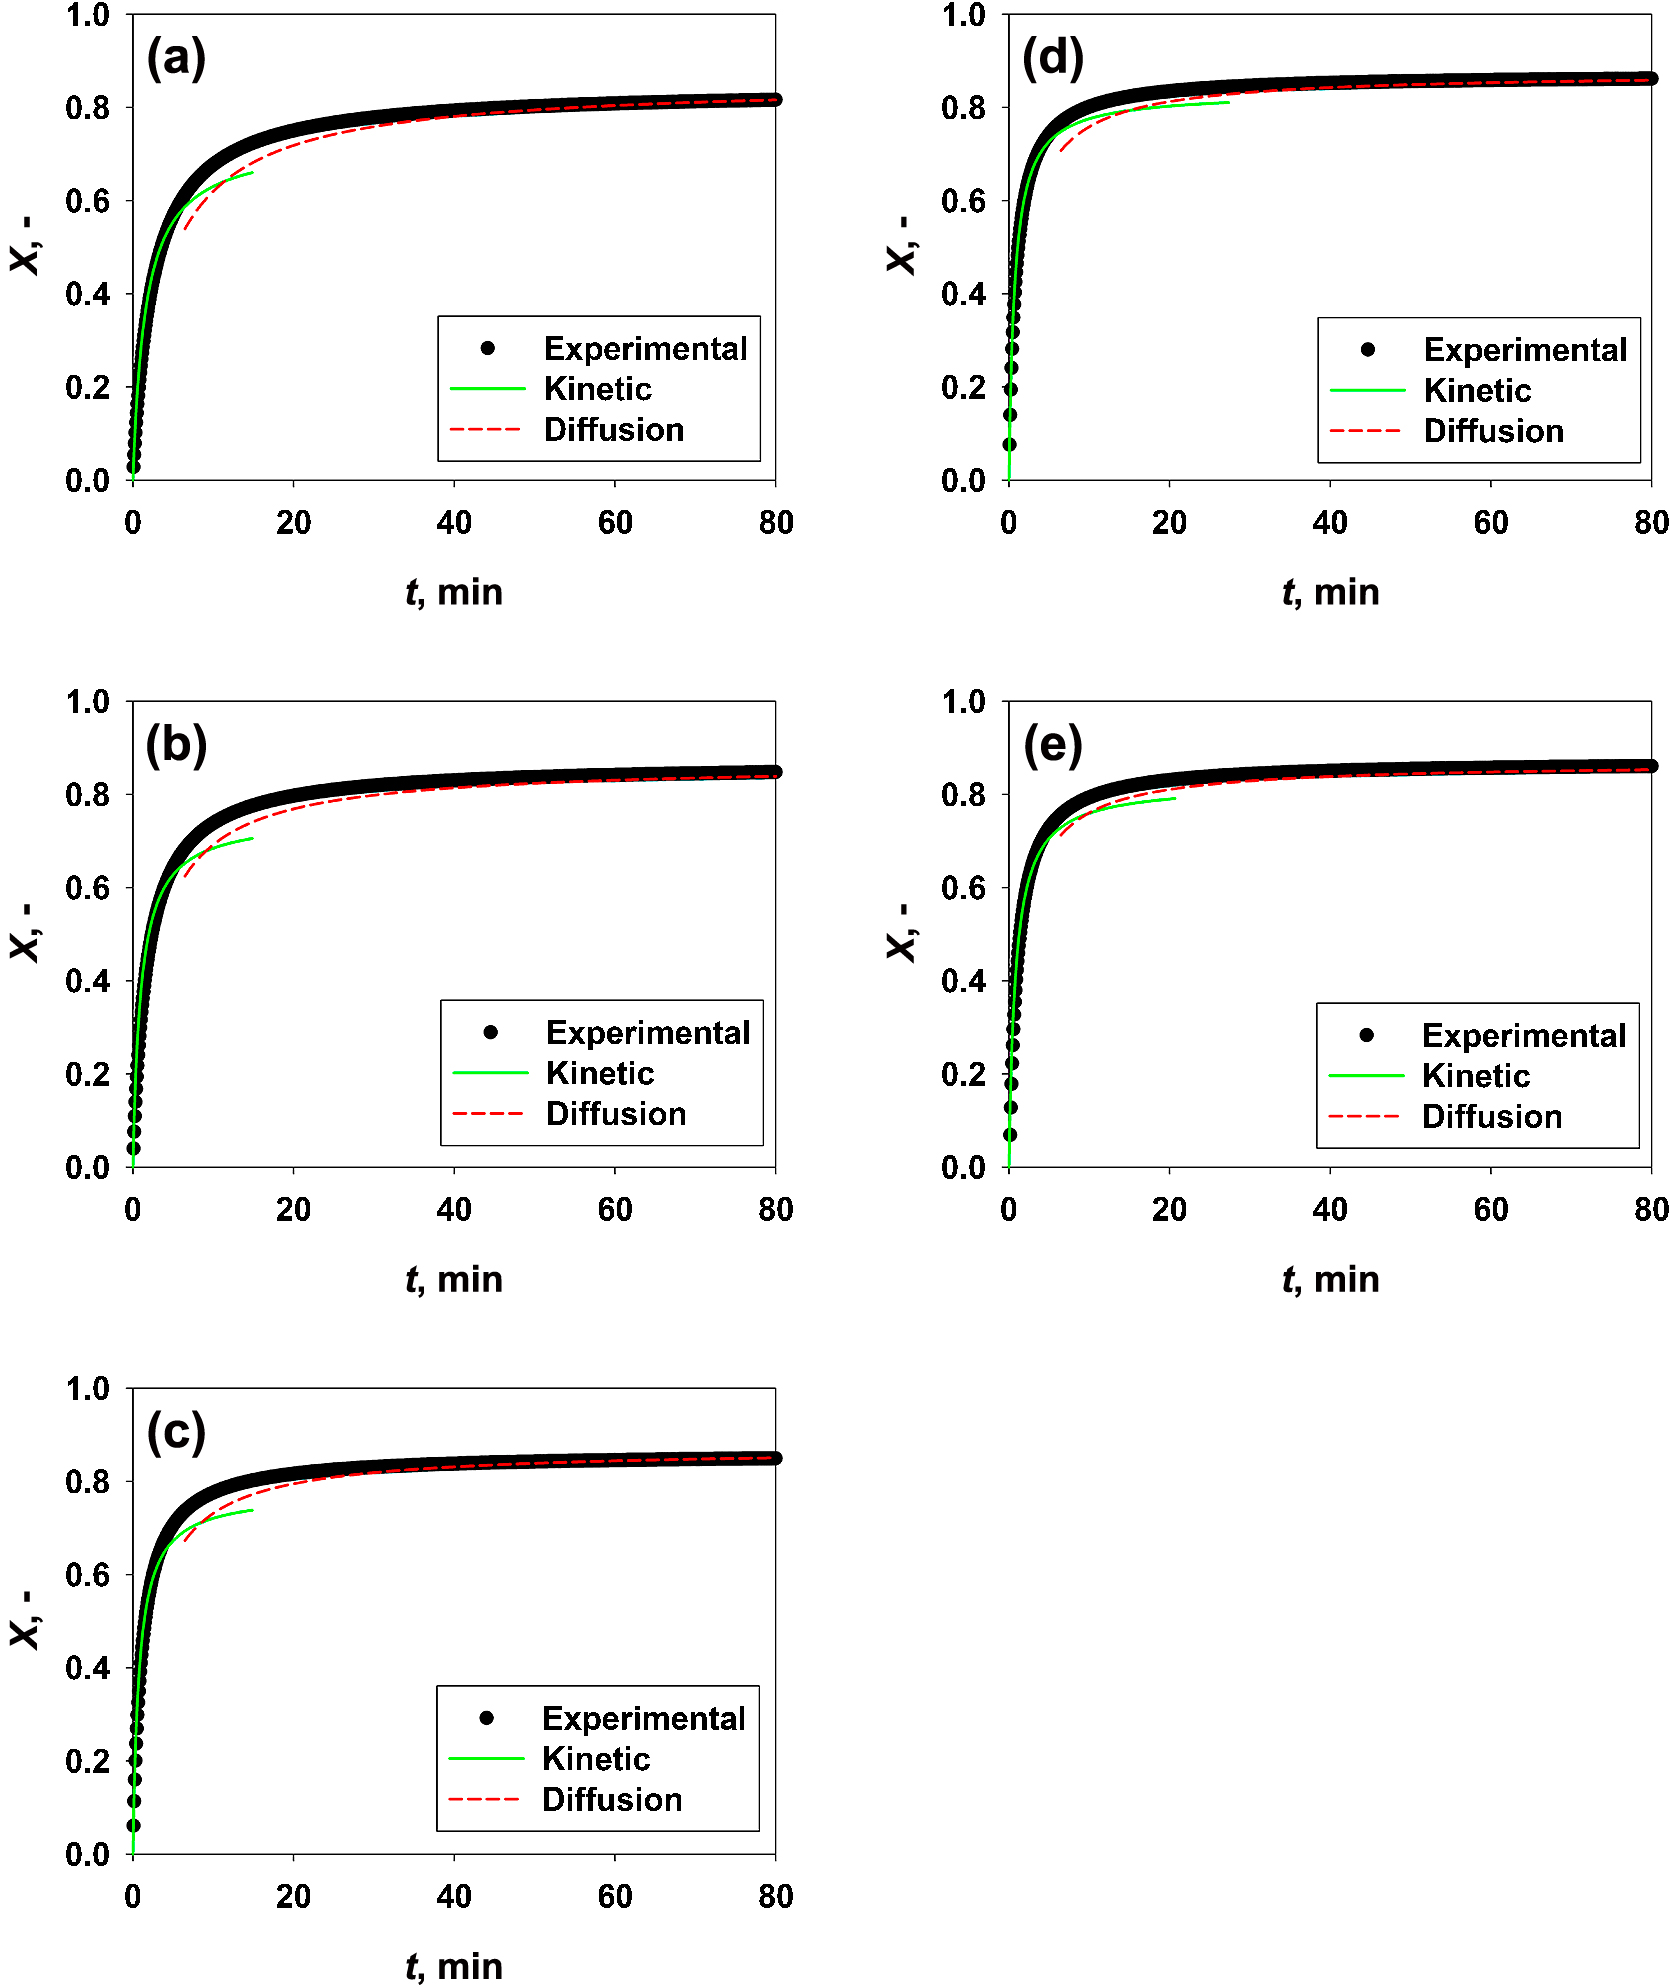
Therefore, there is not a unique kinetic constant able to properly describe the entire carbonation reaction, i.e. over the entire time frame. Indeed, there is always a period of time in which the carbonation reaction is influenced by both the chemical reaction between the CO2 molecules and the CaO surface and by the diffusion of CO2 through the solid layer. Considering that the proposed model can separately describe the two stages of the carbonation reaction with a rather good accuracy (i.e. the experimental data of the stage A and stage B agree well with the predicted values), the combination of the two different predictions, i.e. using the parameters separately obtained in the two control regimes, makes it possible to fairly describe the carbonation reaction in the entire time frame.
5. Conclusions
The carbonation kinetics of fine CaO particles (< 10 μm) has been investigated for TCES-CSP at realistic operating conditions, namely at high CO2 partial pressure and temperature (800–845 °C). Tests have been performed in a lab-scale sound-assisted fluidized bed and the carbonation kinetics has been analyzed using a simple apparent kinetic model. Then, the reaction rate, activation energy and the characteristic product layer thickness have been evaluated.
The main conclusions and observations derived from the kinetic study are:
-
•
At operating conditions functional for TCES-CSP applications, the rate of the fast carbonation reaction does not monotonically increase with the temperature. Indeed, the reaction rate reaches a maximum at 845 °C; above this temperature, i.e. approaching the equilibrium temperature, it gradually decreases.
-
•
XuA, i.e. the carbonation conversion at the end of the stage A, also increases when the temperature is increased up to 845 °C; on the contrary, it decreases when the temperature is increased further, in line with the trend observed for the reaction rate. This has been also related to the critical carbonate product layer, h, at the end of stage A, which also increases (from 301 to 342 nm) when the temperature is increased up to 845 °C.
-
•
The rate of the slow carbonation reaction monotonically increases with increasing temperatures, due to the enhancement of the diffusion of CO2 molecules within the carbonate layer at higher temperatures.
-
•
As the temperature is increased from 800 up to 845 °C, the carbonation reaction achieves higher ultimate conversion levels, in contrast to thermodynamics predicting greater conversion levels at lower temperatures. On the contrary, the final conversion degree is decreased for temperatures larger than 845 °C due to the fact that the thermodynamic limitations outbalance the enhanced CO2 diffusional mobility.
-
•
The intrinsic carbonation kinetic constant and its temperature dependence have been also evaluated between 800 and 845 °C; a value of 49 kJ mol−1 has been obtained for the activation energy.
The proposed model can separately describe the two stages of the carbonation reaction; therefore, the carbonation reaction can be fairly described in the entire time frame combining the two different predictions, i.e. using the parameters separately obtained in the two controlling regimes.
Acknowledgements
This work has been done in the framework of the project SOCRATCES, which has received funding from European Union’s Horizon 2020 research and innovation programme under the Grant Agreement no.727348.
References
- Abanades J.C., Alvarez D., Conversion limits in the reaction of CO2 with lime, Energy & Fuels, 17 (2003) 308–315. DOI: 10.1021/ef020152a
- Alvarez D., Abanades J.C., Determination of the critical product layer thickness in the reaction of CaO with CO2, Industrial & Engineering Chemistry Research, 44 (2005) 5608–5615.
- Ammendola P., Raganati F., Landi E., Natali Murri A., Miccio F., Kinetics of the carbonation reaction of an SrO-Al2O3 composite for thermochemical energy storage, Chemical Engineering Journal, 420 (2021) 129618. DOI: 10.1016/j.cej.2021.129618
- Ammendola P., Raganati F., Miccio F., Murri A.N., Landi E., Insights into utilization of strontium carbonate for thermochemical energy storage, Renewable Energy, 157 (2020) 769–781. DOI: 10.1016/j.renene.2020.05.048
- Ashraf W., Olek J., Carbonation activated binders from pure calcium silicates: reaction kinetics and performance controlling factors, Cement and Concrete Composites, 93 (2018) 85–98. DOI: 10.1016/j.cemconcomp.2018.07.004
- Benitez-Guerrero M., Valverde J.M., Sanchez-Jimenez P.E., Perejon A., Perez-Maqueda L.A., Calcium-looping performance of mechanically modified Al2O3-CaO composites for energy storage and CO2 capture, Chemical Engineering Journal, 334 (2018) 2343–2355. DOI: 10.1016/j.cej.2017.11.183
- Bhatia S.K., Perlmutter D.D., Effect of the product layer on the kinetics of the CO2-lime reaction, AIChE Journal, 29 (1983) 79–86. DOI: 10.1002/aic.690290111
- Biasin A., Segre C.U., Strumendo M., CaCO3 crystallite evolution during CaO carbonation: critical crystallite size and rate constant measurement by in-situ synchrotron radiation X-ray powder diffraction, Crystal Growth and Design, 15 (2015) 5188–5201. DOI: 10.1021/acs.cgd.5b00563
- Chacartegui R., Alovisio A., Ortiz C., Valverde J.M., Verda V., Becerra J.A., Thermochemical energy storage of concentrated solar power by integration of the calcium looping process and a CO2 power cycle, Applied Energy, 173 (2016) 589–605. DOI: 10.1016/j.apenergy.2016.04.053
- Criado Y.A., Arias B., Abanades J.C., Effect of the carbonation temperature on the CO2 carrying capacity of CaO, Industrial and Engineering Chemistry Research, 57 (2018) 12595–12599. DOI: 10.1021/acs.iecr.8b02111
- Durán-Martín J.D., Sánchez Jimenez P.E., Valverde J.M., Perejón A., Arcenegui-Troya J., García Triñanes P., Pérez Maqueda L.A., Role of particle size on the multicycle calcium looping activity of limestone for thermochemical energy storage, Journal of Advanced Research, 22 (2020) 67–76. DOI: 10.1016/j.jare.2019.10.008
- Fedunik-Hofman L., Bayon A., Donne S.W., Kinetics of solid-gas reactions and their application to carbonate looping systems, Energies, 12 (2019a) 2981. DOI: 10.3390/en12152981
- Fedunik-Hofman L., Bayon A., Donne S.W., Comparative kinetic analysis of CaCO3/CaO reaction system for energy storage and carbon capture, Applied Sciences (Switzerland), 9 (2019b) 5–9. DOI: 10.3390/app9214601
- Foo K.Y., Hameed B.H., Insights into the modeling of adsorption isotherm systems, Chemical Engineering Journal, 156 (2010) 2–10. DOI: 10.1016/j.cej.2009.09.013
- Goodbrake C.J., Young J.F., Berger R.L., Reaction of beta-dicalcium silicate and tricalcium silicate with carbon dioxide and water vapor, Journal of the American Ceramic Society, 62 (1979) 168–171. DOI: 10.1111/j.1151-2916.1979.tb19046.x
- Karasavvas E., Panopoulos K.D., Papadopoulou S., Voutetakis S., Design of an integrated CSP-calcium looping for uninterrupted power production through energy storage, Chemical Engineering Transactions, 70 (2018) 2131–2136. DOI: 10.3303/CET1870356
- Khawam A., Flanagan D.R., Solid-state kinetic models: basics and mathematical fundamentals, Journal of Physical Chemistry B, 110 (2006) 17315–17328. DOI: 10.1021/jp062746a
- Kyaw K., Kubota M., Watanabe F., Matsuda H., Hasatani M., Study of carbonation of CaO for high temperature thermal energy storage, Journal of Chemical Engineering of Japan, 31 (1998) 281–284. DOI: 10.1252/jcej.31.281
- Lee D., An apparent kinetic model for the carbonation of calcium oxide by carbon dioxide, Chemical Engineering Journal, 100 (2004) 71–77. DOI: 10.1016/j.cej.2003.12.003
- Li Z., Fang F., Tang X., Cai N., Effect of temperature on the carbonation reaction of CaO with CO2, Energy & Fuels, 26 (2012a) 2473–2482. DOI: 10.1021/ef201543n
- Li Z., Sun H., Cai N., Rate equation theory for the carbonation reaction of CaO with CO2, Energy and Fuels, 26 (2012b) 4607–4616. DOI: 10.1021/ef300607z
- Mess D., Sarofim A.F., Longwell J.P., Product layer diffusion during the reaction of calcium oxide with carbon dioxide, Energy and Fuels, 13 (1999) 999–1005. DOI: 10.1021/ef980266f
- Ortiz C., Valverde J.M., Chacartegui R., Perez-Maqueda L.A., Carbonation of limestone derived CaO for thermochemical energy storage: from kinetics to process integration in concentrating solar plants, ACS Sustainable Chemistry & Engineering, 6 (2018) 6404–6417. DOI: 10.1021/acssuschemeng.8b00199
- Ortiz C., Valverde J.M., Chacartegui R., Perez-Maqueda L.A., Giménez P., The calcium-looping (CaCO3/CaO) process for thermochemical energy storage in concentrating solar power plants, Renewable and Sustainable Energy Reviews, 113 (2019) 109252. DOI: 10.1016/j.rser.2019.109252
- Raganati F., Ammendola P., Sound-assisted fluidization for temperature swing adsorption and calcium looping: a review, Materials, 14 (2021) 672. DOI: 10.3390/ma14030672
- Raganati F., Ammendola P., Chirone R., Role of acoustic fields in promoting the gas-solid contact in a fluidized bed of fine particles, KONA Powder and Particle Journal, 32 (2015) 23–40. DOI: 10.14356/kona.2015006
- Raganati F., Chirone R., Ammendola P., Effect of temperature on fluidization of Geldart’s group A and C powders: role of interparticle forces, Industrial & Engineering Chemistry Research, 56 (2017) 12811–12821. DOI: 10.1021/acs.iecr.7b03270
- Raganati F., Chirone R., Ammendola P., Gas–solid fluidization of cohesive powders, Chemical Engineering Research and Design, 133 (2018) 347–387. DOI: 10.1016/j.cherd.2018.03.034
- Raganati F., Chirone R., Ammendola P., Calcium-looping for thermochemical energy storage in concentrating solar power applications: evaluation of the effect of acoustic perturbation on the fluidized bed carbonation, Chemical Engineering Journal, 392 (2020a) 123658. DOI: 10.1016/j.cej.2019.123658
- Raganati F., Chirone R., Ammendola P., CO2 capture by temperature swing adsorption: working capacity as affected by temperature and CO2 partial pressure, Industrial & Engineering Chemistry Research, 59 (2020b) 3593–3605. DOI: 10.1021/acs.iecr.9b04901
- Rouchon L., Favergeon L., Pijolat M., Analysis of the kinetic slowing down during carbonation of CaO by CO2, Journal of Thermal Analysis and Calorimetry, 113 (2013) 1145–1155. DOI: 10.1007/s10973-013-2950-5
- Salaudeen S.A., Acharya B., Dutta A., CaO-based CO2 sorbents: a review on screening, enhancement, cyclic stability, regeneration and kinetics modelling, Journal of CO2 Utilization, 23 (2018) 179–199. DOI: 10.1016/j.jcou.2017.11.012
- Sarrión B., Perejón A., Sánchez-Jiménez P.E., Pérez-Maqueda L.A., Valverde J.M., Role of calcium looping conditions on the performance of natural and synthetic Ca-based materials for energy storage, Journal of CO2 Utilization, 28 (2018) 374–384. DOI: 10.1016/j.jcou.2018.10.018
- Sedghkerdar M.H., Mostafavi E., Mahinpey N., Investigation of the kinetics of carbonation reaction with CaO-based sorbents using experiments and aspen plus simulation, Chemical Engineering Communications, 202 (2015) 746–755. DOI: 10.1080/00986445.2013.871709
- Seville J.P.K., Willett C.D., Knight P.C., Interparticle forces in fluidisation: a review, Powder Technology, 113 (2000) 261–268. DOI: 10.1016/S0032-5910(00)00309-0
- Stanmore B., Gilot P., Review—calcination and carbonation of limestone during thermal cycling for CO2 sequestration, Fuel Processing Technology, 86 (2005) 1707–1743. DOI: 10.1016/j.fuproc.2005.01.023
- Sun J., Bertos M.F., Simons S.J.R., Kinetic study of accelerated carbonation of municipal solid waste incinerator air pollution control residues for sequestration of flue gas CO2, Energy and Environmental Science, 1 (2008) 370–377. DOI: 10.1039/b804165m
- Sun P., Grace J.R., Lim C.J., Anthony E.J., Determination of intrinsic rate constants of the CaO–CO2 reaction, Chemical Engineering Science, 63 (2008) 47–56. DOI: 10.1016/j.ces.2007.08.055
- Valverde J.M., Acoustic streaming in gas-fluidized beds of small particles, Soft Matter, 9 (2013) 8792. DOI: 10.1039/c3sm50780g
- Yin J., Qin C., Feng B., Ge L., Luo C., Liu W., An H., Calcium looping for CO2 capture at a constant high temperature, Energy & Fuels, 28 (2014) 307–318. DOI: 10.1021/ef401399c
Nomenclature
E
activation energy of the intrinsic kinetic rate of the fast carbonation reaction
f(X)
reaction kinetic model
g(X)
integral form of the reaction kinetic model
h
thickness of the CaCO3 product layer at the transition between the fast and slow reaction periods
k0
pre-exponential factor of the intrinsic kinetic rate of the fast carbonation reaction
MCaO
molecular weight of CaO
PCO2
CO2 partial pressure
P
CO
2
eq
equilibrium CO2 partial pressure
S0
CaO specific surface per unit mass
t
time
rA
apparent reaction rate of stage A (min−1)
rB
apparent reaction rate of stage B (min−1)
X
carbonation conversion degree (−)
XuA
ultimate carbonation conversion degree at the end of stage A (−)
XuA
ultimate carbonation conversion degree at the end of stage B (−)
V
CaCO
3
M
CaCO3 molar volume
Greek lettersα
extent of carbonation conversion (−)
Authors’ Short Biographies
Federica Raganati

Federica Raganati received her degree in Chemical Engineering from the University Federico II of Naples (Italy) in 2010 and her PhD in Chemical Engineering from the same university in 2014. She has a permanent position as researcher at the Istituto di Scienze e Tecnologie per l’Energia e la Mobilità Sostenibili (STEMS) of the Consiglio Nazionale delle Ricerche (CNR). Her main research topics are the set-up of innovative fluidized bed reactor configurations, the reduction of CO2 emissions through post-combustion capture processes and the energy storage through thermochemical processes. She is the author of 3 patents and about 80 papers published in peer-reviewed international journals or proceedings of national/international conferences.
Paola Ammendola

Paola Ammendola received her degree in Chemical Engineering from the University Federico II of Naples (Italy) in 2003 and her PhD in Chemical Engineering from the same university in 2006. She has a permanent position as researcher at the Istituto di Scienze e Tecnologie per l’Energia e la Mobilità Sostenibili (STEMS) of the Consiglio Nazionale delle Ricerche (CNR). Her main research topics are the sound-assisted fluidization of cohesive powders, the set-up of innovative catalytic systems and the use of fluidized bed reactors for clean energy production and the study of renewable energy sources (solar energy and biomass). She is the author of 5 patents and about 150 papers published in peer-reviewed international journals or proceedings of national/international conferences.


;%0A%09%09%09newWindow.document.open();%0A%09%09%09newWindow.document.write('<img src=%22./Graphics/39_2022007_07.jpg%22>');%0A%09%09%09newWindow.document.close();%0A%09%09)
;%0A%09%09%09newWindow.document.open();%0A%09%09%09newWindow.document.write('<img src=%22./Graphics/39_2022007_08.jpg%22>');%0A%09%09%09newWindow.document.close();%0A%09%09)