Original Research Papers
Simulation of the Classification of Manufactured Sands in the Throat Air Classifier

2024 年 41 巻 p. 242-253

詳細
2024 年 41 巻 p. 242-253
The scarcity of natural sands has triggered a considerable increase in the consumption of manufactured sands for concrete production. In this regard, particle flaking and excessive fines are the main problems that should be addressed when utilizing manufactured sands. The throat classifier is an air classifier designed for the elimination of fine particles (smaller than 75 micrometers) from manufactured sands. The main features of the classifier have been presented in the literature, but the mechanism that drives the classification has not been studied in detail. Therefore, this work explores the mechanism of classification of the throat classifier by using CFD-DPM and CFD-DEM simulations. The accuracy and limitations of the methodologies were evaluated by comparing the results against experimental data obtained at the pilot scale. The simulations presented fair results in the representation of the airflow and the particle classification inside the throat classifier. Differences between the predictions using CFD-DPM and CFD-DEM methodologies under the simulated conditions were found to be negligible. The results of the simulations allowed for a more detailed understanding of the classification mechanism that occurs inside the device and the influence of operational variables on the equipment performance.
The worldwide growth of population and wealth has triggered an increase in the construction of housing, facilities, service cities, and infrastructure. The new urban building environment (drinking water and sanitation, public transport, roads, etc.) is demanding large volumes of building materials such as aggregates, cement, ceramics, lime, gypsum, glass, wood, steel, aluminum, and plastic. The demand for such enormous volumes of natural resources is affecting the sustainability of these industrial sectors (OECD, 2019). Among the building materials, concrete and mortar are the most widely used, both consisting of cement, aggregates, and water. Cement production represents about 5 % of the global CO2 emissions worldwide. Therefore, the cement and concrete industries are developing new approaches to increase production with a lower carbon footprint and less usage of natural resources. The main goal is to achieve net-zero emissions by 2050 (GCCA, 2022). Despite cement, aggregates also play an essential role in the eco-efficiency of concrete; nearly 75 % of the concrete volume is represented by coarse and fine aggregates (Tatari and Kucukvar, 2012). Aggregates can be natural (gravel or river sand) or manufactured (crushed stone or manufactured sand). At the beginning of this century, governments and academic communities were on alert about the depletion of natural sources of sand and its increasing scarcity (Torres et al., 2017; UNEP, 2014). Manufactured sands had been found to be an alternative for river sands (Donza et al., 2002; Goncalves et al., 2007); thus, the replacement of natural sands by manufactured sands became an intense research subject ever since.
There are two main shortcomings for the application of manufactured sands in concrete: the particle shape and the high content of dust. Manufactured sands are produced by crushing and sieving during coarse aggregate production. The angular shape (sometimes flaky) of manufactured sand particles causes a low packing density, increasing the water demand and affecting the rheology of the mortar or concrete (Cepuritis et al., 2016; 2017). The content of dust is defined as the percentage of particles smaller than 75 μm in the sands. It increases the water demand for mortar and concrete and enhances other problems such as particulate matter emissions during handling (Petit et al., 2021) and inhomogeneity of the stock due to humidity. The performance of mortar and concrete constituted by manufactured sands can be improved by reducing the content of dust and the flakiness of the sand particles (Ramos et al., 2013). Water-washers are generally used for the elimination of dust. Although water-washers are effective, they have several problems such as unwanted sewage in the quarries, unsellable wastes, final wet products, and a large water footprint (Aasly et al., 2014).
New dry processes, such as magnetic (André et al., 2019) or air classification (Peng et al., 2022), can avoid the use of water for dedusting manufactured sands. A novel classifier, the throat classifier, was explicitly developed for the dedusting of manufactured sands (Petit and Irassar, 2021). Its design focuses on simplicity of operation, reduction of energy consumption, and low maintenance. In this machine, the manufactured sand is fed using a conveyor belt and classified into three products with different gradations. The advantage of this classifier is that the dust extracted from the manufactured sand remains dry and can be stored in a silo for later use as filler in cement, mortar, and concrete (Di Salvo Barsi et al., 2020), or other industrial applications such as filler in the plastic industry (Passaretti et al., 2019; Tawfik et al., 2022). The throat classifier was tested at pilot scale as a replacement for water-washers, giving excellent results (Petit et al., 2018a). However, detailed knowledge about the airflow and particle classification occurring inside the device is needed to improve its design. In this regard, Computational Fluid Dynamics (CFD) and the Discrete Phase Method (DPM) can be used to simulate the airflow and classification mechanism inside the chamber (Petit et al., 2020; Stone et al., 2019). However, this approach has limitations for systems where the concentration of solids is high and particle–particle interactions are of critical importance. The Discrete Element Method (DEM) is similar to the DPM method but takes into account the particle–particle interactions at the micro level, thus representing the bulk behavior of the granular flow (da Cunha et al., 2013).
In this paper, the airflow and particle classification inside the throat classifier were simulated using the CFD-DPM approach. The accuracy and limitations of the simulation methodology were evaluated. Elements of the DEM method were incorporated into the CFD-DPM methodology to compare the results and assess the necessity of modeling particle–particle interactions. The airflow behavior and classification mechanisms inside the throat classifier were studied and visualized by analyzing the simulation results, improving the understanding of the influence of the main operational variables on the classification mechanisms and complementing the knowledge obtained by previous experimental studies.
A scheme of the throat classifier is presented in Fig. 1 (Petit, 2018; Petit and Irassar, 2021). The classifier presents two classification chambers separated by an inclined plate and a vertical deflector. The right-side chamber is the primary chamber, while the left-side chamber is the secondary chamber. The space between the vertical deflector and the edge of the inclined plate is called the throat and is the region where the primary classification takes place. The primary classification at the throat is performed by an air stream that classifies particles according to their aerodynamic diameter. The airflow that passes through the throat is composed of a main airflow and an auxiliary airflow. The main airflow enters the classifier through the primary inlet at the top of the primary chamber, while the auxiliary airflow enters the classifier through the auxiliary air inlet located at the bottom of the primary chamber. Both, the main and auxiliary airflows, merge at the throat and flow towards the secondary classification chamber. The auxiliary airflow is used to improve the performance of the classifier and its use is optional. Therefore, the auxiliary air inlet can be closed using the adaptable hopper. The manufactured sand enters the classifier through the main air inlet at the top. Sand particles fall by gravity and impact against the inclined plate. Coarse particles bounce after the impact, while fine particles slide over the inclined plate. All particles reach the edge of the inclined plate with different inertia, depending on the segregation and percolation that takes place on the inclined plate. Particles are then classified by the airflow at the throat. Coarse particles are less sensitive to the drag force and fall to the bottom of the primary chamber, while fine particles are dragged by the airflow to the secondary chamber. If the auxiliary airflow is used, coarse particles exit the classifier as the primary product through the primary product outlet. Otherwise, the primary product is collected in the adaptable hopper. The fine particles that were dragged to the secondary chamber experience a secondary classification. The airflow reduces its velocity in the secondary chamber, causing some of the particles to settle at the bottom and to be collected in the secondary hopper as the secondary product of the classification. Particles that did not settle in the secondary chamber exit the classifier with the air and are collected in an auxiliary equipment such as a cyclone classifier or a bag filter. These particles represent the tertiary product of the classification. The performance of the classifier is controlled by adjusting the velocity of the airflow and the position of the vertical deflector. The position of the deflector is characterized by a set of coordinates (d and D) set on the edge of the inclined plate with the y-axis direction pointing downwards, as shown in Fig. 1.

Scheme of the throat classifier (Petit et al., 2019), and illustration of its main classification mechanism. Stations 1–4 locate the measurements of the air velocity profiles.
Two experimental studies are presented in this work. The first study was performed to characterize the airflow inside the equipment and to obtain validation data to be compared to the results of the CFD simulations. In this regard, the main variables of interest are the pressure loss and the air velocity at specific positions inside the equipment. The pressure loss was measured with a differential manometer; the first measurement point was set at the exit tube of the classifier and the second at an arbitrary point outside the equipment. Hence, the pressure loss accounts for the loss of energy inside the equipment and the loss due to the acceleration of the atmospheric air while entering the classifier. The velocity inside the equipment was measured using a Pitot tube. Velocity profiles for the air were measured at four different stations, as presented in Fig. 1. Station 1 was set to measure the velocity profile inside the exit tube. Stations 2 and 3 were set at the inlet of the classifier. Station 4 was set perpendicular to the inclined plate, near the throat, in order to study the velocity profile near the classification zone. The measurement of the velocity profile at the throat was not possible due to the relatively large dimensions of the Pitot tube, so only the mean air velocity was measured at the throat.
The second study was carried out to characterize the classification of sand particles using different set-ups for the operational variables of the classifier. The obtained data were then used to validate the results of the CFD-DPM and CFD-DEM simulations. The classification study consisted of three classification cases that differed in the position of the vertical deflector (P), the velocity at the throat (uth), and the utilization of the auxiliary air inlet (A), as presented in Table 1. Two different positions were used for the vertical deflector. Position P = 1 is determined by the coordinates D = 0.08 m and d = 0.02 m and position P = 2 by the coordinates D = 0.02 m and d = −0.02 m (Fig. 1). Cases 1 and 2 differ in the utilization of the auxiliary air inlet, A = closed for case 1, while A = open for case 2. Granitic manufactured sand was used for the study, presenting a solid density of 2630 kg/m3, a dust content of 14.59 %, and a moisture content of 0.24 %. Compared to the standard limits for fine aggregates in concrete (ASTM C33, 2018) (Fig. 2), the manufactured sand presents an excess of material passing the 300 μm. For each case of study, 1 kg of granitic manufactured sand was fed to the classifier at a constant rate of 80 kg/h. After the classification, the primary and secondary products of the classification were characterized by sieving analysis. The partition curve and the cut sizes were computed by comparing the particle size distribution (PSD) of the products and the feed. These cases were selected from a more complete study that the reader may find in previous works by the authors (Petit, 2018; Petit and Irassar, 2021).
Cases of study for the classification experiences.
| Case | Position (P) | uth [m/s] | Aux. Inlet (A) |
|---|---|---|---|
| 1 | P1 | 3.80 | closed |
| 2 | P1 | 3.20 | open |
| 3 | P2 | 7.75 | closed |
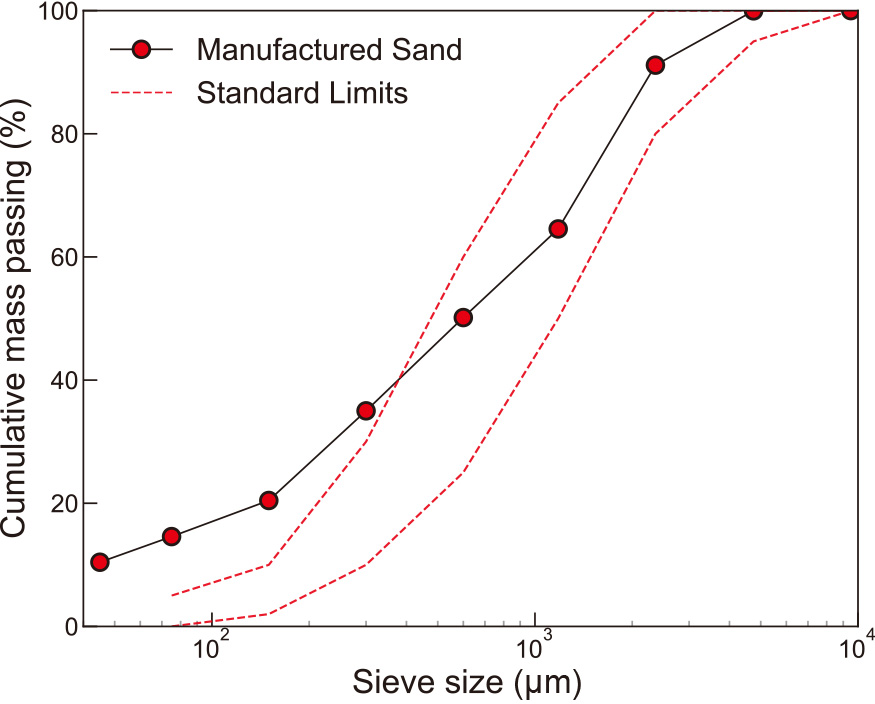
PSD of the granitic manufactured sand and comparison against the standard limits (ASTM C33, 2018).
The numerical method used for the simulation has been used previously by the authors in the simulation of similar air classifiers (Petit and Barbosa, 2017; Petit et al., 2018b, 2020). An overall description of the simulation methodology is presented here, but the reader may find the full description of the model in the supplementary materials. The air was treated as a continuum phase, and the turbulent flow was simulated by solving the Unsteady Reynolds Averaged Navier-Stokes equations. These equations require a closure model for the computation of turbulence, so two different turbulence models were assessed in this work. The first model is the realizable k − ɛ model which uses conservation equations for the kinetic turbulent energy (k) and the turbulent dissipation rate (ɛ). The second model is the Reynolds Stress Model, which is defined by a transport equation for the Reynolds stress tensor.
Particles were modeled as a discrete phase using a Lagrangian reference frame. Particles were grouped to form what is known as parcels, groups of particles with the same size. The trajectory of each parcel was computed in a similar manner as that of a single particle, using the common particle size of the parcel. The positions of all particles that form the parcel were updated based on this trajectory, thus reducing computation time. The mass flow rate of the parcel is given by the number of particles times the mass of the component particles. The trajectories of the parcels were predicted by integrating the force balance, accounting for the gravity and drag forces. Manufactured sand particles present irregular and flaky particles (Rolny et al., 2015; Johansson and Evertsson, 2014); therefore, the drag coefficient was computed using the Haider and Levenspiel model (Haider and Levenspiel, 1989). The shape factor (ratio between the surface area of a sphere having the same volume as the particle and the actual surface area of the particle) was computed using an optical microscope, presenting the mean value of ϕ = 0.7. The effect of turbulence on the particle trajectories was taken into account by using the Random Walk–Eddy Lifetime model. The discrete phase exchanges momentum with the continuum phase through a momentum source term in the momentum equations of the fluid phase.
Air classifiers are generally operated at low solid concentrations. However, in the case of the throat air classifier, the concentration of particles is high near the inclined plate and the throat. Particle–particle interactions may present an additional influence on the classification mechanism. If relevant, a proper model for the particle–particle interaction should be used. One way to assess the relevance of the particle–particle interactions was proposed by Elghobashi (1994) and then used by Greifzu et al. (2016). The assessment is carried out by defining the volume fraction occupied by the particles (αP) and the ratio between the particle reaction time (τP) to the Kolmogorov (τκ). However, the particle-laden flow inside the throat classifier cannot be easily labeled based on these parameters. The concentration of particles is high in the incline plate where most particle–particle collision occurs. The concentration of solids diminishes away from the throat and becomes negligible further away from this region. Moreover, the sizes of the manufactured sand particles range from a few microns to a few millimeters, changing the values of the particle reaction time by four orders of magnitude. The reader may find more details about this assessment in the supplementary materials or in Petit (2018). To summarize: a DEM model was used in order to account for particle–particle interactions and to assess the necessity of a four-way coupled simulation under the tested conditions.
Collisions between particles were computed based on the work of Cundall and Strack (1979). The normal force acting on a particle experiencing a collision was represented by a spring-dashpot model, which is defined by a spring constant (K) and a damping coefficient (γ). The force acting on the second particle was computed using the Newton’s third law. On the other hand, the tangential forces were computed by using the Coulomb law of friction, defined by a friction coefficient (μf). Collisions between the particles and the geometry were modeled by assuming a coefficient of restitution for the impact, which was decomposed into a normal (CN) and tangential contribution (CT). The methodology proposed for the modeling of the particle–particle interactions is an extension of the DPM method that was solved using the built-in capabilities of the CFD solver and presents several limitations such as the lack of particle rotation and rolling friction effects. However, these effects can be considered secondary when particles are inside a high-velocity flow. Moreover, the calibration of the DEM parameters is not as simple as the calibration of a full DEM method due to the influence of the continuum phase. Therefore, the values of the DEM parameters (Table 2) were estimated based on reported values for similar systems (Chu and Yu, 2008; Traoré et al., 2015; Zhou et al., 2014; Boemer and Ponthot, 2016). These values were used in the simulations of different air classifiers, giving fairly realistic results (Petit and Barbosa, 2017; Petit et al., 2018b, 2020).
DEM parameters used in the present work.
| Parameter | Units | Value |
|---|---|---|
| Spring constant (K) | N/m | 1 × 10⁻⁵ |
| Damping coefficient (γ) | — | 0.9 |
| Friction coefficient (μf) | — | 0.3 |
| Normal restitution (CN) | — | 0.3 |
| Tangential restitution (CT) | — | 0.7 |
A mesh independence study was carried out using a coarse, a medium and a fine mesh. Each structured mesh consisted of approximately 3 × 10⁵, 5 × 10⁵, and 7 × 10⁵ elements, respectively. Mesh refinement was done progressively, paying special attention to the region near the throat where the largest gradients of velocity and pressure are present. The pressure-inlet condition was used at the inlet, the air outside the classifier was set to an arbitrary relative static pressure of PR = 0. The same boundary condition was applied at the auxiliary air inlet when it was open. The pressure-outlet boundary condition was used on the outlet face where a negative static pressure was set according to the measured pressure loss of the current case study. The no-slip boundary condition and standard wall functions were used at the walls of the classifier. All simulations were carried out by following the same procedure. First, the CFD simulation of the airflow was performed using a second-order transient solver. The time step used for the fluid equations was Δt = 2 × 10⁻⁴ s. The simulations were continued until the airflow inside the classifier reached a steady state condition. Secondly, particles were injected into the fluid using the DPM or DEM method. The simulations were resumed, and the trajectories of the particles were updated for every fluid time step using the trapezoidal rule for the temporal integration. In the case of the DEM method, the particle time step was set two orders of magnitude smaller than the fluid time step. The simulations were continued until all particles in the domain escaped or settled in the hoppers. Finally, the positions of the remaining particles were used to calculate the classification efficiency.
The results of the CFD simulations for case 1 are presented in Fig. 3, and compared against the measured velocity profiles measured at the four stations. The overall results present a fair agreement with the experimental values. It can be observed that the velocity profile of Station 1 is underpredicted, the utilization of a more refined mesh or a different turbulence model did not improve the results. Compared to the values of Station 1, the profiles obtained in Stations 2 and 3 present a better agreement with the experimental values and a better estimation of the velocity. However, the value of the velocity near the walls presents differences with the experimental values, which can be attributed to the limitations of the Pitot tube used for the measurements for such low velocities. In the case of Station 3, the positive values of the velocity near the walls could not be measured with the available measurement device. Similarly to Station 1, the utilization of a refined mesh or the RSM turbulence model did not improve the results in Stations 2 and 3. The results for Station 4 present the worst agreement between simulations and experiments. The velocity near the inclined plate is severely underpredicted and the same occurs for distances from the plate (ℓ⊥) greater than 0.03 m. A slight improvement in the results is obtained by using a refined mesh but is not sufficient to compensate for the increase in the computational effort. This region of the classifier is of great importance for an accurate modeling of the classification mechanism. The results show that the boundary layer of the flow near the throat, at the end of the inclined plate, is not accurately modeled by using the proposed approach. In addition, the utilization of a more complex turbulence model does not correct this major limitation of the simulation set-up. Other alternatives such as the utilization of different coupling algorithms (PISO instead of SIMPLEC), or different discretization schemes (QUICK scheme instead of second-order upwind scheme) were tested without any improvements (Petit, 2018). A more accurate approach may be to switch the first cell height from y+ ≈ 30 to y+ ≈ 1 and to resolve the boundary layer instead of modeling it by using wall functions. However, this approach would demand a computational effort that could not be matched by the available computational power at the time of the study. The same stands for the utilization of more complex turbulence models such as LES. Therefore, the limitations of the current methodology were assumed and further simulations were performed using the coarse mesh and the realizable k − ɛ model.

Comparison between the experimental data (○) and the CFD predictions for case 1, using the coarse (
 ), medium (
 ), and fine (
 ) meshes and the realizable k − ɛ turbulence model. Values obtained with the Reynolds stress model and the fine mesh (×) are also presented. Error bars represent minimum and maximum values while ℓ⊥ and u|| represent the normal distance to the wall and the velocity parallel to the wall, respectively.
The results of the CFD simulations, in terms of the pressure loss for the classifier, are presented in Fig. 4. The simulations were performed using the two different positions of the vertical deflector, with and without the auxiliary airflow. For each condition, the simulations were run using: −200, −115, −70, −35 and −10 Pa for the outlet boundary condition. Then, the velocity at the throat was computed for comparison against the experimental values. The simulations results present a fair agreement with the experimental values. Both the experimental and numerical results predict a higher pressure loss when the auxiliary air inlet is closed. The pressure loss obtained by simulations is overpredicted in almost all conditions. For P = 1, the pressure loss predicted by CFD is considerably higher than that observed experimentally. These differences are higher when the auxiliary air inlet is closed with errors as high as 20 %. For the same position, the error committed when the auxiliary air inlet is open is smaller, being as high as 14 %. For position P = 2, the error is smaller than that observed for position P = 1, as high as 5 %. In this position, the simulations overestimate the pressure drop when the auxiliary air inlet is closed and underestimate the loss when the auxiliary air inlet is open. Fig. 3 shows that the simulation cannot represent in full extent the acceleration of the flow near the throat, which impacts on the conversion of mechanical energy in the flow and the computation of the energy losses. Other sources of error can be attributed to the numerical diffusion, the unresolved boundary layer near the wall and the effect of adverse pressure gradients.
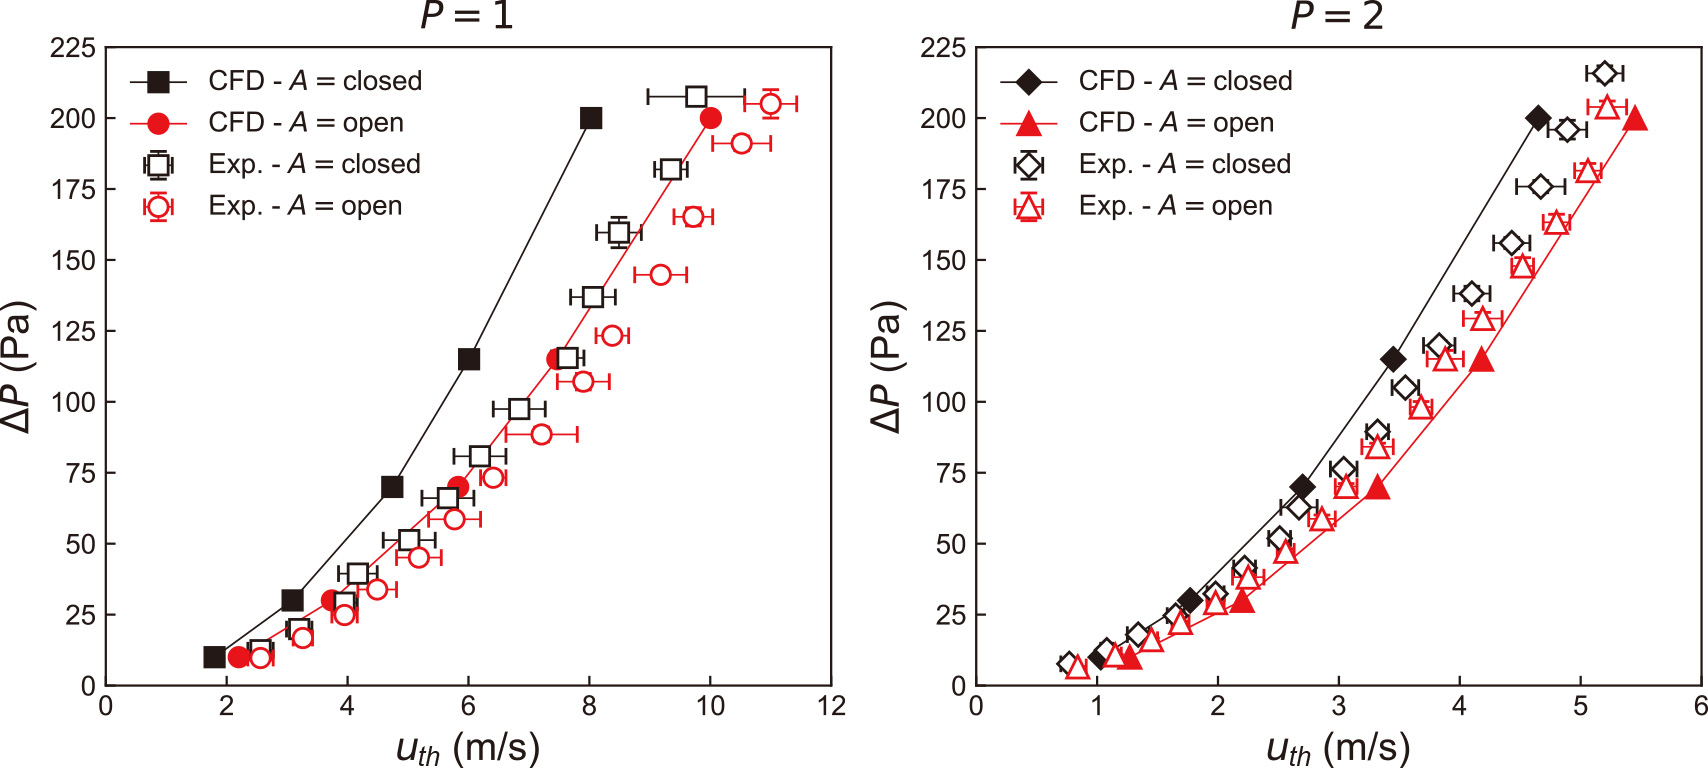
Comparison between the experimental data and the CFD predictions for the pressure loss for different conditions.
Despite the limitations of the methodology, the utilization of the CFD simulations can be used to gain valuable insights about the behavior of the flow field inside the classifier. Contours of velocity magnitude for different conditions for the airflow inside the classifier are presented in Fig. 5. The results are presented for a pressure boundary condition of −200 Pa, and velocity contours for different pressure conditions presented a self-similar behavior. The trajectory of the airflow inside the classifier can be clearly identified. It can be observed that the behavior of the airflow is different depending on the position of the vertical deflector and the utilization of the auxiliary airflow. Therefore, differences in the classification of particles are expected due to the different flow behavior. For position P = 1 and the auxiliary air inlet closed, the airflow enters at the primary inlet and accelerates towards the throat. The airflow reaches the end of the inclined plate and changes its direction almost 180°, describing a U-shaped trajectory and entering the secondary chamber. Secondary flows can be observed near the main flow on both sides of the vertical deflector, which are stronger in the secondary chamber and may affect the secondary classification. For position P = 2, the velocity patterns are similar to those observed for position P = 1. However, the change of direction at the throat for position P = 2 is more abrupt. The air still changes its direction about 180° but the radius of the swirl is smaller than that observed for position P = 1. The flow area of the throat is smaller for position P = 2; therefore, the air velocity is higher.

Contours of velocity magnitude for the throat classifier for two different positions of the vertical deflector (P = 1 and P = 2), with and without the utilization of the secondary air inlet (A = open and A = closed, respectively).
The utilization of the auxiliary airflow modifies the flow pattern, as the contribution of the ascending stream of air in the primary chamber decreases the contribution of the primary airflow entering at the top. Both streams merge at the throat as expected. However, the trajectory of the airflow entering the secondary chamber changes with the presence of the auxiliary airflow. In the case of position P = 1, the air entering the secondary chamber describes a smoother trajectory when the auxiliary airflow is present. In addition, the presence of secondary flows in the secondary chamber is reduced, thus expecting a cleaner secondary classification. These changes are not as clear for position P = 2; nonetheless, the influence of the auxiliary airflow on the velocity pattern at the throat can still be observed. The upward auxiliary airflow at the bottom of the primary chamber suggests that particles that could not be classified at the throat may experience a second counter-current classification in this region; therefore, improving the classifier performance.
The velocity contours show that the main pressure loss is due to the strangulation of the airflow at the throat. Therefore, position P = 2, with a smaller flow area presents higher pressure drops than that observed for position P = 1. The utilization of the auxiliary airflow reduces the swirl intensity of the flow at the throat; therefore, cases with the auxiliary air inlet open present less energy dissipation and lower pressure losses. In this regard, the conclusions drawn from the observation of the velocity contours match the trends in the experimental values presented in Fig. 4.
3.2 CFD-DPM and CFD-DEM resultsSnapshots of the particle positions, obtained by CFD-DPM simulations, for the three case studies are presented in Fig. 6. It can be observed that the feed (sand) falls through the inlet creating a curtain of particles. The behavior of the feed varies depending on the flow conditions. It can be observed in cases 1 and 3 that after entering the classifier, fine particles are dragged by the airflow and reach the end of the inclined plate before coarse particles. This behavior is observed in cases 1 and 3 where the auxiliary air inlet is closed and the primary airflow moves downward with high velocity. On the other hand, the auxiliary air inlet is open in case 2 and the contribution of the primary air inlet is less intense. Thus, the segregation of fine particles due to the high velocity of the primary airflow in case 2 is not as clear as in cases 1 and 3.
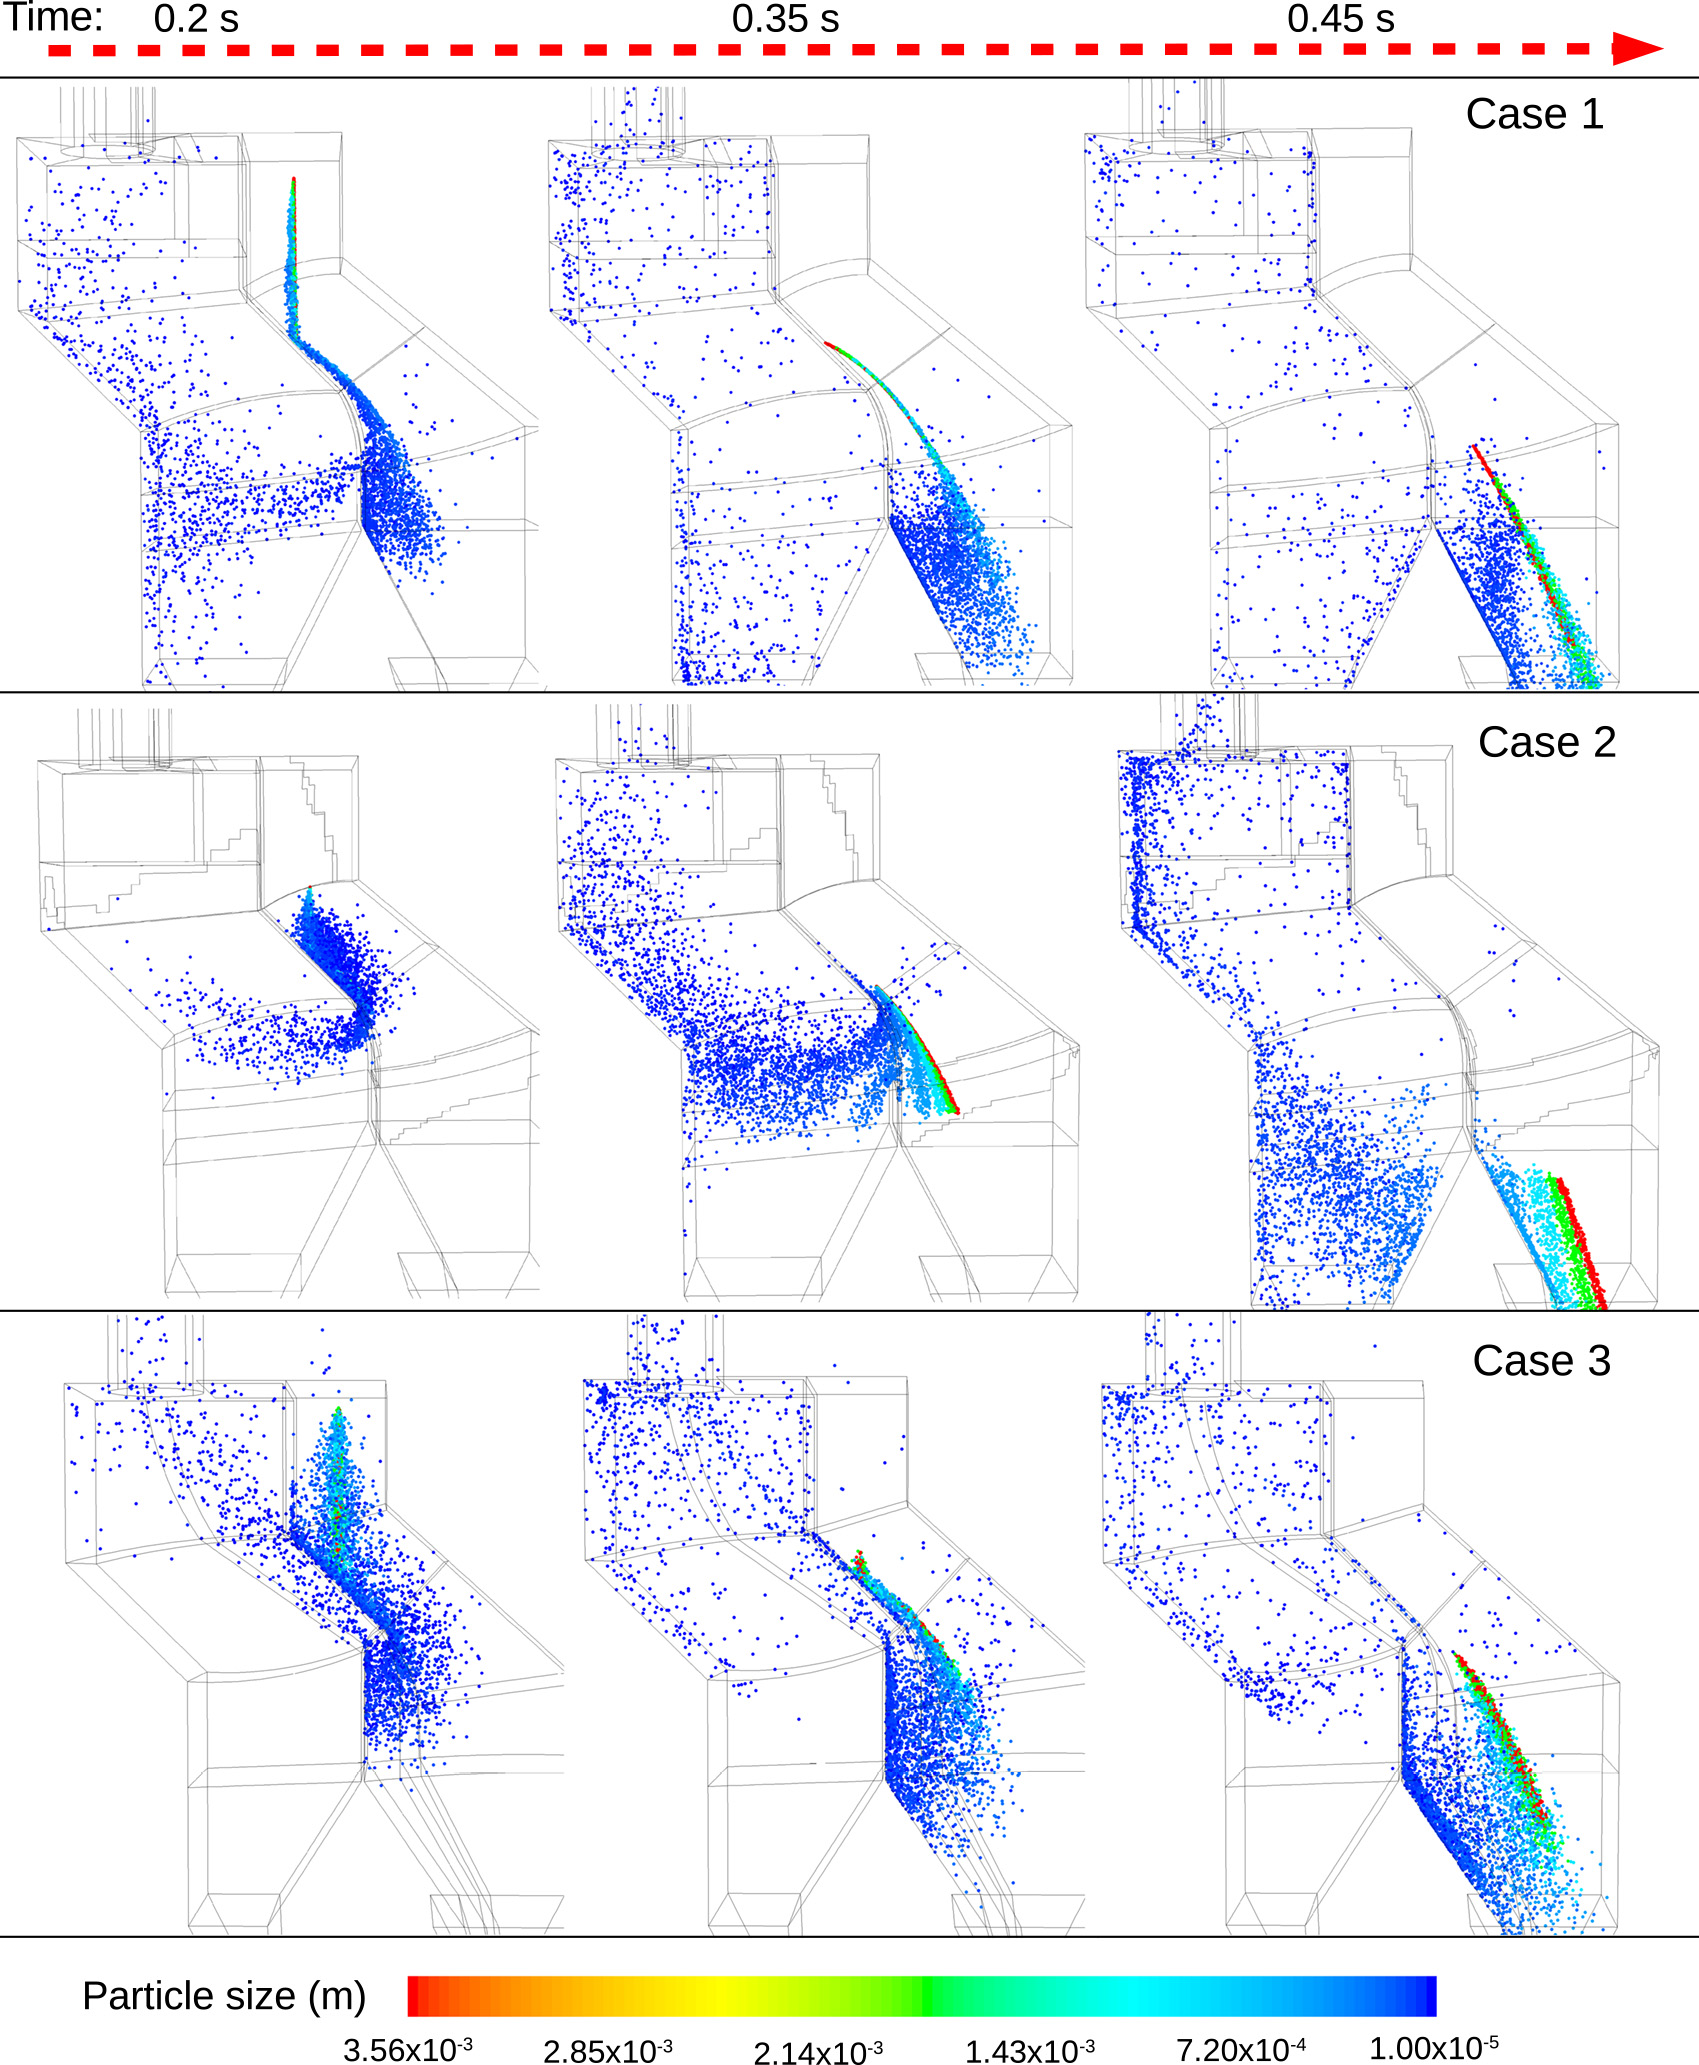
Snapshots of the particle positions inside the classifier at different times after the injection.
After falling, particles bounce against the inclined plate and change the direction of their trajectories. It was found experimentally that the trajectory after the impact depends on the particle size and shape. Coarse particles present more inertia than fine particles and are less affected by the drag force (Petit and Irassar, 2021; Petit, 2018). Moreover, fine particles present more flaky shapes, increasing the drag force and forcing them to follow the airflow. This behavior is only partially represented in the simulations. The main issue regarding the current simulation set-up is that particles of different sizes share a single coefficient of restitution and shape factor. However, the effect of the drag on the particle is modeled sufficiently well to recreate the different trajectories after the impact. The differences in the trajectories for different particle sizes are more clearly observed in case 2, where the auxiliary air inlet is open.
The classification of particles at the throat can be observed in the three simulated cases. Fine particles near the throat are dragged by the air and pass to the secondary chamber. Particles that cannot follow the air impact against the vertical deflector, which agrees with the large amount of particles found in the deflector after the experimental runs (Petit, 2018). Cases 1 and 3, where only the primary airflow is used, present a more abrupt change in the flow direction, and fewer particles are able to pass to the secondary chamber. On the other hand, the presence of the auxiliary airflow modifies the flow at the throat (as seen in Fig. 5), reducing the intensity of the swirl and forcing more particles to pass to the secondary chamber. Therefore, the utilization of the auxiliary air inlet increases the cut size of the primary classification. After passing to the secondary chamber, some particles settle into the secondary hopper, while others exit the classifier. As expected from the flow visualizations presented in Fig. 5, the auxiliary airflow allows a more ordered classification in the secondary chamber. On the other hand, the strong secondary flows in cases 1 and 3 disperse the particles, making the settlement more difficult. The effect of the auxiliary airflow can also be observed at the bottom of the primary chamber in case 2. The auxiliary airflow enters the classifier at the bottom and flows upwards, dragging fine particles that were kept in the bulk of the coarser particles and could not pass through the throat to the secondary chamber.
The prediction of the CFD-DPM and CFD-DEM simulations in terms of the particle size distribution of the products is presented in Fig. 7, where the standard limits are presented in the plot for reference. The yield of the products and the values of the cut sizes for the three cases of study are presented in Fig. 8 and Fig. 9, respectively. It can be observed that the PSD of the primary product is accurately estimated by the simulations, with a slight under prediction observed in case 2. On the contrary, the PSD of the secondary and tertiary products is not as well described as for the primary products. An exception occurs in case 2 where the overall results for the PSD are in fair agreement with experimental values for all products. The results indicate that the simulation methodologies are able to describe the main classification mechanism that takes place in the primary chamber but not the secondary classification in the secondary chamber. The results in Fig. 8 support this affirmation, the yield of the primary product is well estimated in all the three cases, while errors appear for the yields of the secondary and tertiary products. The same can be observed in Fig. 9, where the primary cut size (x50) is in better agreement with the experimental values than that observed for the secondary cut size (y50).
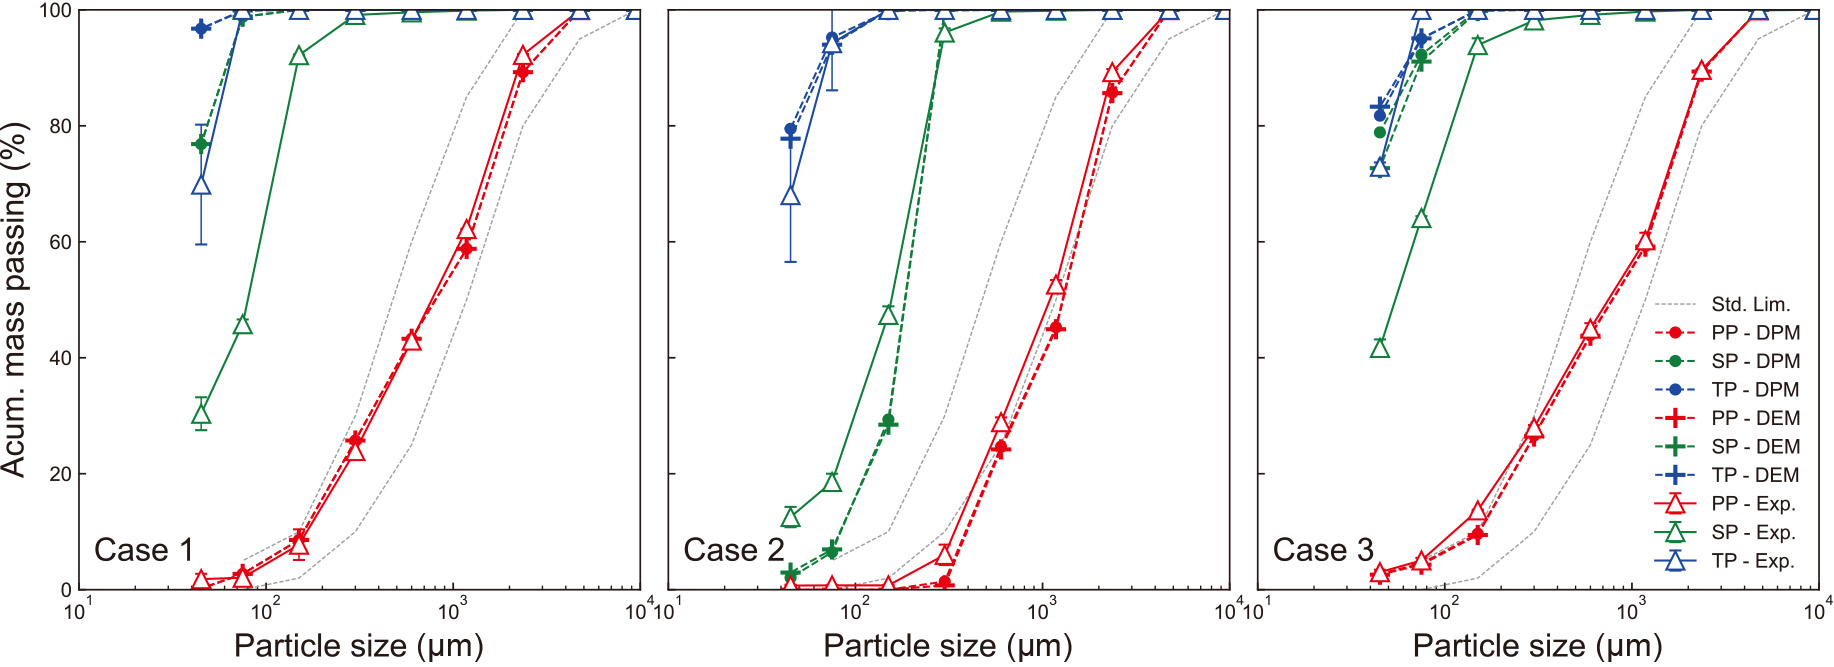
PSDs of the primary (PP), secondary (SP), and tertiary (PP) products obtained experimentally or by simulations.
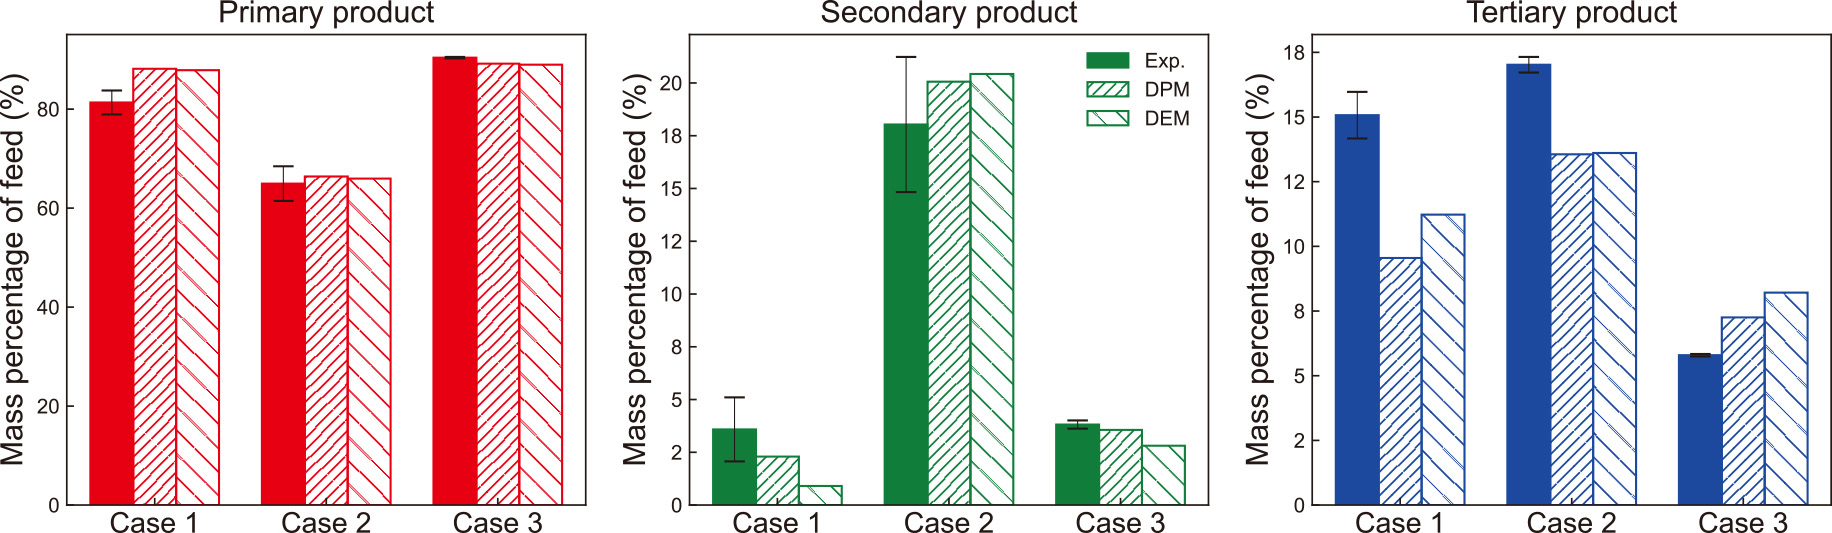
Yield of the products of classification and comparison against the CFD-DPM and CFD-DEM results.

Cut sizes of the classification and comparison against the CFD-DPM and CFD-DEM results. Variables x50 and y50 represents the primary and secondary cut sizes, respectively.
The limitations of the CFD-DPM methodology were tested by fine-tuning some parameters such as the coefficient of restitution (CN), the shape factor (ϕ), and the Lagrangian time coefficient (CL) of the particles. The results of the procedure are omitted here for brevity but can be found in Petit (2018). In summary, reducing the values of the coefficient of restitution and increasing the value of the Lagrangian time coefficient slightly improved the results. However, it was found that the increase in the accuracy of the representation of the secondary classification deprecated the representation of the primary classification. This shows that one of the major limitations of the methodology is the impossibility of using size-dependent parameters. In addition, the utilization of more classes to represent the PSD of the feed was tested without any significant changes with the exception of more computational effort. The influence of the Lagrangian coefficient, which dominates the particle dispersion due to turbulent effects, suggests that the turbulent dispersion of the particles is not correctly modeled. The results support this assumption, as case 2 presents the best agreement with the experimental values, being the case that was found to present a less turbulent airflow in the secondary chamber (Fig. 5) and a more ordered secondary classification (Fig. 6).
The utilization of the CFD-DEM methodology does not present any improvements over the CFD-DPM methodology. Only minor differences in the PSD of the products, the cut sizes, and the yield of the products were observed between the two methodologies. In the case of the cut sizes, all predictions using the CFD-DEM method present a coarser cut size, for both the primary and secondary classifications. In any case, the increase in the computational demand for the utilization of the DEM method does not bring an increase in the accuracy of the simulations for the concentrations of solid used in this study. It is clear that the limitations of the simulation are associated with the modeling of the fluid–particle interaction and not with the particle–particle interactions.
Despite the limitations, the simulations gave a good description of the primary classification in the different cases and offered predictions of the influence of the position of the deflector and the auxiliary airflow. Regarding the auxiliary airflow, the simulations showed that the upstream airflow at the bottom of the primary chamber in case 2 (Fig. 5) enables a better classification of the particles (Fig. 6), resulting in a coarser primary product (Fig. 7) and a greater primary cut size (Fig. 9). Regarding the position of the vertical deflector, the CFD simulation described the complexity of the swirl that occurs in the throat in case 3 (Fig. 5) and the finer classification that occurs due to the more abrupt change of direction in the airflow (Fig. 6). Thus, resulting in finer particles in the primary product (Fig. 7) and a lower primary cut size (Fig. 9).
The airflow inside the throat classifier was simulated by using the CFD methodology. The overall results showed that the simulation provided fair predictions of the airflow behavior with some limitations regarding the description of velocity profiles in some locations. Changing the turbulence models or numerical schemes did not improve the results.
Simulations of particle classification were performed using both CFD-DPM and CFD-DEM methodologies. The simulations showed reasonable results in the representation of the overall performance of the classifier and excellent results in describing the primary classification products. The utilization of the DEM method did not bring any improvements in the accuracy of the simulations. The major limitations of the simulation methodology, for the concentration of solids used in this study, reside in the modeling of the fluid–particle interactions.
Despite these limitations, the simulation methodology allowed for an explanation of the previously collected experimental results. Valuable information was gathered regarding the description of the airflow inside the classifier which explains the mechanisms of particle classification that occur inside the device. In addition, the utilization of the simulations allowed to study in detail the influence of operational variables on the performance of the classifier, such as the position of the vertical deflector and the utilization of the auxiliary air inlet.
The data from the comparison between experimental and numerical investigation of the throat air classifier is available publicly in J-STAGE Data (https://doi.org/10.50931/data.kona.23272763).
Computational Fluid Dynamics
DEMDiscrete Element Method
DPMDiscrete Phase Method
PPPrimary product
PSDParticle size distribution
SPSecondary product
TPTertiary product
AOpening of the auxiliary air inlet (-)
CLLagrangian time constant (-)
CNNormal coef. of restitution (-)
CTTangential coef. of restitution (-)
DVertical position of deflector (m)
dHorizontal position of deflector (m)
KSpring constant (N/m)
kTurbulent kinetic energy (m2/s2)
ℓ⊥Normal distance to the wall (m)
PPosition of the vertical deflector (-)
PRRelative static pressure (Pa)
uiVelocity components (m/s)
uthFluid velocity at the throat (m/s)
u||Velocity parallel to the wall (m/s)
x, y, zCartesian coordinates (m)
x50Primary cut size (m, μm)
y+Wall dimensionless distance (-)
y50Secondary cut size (m, μm)
αpVolume fraction of particles (-)
ΔtTime step (s)
ΔPPressure loss (Pa)
γDamping coefficient (kg/s)
ɛTurbulent dissipation rate (m2/s3)
ϕParticle shape factor (-)
τParticle relaxation time (s)
τPParticle reaction time (s)
τκKolmogorov time scale (s)
Horacio A. Petit
;%0A%09%09%09newWindow.document.open();%0A%09%09%09newWindow.document.write('<img src=%22./Graphics/41_2024006_10.jpg%22>');%0A%09%09%09newWindow.document.close();%0A%09%09)
Horacio Andrés Petit is a Chemical Engineer and obtained a Ph.D. in Engineering at the Universidad Nacional del Centro de la Provincia de Buenos Aires. Worked as a postdoc research assistant at the Universidade Federal de Rio de Janeiro (UFRJ). Now works as a researcher at the CIFICEN research unit (UNCPBA - CICPBA - CONICET). His research interests are the design and simulation of mineral processing units. His works focuses on the utilization of CFD and DEM methods for the simulation of air classifiers and other mineral processing equipment.
Edgardo Fabián Irassar
;%0A%09%09%09newWindow.document.open();%0A%09%09%09newWindow.document.write('<img src=%22./Graphics/41_2024006_11.jpg%22>');%0A%09%09%09newWindow.document.close();%0A%09%09)
Edgardo F Irassar is a Full Professor of Civil Engineering Department at the Universidad Nacional del Centro de la Provincia de Buenos Aires, Olavarria, Argentina. He is Head of the INMAT Research Group of the Engineering Faculty and Vice Chair of the CIFICEN Research Unit (UNCPBA - CICPBA - CONICET). His research interests are the cementitious building materials (Concrete, mortar, cement) for sustainable concrete including durability, new supplementary cementing materials, aggregates beneficiation, recarbonatation and LCA evaluation.