Abstract
Vibro-assisted fluidization of cohesive micro-silica has been studied by means of X-ray imaging, pressure drop measurements, and off-line determination of the agglomerate size. Pressure drop and bed height development could be explained by observable phenomena taking place in the bed; slugging, channeling, fluidization or densification. It was observed that channeling is the main cause of poor fluidization of the micro-silica, resulting in poor gas–solid contact and little internal mixing. Improvement in fluidization upon starting the mechanical vibration was achieved by disrupting the channels. Agglomerate sizes were found to not significantly change during experiments.
1. Introduction
Fluidization of cohesive powders has seen significant interest in the last decades, fueled by the increase in applications of powders with small particle sizes. Cohesive micro- and nanopowders find their use in medical applications (Prabhu and Poulose, 2012; Guo et al., 2013), catalysis (Li et al., 2003) and coatings (Mahato and Cho, 2016) for example.
Due to their small particle size, the attractive van der Waals forces between these particles are dominant, in the absence of moisture, making them hard to fluidize (Kamphorst et al., 2023). Two main complications are seen: channeling and agglomeration. Channeling is the phenomenon where a gas bypass, or channel, is formed through the bed in the vertical direction upon the introduction of gas. Gas mainly flowing through a channel has poor interaction with the powder bed, meaning less drag is created and no fluidization takes place. Agglomeration is the formation of particle clusters as a result of dominant cohesive forces. Whereas agglomerates can sometimes be fluidized without assistance (Morooka et al., 1988), gas–solid contact is reduced due to the surface area of particles being inside the agglomerate and gas mostly passing outside of it, with diffusion into the agglomerates pores. A phenomenon that is also sometimes observed, at startup, for cohesive powder is slugging or plugging, here the entire bed is pushed up through the fluidization column. While one could argue this to be a third complication of cohesive powder fluidization, we consider this an extreme form of agglomeration, where the entire bed acts as one large cluster. Slugging is typically not seen in industrial-scale beds.
In order to fluidize cohesive powders, assistance methods can be employed, which introduce an additional manipulation. For most assistance methods it was concluded, by one or more studies, mostly done on nanoparticles, that the mechanism by which fluidization was improved is by breaking up agglomerates; mechanical vibration (Nam et al., 2004; Barletta and Poletto, 2012), acoustic vibration (Guo et al., 2006), magnetic field (Zhou et al., 2013), stirring (Zhang et al., 2021), micro-jet (Quevedo and Pfeffer, 2010; Nasri Lari et al., 2017) and pulsed flow (Al-Ghurabi et al., 2020; Ali et al., 2016; Ali and Asif, 2012). This conclusion is based on smaller agglomerate sizes being measured in beds that have been fluidized, using an assistance method, than one that could not be fluidized. However, the mechanism of agglomerate breakage should be taken into account. First of all, they can break as a result of collisions, either with other agglomerates or with the column wall. However, in an unfluidized bed, agglomerates will be (mostly) static, meaning no collisions take place. Another way for agglomerates to decrease in size is due to shear with the fluidizing gas, though simulations for nanoparticle fluidization have shown this effect to be minor, even at high gas velocities (van Ommen et al., 2010). For this to happen at a significant scale, there should be significant gas–solid contact, which is also absent before fluidization is initiated.
Based on this, we hypothesize that agglomerates break as a result of initiated fluidization, but this agglomerate breakage is not the cause of the improvement. Rather than agglomeration, we propose channeling is the major hurdle to overcome to achieve fluidization of cohesive powders. By introducing additional manipulation, from an assistance method, the channels can be destabilized and will collapse. Note that mechanical vibration, acoustic vibration, magnetic fields, pulsed flow, stirring, and a (micro-)jet all introduce additional motion of gas, column or internals into the bed, providing a mechanism by which the channeling can be disrupted. In the absence of channels, all fluidizing gas has to flow through the bed, creating drag. When sufficiently large drag is created, the particles or agglomerates will be fluidized. This reasoning leaves one to conclude that the best assistance methods are not the ones that are best at breaking agglomerates, but those which most effectively destroy channels. For further development and optimization of assistance methods, it is essential to have a complete understanding of the mechanism by which the fluidization is improved.
Characterization of the fluidization quality is often done by measuring bed height expansion and pressure drop (Nam et al., 2004; Barletta and Poletto, 2012; Mawatari et al., 2003). These two measurements alone are insufficient when it comes to analyzing the cause of poor fluidization. Visualization of the temporal evolution of hydrodynamics, going from poor fluidization with channeling to bubbling fluidization under the influence of an assistance method, could provide a better understanding of the mechanism. Simple optical techniques that are typically used to visualize hydrodynamics in two-phase systems are, however, limited to acquiring information close to the wall region, because the large solid fraction of the dispersion phase makes the dense flow opaque to visible light. X-ray imaging, on the other hand, has been demonstrated to be a valuable technique to study dynamics in opaque systems, such as fluidized beds with nanoparticles (Gómez-Hernández et al., 2017), irregular particles (Mema et al., 2020), sintering (Macrì et al., 2020), internals (Maurer et al., 2015; Helmi et al., 2017), and spouts (Barthel et al., 2015).
This study aims to characterize the hydrodynamics of a gas–solid fluidized bed, consisting of cohesive micro-silica, with and without vibration applied to it. This is done by means of X-ray imaging, pressure drop, and bed height extension measurements. Channel formation and disruption are shown and agglomerate sizes are measured to elucidate the mechanism behind the employed assistance method.
2. Experimental and methodology
2.1 Fluidization procedure
A Perspex column with an inner diameter of 9 cm and sample ports at 2.5, 6.5, and 13.5 cm from the distributor plate was used as the fluidized bed column. The pressure drop was measured from the surface of the distributor plate to the breakout box, using OMEGA PX409-10WG5V pressure transducers. The static pressure of the powder was 2.3 mbar (2.3 × 10² Pa) for all experiments. The column was mounted on a vibration table, a frequency of 30 Hz and a vertical amplitude of 1 mm was used for all experiments with vibration. For this study, two gas velocities were used, 1.8 and 3.1 cm s−1. During the X-ray experiments, a remotely controlled camera was used to capture images of the column from which the bed height was measured.
The used powder, KÖstropur 050818, consists of SiO2 particles with a volume-averaged primary particle size of 9.7 μm (as measured by laser diffraction); particle size distribution is shown in Fig. 1. The powder was sieved beforehand (mesh size 1.25 mm). Note that this is orders of magnitude larger than the primary particle size, meaning it did not affect the size distribution of the powder, but was done to establish an equal state of aeration at the start of each experiment, ensuring reproducibility. The bulk density after sieving was measured to be 134 kg m−3.

After each experiment, powder samples were taken from the plane center of the collapsed bed at heights 2.5, 6.5, and 13.5 cm from the distributor plate. A Zeiss Colibri 7 Axio Observer microscope, equipped with Orca Flash 4.0 Hamamatsu V2 camera was used for imaging. The images were analyzed using ImageJ. The equivalent circle diameter of the agglomerates was calculated from the projected area of the agglomerates on the image. To avoid including primary particles too, which will drastically shift the number-based distribution, agglomerates with a diameter smaller than 35 μm were excluded. A minimum of 800 agglomerates were measured for each sample.
To be able to distinguish between the effect of 1) agglomerate breaking and 2) disrupting of channels on the fluidization quality, three sets of experiments were conducted. One where no vibration was used, one where vibration was used for 8 min, and finally one where vibration was used for 5 s before the inlet gas and vibration were switched off, all at the two aforementioned gas velocities.
2.2 X-ray imaging setup
The gas–solids distribution inside the fluidized bed column was measured using an in-house fast X-ray analysis setup. The complete setup consists of three standard industrial-type X-ray sources (Yxlon International GmbH) with a maximum energy of 150 keV working in cone beam mode. The sources are placed at 120° around a common center, which forms the field of view. Three 2D detectors (Teledyne Dalsa Xineos) are placed opposite of the sources. The sources and detectors are attached to a hexagonal support frame that enables translation of the detectors. By changing the distance between the source and detector, or the relative position of the column, the magnification of the image of the column can be adjusted. In this study the experiments were performed with one X-ray source-detector pair to obtain a projected 2D output from the 3D column as shown in Fig. 2. The column was fixed to a vibration table which was positioned in the center of the setup. The distance between the source and the detector was 128.8 cm.

The experimental procedure was controlled from a workstation outside the setup room, guaranteeing a safe working environment. The workstation was used to trigger the X-ray source and read out the signals from the detector plate. The theoretical spatial resolution of the X-ray detector was 0.15 mm per pixel. During all experiments the X-ray images were recorded with a frequency of 50 Hz for a measurement time of 200 s for the channel-breaking experiments or 600 s for the full experiment, which corresponded to the acquisition of respectively 10,000 and 30,000 images per experiment. The measured data was stored for further digital image analysis.
2.3 X-ray image processing
For each experiment, the attenuation of the X-ray beam was measured at the detector plate to obtain the time-resolved projected 2D intensity map of the reactor. The raw images acquired were corrected for dead-pixels, originating from the construction of the detector plate, by means of interpolation to give pre-processed images.
In order to convert the measured X-ray attenuation to a solids concentration, a two points calibration protocol was performed. First, a reference image was acquired of the empty column. Then, the column was completely filled with the powder and vibrated for 10 minutes to approach the maximum packing density. After packing, the full reference image was acquired. The X-ray measurement principle is based on the attenuation of X-rays that travel through a material in a straight line from an X-ray source to a scintillation detector. The law of Lambert-Beer describes the transmission of a monochromatic beam of high energy photons with initial intensity I0 through a material of constant density:
|
I
(
x
)
=
I
0
exp
(
-
μ
x
) | (1) |
where I(x) represents the intensity measured at the detector, μ the attenuation coefficient, and x the thickness. In the case of a varying attenuation, the measured intensity is the integral effect of the local attenuation with the local attenuation coefficient. By applying the Lambert-Beer law the measurement gas-fraction map was obtained from the measurement intensity map by using the empty and full reference. The normalized solids fraction α was calculated as follows:
|
α
=
1
-
log
(
I
measured
/
I
full
)
log
(
I
empty
/
I
full
) | (2) |
Note the range of normalized solid fraction used in this work is between 0 to 1, with 0 representing pure gas and 1 representing close packing of the solids. For the solid fraction map, low attenuation of X-rays is represented by light colors and indicates low solid concentrations. By contrast, high attenuation of X-rays is represented by the dark colors and indicates a high solids concentration. The acquired images obtain time-resolved, or dynamic, information of the gas–solids distribution in the column.
2.4 Pressure data processing
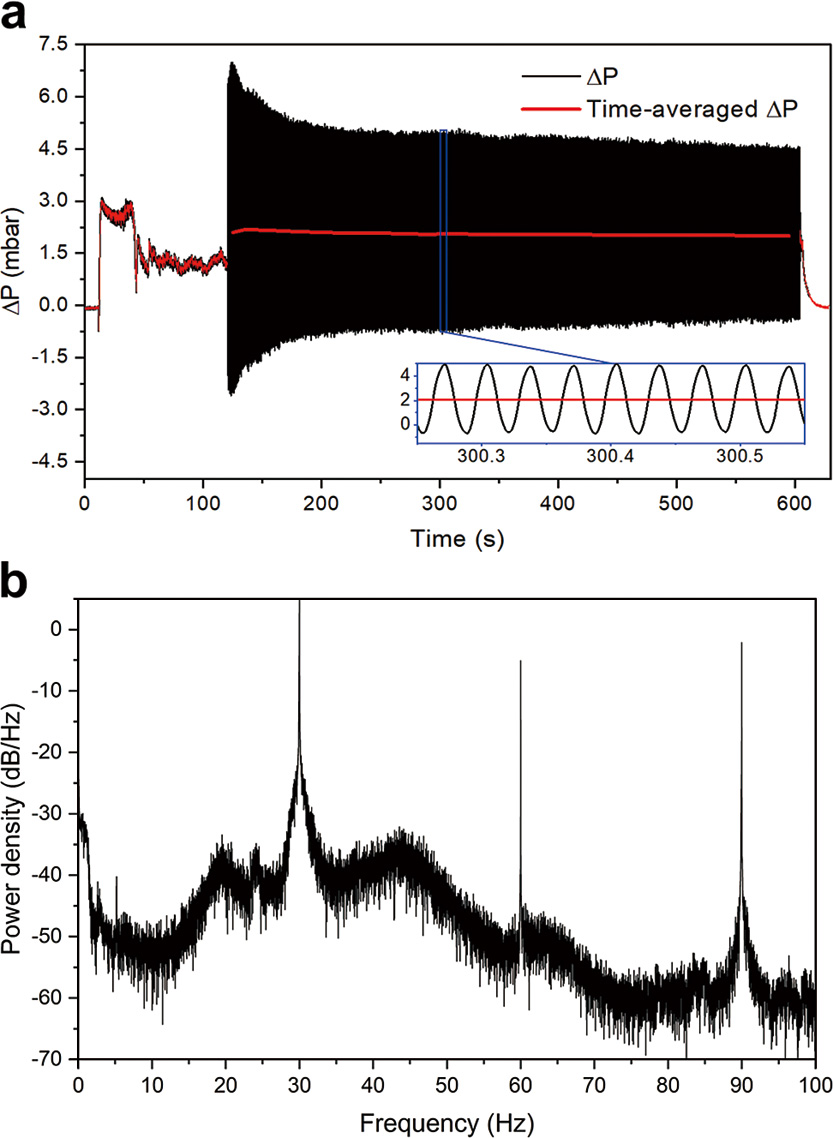
Pressure drop over the whole fluidized bed, or over part of it, is commonly used to evaluate fluidization. When mechanical vibration is applied, the periodic oscillation of mass and gas induced is significantly greater than that caused by rising bubbles and suspension of solids. These driven oscillations affect the measured time series of bed pressure drop, greatly complicating the analysis of fluidization state. For example, Fig. 3(a) plots the time series of bed pressure drop sampled over 600 s. The vibration was introduced at around 120 s, after which the measured signal (black) fluctuates largely with an amplitude of up to triple the theoretical bed pressure drop. To further determine the components of such oscillations, one could analyze the signal in the frequency domain (Wu et al., 2023). In Fig. 3(b) the power spectrum for the signal sampled between 120–600 s is demonstrated. The dominant peaks occur at 30 Hz, corresponding to the vibration frequency adopted in the experiment, as well as its sub-harmonic frequencies with reduced intensity. As a result, in the following sections, the 10 s time-averaged pressure drop is used to assess fluidization quality during vibration, such as the red lines in Fig. 3(a), while its standard deviation mainly associated with the vibration is therefore neglected. For the experiments where vibration was only used for 5 s, averages over 1 s were taken.
3. Results and discussion
3.1 Channel breakage by vibration
3.1.1 Pressure drop and X-ray images
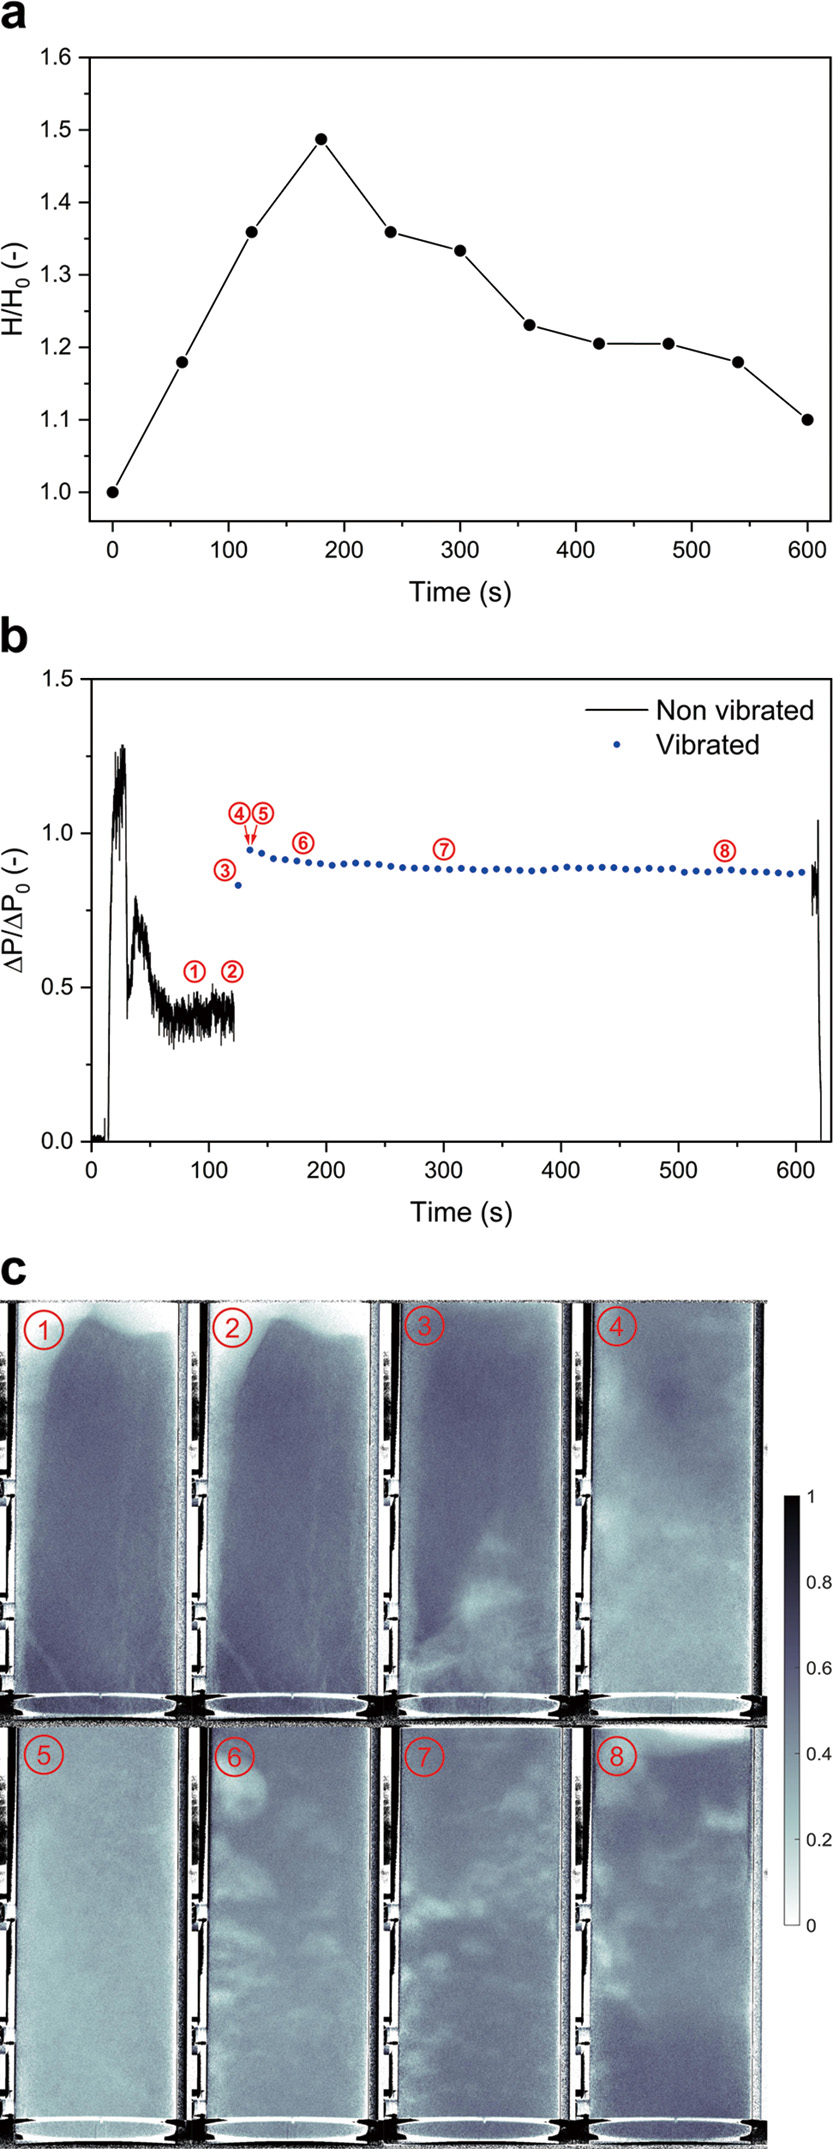
In Fig. 4 the pressure drop and X-ray images of the experiments where vibration was used are shown. Experiments 1 and 2 (under the same conditions) were terminated after 5 s of vibration. The third one was vibrated for 8 min after vibration started, in order to demonstrate the long-term fluidization behavior. The initial pressure drop fluctuations, seen in all pressure graphs, are caused by slugging which is discussed in detail in Sections 3.2.1 and 3.2.3. For each experiment, it can be seen that a semi-stable pressure drop was achieved after roughly 75 s. The ΔP/ΔP0, the ratio of measured pressure drop over theoretical pressure drop (the static pressure of the powder; 2.3 mbar (2.3 × 10² Pa) for all experiments) of full fluidization, after 90 s, shown in Fig. 4(b)-1, Fig. 4(d)-1 and Fig. 4(f)-1, was found to be low. The channeling, causing the low pressure drops, can clearly be seen. Comparing these images to Fig. 4(b)-2, Fig. 4(d)-2 and Fig. 4(f)-2 it can also be seen that these channels were stable with time, as the images with sub-labels 1 and 2 were taken 30 s apart. The relatively high and unstable pressure drop seen from 50 s to 120 s in Fig. 4(e) is explained by the collapse and reforming of unstable channels. In Fig. 4(f)-2 the channel structure can be seen to have changed compared to Fig. 4(f)-1. We consider this occurs simply as a matter of chance, since up to 120 s there is no difference in operation between the three experiments. In the following images the effect of vibration, within the first seconds of initiation, can be seen. For all experiments, two types of channeling were observed: rat-holes and vein-like channels. Where rat-holes run almost vertically from bottom to top of the bed, creating a large gas bypass, vein-like channels branch out in several directions, resulting in a network of thinner interconnected channels. Not enough data was acquired to reliably assess what causes either type of channeling to occur. It was consistently observed that the vein-like channels disappear by merging together, due to the powder barriers, initially separating them, crumbling. The rat-holes, persist longer and are destroyed by powder falling into them, disrupting the gas flow and creating bubble-like gas pockets. In Fig. 4(a), Fig. 4(c) and Fig. 4(e) it can be seen that the ΔP/ΔP0 spiked to 0.89, 0.79 and 0.89 after 1 s, and kept increasing to 0.91, 0.88 and 0.94 after 5 s of vibration, respectively. Note that this increase over the first 5 s corresponds to more and more channels breaking, as seen in the X-ray images. The increase in the fluidized fraction of powder, as measured by pressure drop, is in all experiments clearly correlated to the breaking of channels.

For the experiments displayed in Fig. 4, the agglomerate sizes were measured after ending the experiment for the top, middle and bottom of the bed (as described in Section 2.1). The resulting number-based cumulative percentiles, d10, d50 and d90, are shown in Fig. 5. First comparing the two runs in which vibration only lasted for 5 s, labeled 1 and 2 in Fig. 5, no significant difference between them can be seen, showing the data is reproducible. Also, comparing the sizes in both of these experiments to the unfluidized powder, no significant change is observed. Looking at the sizes found after 8 min of vibro-fluidizing, labeled 3 in Fig. 5, no big change in agglomerate sizes was found compared to the unfluidized powder or compared to the other experiments.

It was hypothesized that channel disruption is the cause of initiated fluidization upon the introduction of vibration. It was expected to find a decreased agglomerate size after 8 min of vibro-fluidization compared to 5 s, where virtually no decrease was expected. While no significant change in agglomerate sizes was found for any of the experiments, it can still be concluded that the break-up of agglomerates does not play a role in initiating fluidization of the cohesive powder.
3.2 Influence of vibration and gas velocity
3.2.1 No vibration, 1.8 cm s−1
In Fig. 6 the bed height, pressure drop and X-ray images from the experiment without vibration and 1.8 cm s−1 gas velocity are shown. It can be seen that the bed was initially lifted as a plug, which corresponded to a large pressure drop over the column. The plug eventually broke and fell down in pieces, as seen in Fig. 6(c)-3, which lead to heavy pressure swings in the system. Note that in this image most of the powder bed is still out of frame, higher up in the column. Right after, some fluidization took place, as seen by the pressure drop, significant bed height expansion and dilute X-ray image. Within 45 s after the plug fell down, stable channels had formed (Fig. 6(c)-5), that did not significantly change over time anymore. The pressure drop remained constant over this time with an average ΔP/ΔP0 of 0.57. Bed height was decreasing slowly due to the bed compacting from its initial fluidized state. Still, an expansion ratio of 1.2 was maintained, caused by the added volume of the channels now present in the bed and the looser packing state of the powder. This experiment shows all the expected behavior of a cohesive powder upon the introduction of a gas flow.

The results shown in Fig. 7 are of the same experiment shown in Fig. 4(e) and Fig. 4(f), but extended to the full experimental time to assess the effect of vibration over time. The bed initially rose as a plug again, the X-ray images corresponding to this were omitted since they are virtually identical to the experiment previously described in Section 3.2.1 and the focus here is on the effect of vibration, which started at 120 s. In Fig. 7(c)-1 to Fig. 7(c)-5, the initial stable channel collapsing and the initiation of fluidization are shown. Over time, compaction and partial de-fluidization took place. It can be seen that the bed height decreased, coupled with a decrease in ΔP/ΔP0 from 0.93 in the first minute after vibration started to 0.87 in the last minute of the run. From the X-ray images, it could also be observed that the bed was densifying during this time, with a compacted region being present, dominantly at the bottom of the bed.
3.2.3 No vibration, 3.1 cm s−1
The obtained results for the 3.1 cm s−1 experiment without vibration are shown in Fig. 8. As in the other experiments, the bed initially formed a plug. In Fig. 8(c)-3 the fragments of the broken plug can be seen falling down, corresponding with the pressure swing seen at 30 s in Fig. 8(b). This was followed by some degree of fluidization, giving a bed height expansion ratio of 1.5 and a ΔP/ΔP0 of 0.89 at the peak, 115 s. The dip in bed height and pressure drop that followed is explained by the formation of two rat-holes, seen in Fig. 8(c)-5, which collapsed later leading to vein-like channel formation and some spouting and bubbling in top of the bed, coupled with stable ΔP/ΔP0 of 0.77.
3.2.4 Vibration, 3.1 cm s−1
Fig. 9 shows the data from the experiment at 3.1 cm s−1 with vibration. As for all experiments, slugging occurred initially, followed by some degree of fluidization before stable channels formed, which are seen in Fig. 9(c)-1 and Fig. 9(c)-2. After 10 s of vibration (Fig. 9(c)-5), no long-term structures could be observed anymore and the bed was homogeneously fluidized. In the remaining time that the experiment was running, densification was observed, mainly at the bottom of the bed, as when 1.8 cm s−1 gas velocity was used. The densifying resulted in a lower bed height expansion ratio, eventually even lower than when no vibration was used at 3.1 cm s−1, and a slight reduction in ΔP/ΔP0 from 0.91 in the first minute after vibration started, to 0.87 after 8 min.
3.2.5 Agglomerate sizes
For each 10 min experiment, the agglomerate sizes (d10, d50 and d90, number-based), at all sample heights, are shown in Fig. 10. Comparing the results, across gas velocities and with or without vibration to fresh powder, the differences are minor. The influence of vibration and gas velocities, within the ranges used in this study, on agglomerate sizes is therefore concluded to be insignificant. The densification of the bottom bed—as observed after several minutes of vibration—is not reflected by the agglomerate size.
3.3 Channel formation
Channeling took place in all the experiments conducted, either without vibration or before vibration was switched on. From the X-ray images shown in the previous sections, the variety of the formed channels across different experiments is obvious. The diversity which is seen, even under identical conditions, underlines the random nature of channel formation. It also shows no bias from the used experimental method, since no preferential place for the channels to form is observed. The results also suggest that even the formation of rat-hole like or vein-like channeling is random and not affected by gas velocity within the range used for this study.
4. Conclusions
In this work, the mechanism behind the initiation of fluidization of cohesive micro-sized powder, by vibrations, was studied by means of X-ray imaging, pressure drop and bed height measurements. Agglomerate sizes were measured to decouple the phenomena of channel disruption and agglomerate breakage. When no vibration was used, the powder could not be properly fluidized at either 1.8 or 3.1 cm s−1 and severe channeling was observed, which was not always clearly reflected in the pressure drop or bed height, showcasing the limitations of these techniques when it comes to assessing the dynamics of complex systems. Gas velocity, vibration and vibration time were not found to have any significant effect on agglomerate sizes, within the parameter ranges applied in this work. From this, it is concluded that vibrations initiate fluidization not by breaking agglomerates, but by disrupting channels. Furthermore, it was found that narrow, vein-like channels are disrupted significantly faster than the larger rat-holes. Finally, when vibration was employed, bed compaction was observed over time, as a dense phase formed on top of the distributor plate, causing a decrease in bed height and pressure drop. The study was carried out using a single micro-silica powder, meaning material- and size-specific influences, which might influence results, were not investigated. While variations are deemed likely when using other powders, based on the described mechanism by which assistance methods work and the absence of a mechanism by which agglomerates can be broken before fluidization is initiated, it is expected that the disruption of channels is the cause of initiated fluidization for other cohesive powders too. This study is a first step towards a better understanding of the mechanism behind vibro-assisted fluidization of cohesive powder and may contribute to the further development and optimization of assistance methods.
Acknowledgments
We want to thank Stefan ten Hagen for his contribution to designing and manufacturing the column used in this study.
This work is part of the Advanced Research Center for Chemical Building Blocks, ARC CBBC, which is co-founded and co-financed by the Dutch Research Council (NWO) and the Netherlands Ministry of Economic Affairs and Climate Policy. The work has also received funding from the NWO under the grant number ENPPS.LIFT.019.027.
References
- Al-Ghurabi E.H., Shahabuddin M., Kumar N.S., Asif M., Deagglomeration of ultrafine hydrophilic nanopowder using low-frequency pulsed fluidization, Nanomaterials, 10 (2020) 388. DOI:10.3390/nano10020388
- Ali S.S., Al-Ghurabi E.H., Ajbar A., Mohammed Y.A., Boumaza M., Asif M., Effect of frequency on pulsed fluidized beds of ultrafine powders, Journal of Nanomaterials, 2016 (2016) 23. DOI:10.1155/2016/4592501
- Ali S.S., Asif M., Fluidization of nano-powders: effect of flow pulsation, Powder Technology, 225 (2012) 86–92. DOI:10.1016/j.powtec.2012.03.035
- Barletta D., Poletto M., Aggregation phenomena in fluidization of cohesive powders assisted by mechanical vibrations, Powder Technology, 225 (2012) 93–100. DOI:10.1016/j.powtec.2012.03.038
- Barthel F., Bieberle M., Hoppe D., Banowski M., Hampel U., Velocity measurement for two-phase flows based on ultrafast X-ray tomography, Flow Measurement and Instrumentation, 46 (2015) 196–203. DOI:10.1016/j.flowmeasinst.2015.06.006
- Guo L., Yuan W., Lu Z., Li C.M., Polymer/nanosilver composite coatings for antibacterial applications, Colloids and Surfaces A: Physicochemical and Engineering Aspects, 439 (2013) 69–83. DOI:10.1016/j.colsurfa.2012.12.029
- Guo Q., Liu H., Shen W., Yan X., Jia R., Influence of sound wave characteristics on fluidization behaviors of ultrafine particles, Chemical Engineering Journal, 119 (2006) 1–9. DOI:10.1016/j.cej.2006.02.012
- Gómez-Hernández J., Sánchez-Delgado S., Wagner E., Mudde R.F., van Ommen J.R., Characterization of TiO2 nanoparticles fluidization using X-ray imaging and pressure signals, Powder Technology, 316 (2017) 446–454. DOI:10.1016/j.powtec.2016.11.068
- Helmi A., Wagner E.C., Gallucci F., van Sint Annaland M., van Ommen J.R., Mudde R.F., On the hydrodynamics of membrane assisted fluidized bed reactors using X-ray analysis, Chemical Engineering and Processing: Process Intensification, 122 (2017) 508–522. DOI:10.1016/j.cep.2017.05.006
- Kamphorst R., Wu K., Salameh S., Meesters G.M.H., van Ommen J.R., On the fluidization of cohesive powders: differences and similarities between micro- and nano-sized particle gas–solid fluidization, The Canadian Journal of Chemical Engineering, 101 (2023) 227–243. DOI:10.1002/cjce.24615
- Li P., Miser D.E., Rabiei S., Yadav R.T., Hajaligol M.R., The removal of carbon monoxide by iron oxide nanoparticles, Applied Catalysis B: Environmental, 43 (2003) 151–162. DOI:10.1016/S0926-3373(02)00297-7
- Macrì D., Sutcliffe S., Lettieri P., Fluidized bed sintering in TiO2 and coke systems, Chemical Engineering Journal, 381 (2020) 122711. DOI:10.1016/j.cej.2019.122711
- Mahato N., Cho M.H., Graphene integrated polyaniline nanostructured composite coating for protecting steels from corrosion: synthesis, characterization, and protection mechanism of the coating material in acidic environment, Construction and Building Materials, 115 (2016) 618–633. DOI:10.1016/j.conbuildmat.2016.04.073
- Maurer S., Wagner E.C., van Ommen J.R., Schildhauer T.J., Teske S.L., Biollaz S.M.A., Wokaun A., Mudde R.F., Influence of vertical internals on a bubbling fluidized bed characterized by X-ray tomography, International Journal of Multiphase Flow, 75 (2015) 237–249. DOI:10.1016/j.ijmultiphaseflow.2015.06.001
- Mawatari Y., Koide T., Ikegami T., Tatemoto Y., Noda K., Characteristics of vibro-fluidization for fine powder under reduced pressure, Advanced Powder Technology, 14 (2003) 559–570. DOI:10.1163/156855203322448345
- Mema I., Wagner E.C., van Ommen J.R., Padding J.T., Fluidization of spherical versus elongated particles - experimental investigation using X-ray tomography, Chemical Engineering Journal, 397 (2020) 125203. DOI:10.1016/j.cej.2020.125203
- Morooka S., Kusakabe K., Kobata A., Kato Y., Fluidization state of ultrafine powders, Journal of Chemical Engineering of Japan, 21 (1988) 41–46. DOI:10.1252/jcej.21.41
- Nam C.H., Pfeffer R., Dave R.N., Sundaresan S., Aerated vibrofluidization of silica nanoparticles, AIChE Journal, 50 (2004) 1776–1785. DOI:10.1002/aic.10237
- Nasri Lari H., Chaouki J., Tavares J.R., De-agglomeration of nanoparticles in a jet impactor-assisted fluidized bed, Powder Technology, 316 (2017) 455–461. DOI:10.1016/j.powtec.2017.02.042
- Prabhu S., Poulose E.K., Silver nanoparticles: mechanism of antimicrobial action, synthesis, medical applications, and toxicity effects, International Nano Letters, 2 (2012) 32. DOI:10.1186/2228-5326-2-32
- Quevedo J.A., Pfeffer R., In situ measurements of gas fluidized nanoagglomerates, Industrial & Engineering Chemistry Research, 49 (2010) 5263–5269. DOI:10.1021/ie9015446
- van Ommen J.R., King D.M., Weimer A., Pfeffer R., van Wachem B., Experiments and modelling of micro-jet assisted fluidization of nanoparticles, The 13th International Conference on Fluidization, (2010). <https://dc.engconfintl.org/fluidization_xiii/66> accessed 19042023.
- Wu K., Galli F., de Tommaso J., Patience G.S., van Ommen J.R., Experimental methods in chemical engineering: Pressure, The Canadian Journal of Chemical Engineering, 101 (2023) 41–58. DOI:10.1002/cjce.24533
- Zhang X., Zhou Y., Zhu J., Enhanced fluidization of group A particles modulated by group C powder, Powder Technology, 377 (2021) 684–692. DOI:10.1016/j.powtec.2020.09.035
- Zhou L., Zhang F., Zhou T., Kage H., Mawatari Y., A model for estimating agglomerate sizes of non-magnetic nanoparticles in magnetic fluidized beds, Korean Journal of Chemical Engineering, 30 (2013) 501–507. DOI:10.1007/s11814-012-0170-5
Authors’ Short Biographies
Rens Kamphorst

MSc Rens Kamphorst is a PhD researcher in the department of Chemical Engineering at Delft University of Technology (The Netherlands). In 2020 he completed his MSc in Chemical Engineering, also at this university. His research is focused on atomic layer deposition in a fluidized bed consisting of cohesive powders.
P. Christian van der Sande

MSc Christian van der Sande is a PhD researcher in the department of Chemical Engineering at Delft University of Technology (The Netherlands). He completed his MSc in Chemical Engineering with a specialization in process engineering at the same university. His research activities involve hydrodynamic studies with radiation-based imaging methods to study gas hold up, flow patterns and flow velocities inside multi-phase reactors. He has supervised over 10 BSc and MSc students for their thesis work.
Kaiqiao Wu

Dr. Kaiqiao Wu obtained his PhD from University College London in 2020. He has published several works of gas–solid fluidization in international journals, and has presented at conferences. He has won prizes for best talk in sessions, and placed second in the IChemE Young Researcher Awards at UK-China International PTF VII, 2019, and also received the Springer Theses Award for recognizing outstanding PhD research in 2021. He is currently a postdoctoral researcher at TU Delft.
Evert C. Wagner

Ing. Evert Wagner is a research assistant at Delft University of Technology, The Netherlands. He obtained a BSc degree in Applied Physics at the Technische Hogeschool, Rijswijk. Starting at TU Delft in 2006, he has been involved in most of the development of the X-ray setup used in this paper. He’s a co-author of over 30 papers using this experimental technique.
Kristen David

Ing. Kristen David is a lab manager at Delft University of Technology (The Netherlands). She obtained her BSc degree in Chemical Engineering at De Haagse Hogeschool in Den Haag in 2019. She started at TU Delft on the same year and has been involved in managing the ML-1 labs of the Product and Process Engineering group of the Chemical Engineering department.
Gabrie M.H. Meesters

Dr. Gabrie Meesters has 27 years of industrial formulations experience at Gistbrocades, Genencor International and DSM. He has 23 years of experience as a Part-Time Professor at TU Delft in particle technology and product design. From January 2019, he became a fulltime Assistant Professor at the TU Delft, Faculty of Applied Sciences, Product and Process Engineering. He is a contributor to several books on formulation. He is the editor of three books on product design and solids processing. He published over 70 refereed papers, has more than 20 patents and supervised more than 100 BSc, MSc and PhDs. He is a regular speaker at conferences and workshops. He was the organizer of the 2010 Partec and the 2010 World Congress on Particle Technology in Nuremberg, Germany.
J. Ruud van Ommen

Professor of Chemical Engineering at Delft University of Technology (The Netherlands). He obtained his PhD degree at Delft in 2001. He has been Visiting Professor at Chalmers University of Technology (Gothenburg, Sweden) and the University of Colorado (Boulder, USA). In recent years, he expanded his research from chemical reactor engineering to the scalable production of advanced, nanostructured materials. In 2011, he started an ambitious program (funded by an ERC Starting Grant) to investigate the interplay between agglomeration and coating of nanoparticles in the gas phase. He has published about 200 journal papers, of which a considerable part on powder technology.
 https://ror.org/02e2c7k09


;%0A%09%09%09newWindow.document.open();%0A%09%09%09newWindow.document.write('<img src=%22./Graphics/41_2024007_11.jpg%22>');%0A%09%09%09newWindow.document.close();%0A%09%09)
;%0A%09%09%09newWindow.document.open();%0A%09%09%09newWindow.document.write('<img src=%22./Graphics/41_2024007_12.jpg%22>');%0A%09%09%09newWindow.document.close();%0A%09%09)
;%0A%09%09%09newWindow.document.open();%0A%09%09%09newWindow.document.write('<img src=%22./Graphics/41_2024007_13.jpg%22>');%0A%09%09%09newWindow.document.close();%0A%09%09)
;%0A%09%09%09newWindow.document.open();%0A%09%09%09newWindow.document.write('<img src=%22./Graphics/41_2024007_14.jpg%22>');%0A%09%09%09newWindow.document.close();%0A%09%09)
;%0A%09%09%09newWindow.document.open();%0A%09%09%09newWindow.document.write('<img src=%22./Graphics/41_2024007_15.jpg%22>');%0A%09%09%09newWindow.document.close();%0A%09%09)
;%0A%09%09%09newWindow.document.open();%0A%09%09%09newWindow.document.write('<img src=%22./Graphics/41_2024007_16.jpg%22>');%0A%09%09%09newWindow.document.close();%0A%09%09)
;%0A%09%09%09newWindow.document.open();%0A%09%09%09newWindow.document.write('<img src=%22./Graphics/41_2024007_17.jpg%22>');%0A%09%09%09newWindow.document.close();%0A%09%09)