Abstract
Fugitive particulate matter (FPM) refers to a mixture of solid particles and liquid droplets that are released into the air without passing through confined flow equipment. These emissions of FPM can originate from natural processes and anthropogenic activities. FPM emissions are an important source of PM2.5. Precisely measuring the size, concentration, and other properties of such particulate matter is crucial for effectively controlling emission sources and improving air quality. However, compared with particulate matter emission from stationary sources, it is difficult to monitor the FPM effectively owing to its dispersive and irregular emissions. Traditional measuring methods for FPM are based on sampling, which is a point monitoring approach and can be time-consuming. In recent years, several new techniques based on optical principles, image-based processes and low-cost sensors have been developed and applied for FPM measurement, with the advantages of spatial and time resolutions. The current state and future development of FPM measurements are reviewed in this paper.
1. Introductions
Particulate matter (PM) has drawn massive attention owing to its great impact on human health and wealth (Amoushahi et al., 2022; Chen et al., 2019; Hassan et al., 2022), environment, and global climate (Hassan et al., 2020; Mutlu, 2020; Yang et al., 2021). Fugitive particulate matter (FPM), which refers to a mixture of solid particles or liquid droplets that are not discharged into the atmosphere through confined flow equipment (e.g., stack, chimney, pipe, vent, or duct), contributes a great portion to the total outdoor PM emission. Unlike particulate matter emitted from definable and stationary point sources, FPM is generally discharged from everywhere, such as anthropogenic land use, urban traffic, industrial activities, wind erosion, vegetation growth, and other natural processes. The emission intensity of FPM is different from site to site, and it often fluctuates temporally and spatially. Accordingly, it is challenging to develop the time- and space-resolved measurement for FPM emission but beneficial to understand its generation, track its migration, evaluate its effects and damage on human beings and the environment, and consequently figure out reliable mitigation measures to reduce FPM.
The objective of this review is to provide an overview of the current state and trends in measuring fugitive particulate matter. We will first introduce the main sources and key properties of FPM, analyze its effects and the current measurement standards on it. Then, we will provide a critical overview of the conventional methods and discuss the new trends for FPM measurement. Finally, we will propose a brief outlook on the future of FPM measurement.
1.1 Sources of FPMs
Typically, sources of FPMs can be separated into two categories: natural processes and anthropogenic activities. Common natural sources include soil & desert dust (Hassan et al., 2016; Vos et al., 2021), wildfire smoke (Sedlacek et al., 2018), volcanic ash (Sasaki et al., 2021), sea spray aerosol (February et al., 2021), and pollen & fungi grains (de Weger et al., 2020). The geomorphologic and geologic conditions mainly contribute to the compositions and distribution of the natural FPMs. For instance, arid regions are plagued by wind-blown soil, and coastal areas are familiar with sea salt-based or biogenic-enriched aerosols. Comparing with natural processes, human activities create more FPMs, mainly derived from traffic & transportation (Kuhns et al., 2010; Pervez et al., 2018; Wang H. et al., 2023), heavy constructions (Noh et al., 2018), agriculture & livestock operations (Gladding et al., 2020; Liu Y. et al., 2022), mining & quarries (Chang et al., 2010; Froyd et al., 2019), the metal industry (Zhang et al., 2022), and residential combustion (Nugraha et al., 2021). The main sources and activities that contribute to the FPM emissions are listed in Table 1.
Table 1
Fugitive particulate matter sources and activities.
| Source |
Activity |
| From natural processes |
| soil & desert dust |
windy weather / sandstorm |
| wildfire smoke |
forest fire / prairie fire / hill fire |
| volcanic ash |
volcanic eruption |
| sea spray aerosol |
air bubbles bursting at the air-sea interface |
| pollen & fungi grains |
pollination / spore dispersal |
| From anthropogenic activities |
| traffic & transportation |
roads / automotive exhaust / loading and offloading |
| heavy constructions |
industrial & commercial building / road, bridge and other public constructions |
| agriculture & livestock operations |
straw burning / grain harvest / storage and distribution / pasture mowing / animal feed |
| mining & quarrying |
blasting / crushing / conveying and storage / heavy equipment operations |
| metal processing |
sintering / blasting / casting / plating |
| residential combustion |
cook / heating / cigarettes / incense |
Particle size has a great impact on the suspension, transport and distribution of FPM in the atmosphere. The residence time of submicron particles is on the order of 102–103 h, assuming the absence of precipitation. Particles with diameters between 1 μm and 10 μm can exist in the air for several days (Esmen and Corn, 1971). The typical residence time for 10 nm particles is about 15 minutes owing to their primarily coagulation with larger particles (Kim et al., 2021). The potential drift distance of particles is also related to particle size as well as the initial injection height of the particle and the intensity of atmospheric turbulence. Fugitive dust larger than about 100 μm is likely to settle out near the source under a typical wind speed of 16 km/h. Particles in the range of 30 μm to 100 μm are likely to undergo impeded settling without extra wind uplift. Smaller particles with much slower gravitational settling velocities are much easier to travel following atmospheric turbulence. Particles propelled higher from the source also travel farther. For instance, volcanic ash can have an intercontinental diffusion (Ansmann et al., 2011).
Particle size also has a major influence on the transport of particulate in the human respiratory system since the deposition efficiency of particles in the respiratory tract depends upon their size. Large particles can be hindered by the nasal hair (rhinothrix), medium particles can reach the upper respiratory tract, and small particles can deposit on alveoli or even invade the blood-circulatory system.
PM10 (particulate matter with a diameter of 10 μm or less in size) and PM2.5 (particulate matter with a diameter of 2.5 μm or less in size) are currently common size bases for particulate matter. However, some other particle size bases, listed in Table 2, are used in research as well.
Table 2
Description of common particle size bases.
| Name |
Description |
| TSP |
Total Suspended Particulate, as measured by the standard high-volume air sampler, has a relatively coarse size range. It was the basis for the previous primary National Ambient Air Quality Standards of the U.S. (NAAQS) for PM and is still the basis of the secondary standard. |
| SP |
Suspended Particulate, which is often used as a surrogate for TSP, is defined as PM with an aerodynamic diameter no greater than 30 μm. |
| IP |
Inhalable Particulate, which is defined as PM with an aerodynamic diameter no greater than 15 μm, can get into the human body by breath. |
| PM10 |
PM with an aerodynamic diameter no greater than 10 μm. It is the current primary NAAQS for particulate matter, representing the particle size range of the greatest regulatory interest. It is also known as Thoracic particles since it may reach the upper part of the airways and lungs. |
| PM10–2.5 |
PM with diameters generally larger than 2.5 μm and smaller than or equal to 10 μm. It is also known as Coarse particles and is primarily generated from mechanical operations. |
| PM2.5 |
PM with an aerodynamic diameter no greater than 2.5 μm. It is also known as alveolar particles, indicating that it can penetrate more deeply into the lungs and may reach the alveoli. It is called Fine Particulate (FP) as well. |
| UFP |
Ultra Fine Particulate, which is defined as PM with an aerodynamic diameter no greater than 0.1 μm, can penetrate tissues and enter the bloodstream. |
Different sources contribute to various size distributions of FPM. It is generally a narrow size distribution and small mean size for biomass-burning smoke, which is dominated by submicron particles (Wang F. et al., 2019). However, the size of smoke particles varies along different combustion phases (Ordou and Agranovski, 2019). Particles generated by mechanical force are normally widely distributed in size (Zhang et al., 2022). Sea spray aerosols can range from a few tens of nanometers to tens of micrometers (February et al., 2021). Moreover, the size distribution of some FPMs may show bimodal or multimodal patterns (Chang et al., 2010; Chen et al., 2019).
1.2.2 Mass concentration, emission rate and emission factors
PM10 and PM2.5 mass concentrations (γm) are the most commonly used criteria to evaluate air quality. The criteria can further be separated into 24-hour average values and annual mean values. Most countries and many international organizations have issued their standards or recommend thresholds for PM10 and PM2.5 mass concentrations, as listed in Table 3. However, no current standards are set up for FPM.
Table 3
Criteria for PM10 and PM2.5.
| Criteria |
PM10 |
PM2.5 |
| Annual (μg m−3) |
Daily (μg m−3) |
Annual (μg m−3) |
Daily (μg m−3) |
| WHO |
15 |
45 |
5 |
15 |
| USA |
— |
150 |
12 |
35 |
| China |
70 |
150 |
35 |
75 |
| EU |
40 |
50 |
25 |
— |
| Japan |
— |
— |
15 |
35 |
| Korea |
50 |
100 |
15 |
35 |
Before determining the mass emission rate (m˙), the volume flow rate of the flue (V˙) should be measured. Then, the mass emission rate can be calculated by multiplying the mass concentration of the measured pollutant by its volume flow rate, as shown in Eqn. (1):
The mass emission factor (F˙) is a representative value indicating the emission intensity of a pollutant generated from a specific activity. It can be calculated following Eqn. (2):
where a represents the activity rate.
The mass emission factor is usually expressed as the weight of the pollutant divided by the unit weight (g kg−1), volume (g m−3), distance (g km−1), or duration of the activity that emits the pollutant (g h−1).
1.2.3 Chemical components
Although the composition of FPM highly depends on its source, it can be roughly classified into five categories: minerals, metallic particles, soot, inorganic salts and biogenic substances. Wind-blown dust from dried land is mainly dominated by minerals, especially quartz. Volcanic ash contains more metallic minerals, such as Al2O3, Fe2O3 and MgO. Construction, mining and quarrying, which utilize stones and ores, contribute to the mineral dust emission. Metal processing generates both metal-rich and mineral particles. Hence, mineral dust is the major PM component at a global scale (Minguillón et al., 2013). Sea spray aerosols are little droplets containing inorganic salts (e.g. NaCl) or biogenic substances. Animal- and vegetation-related particles belong to biogenic ones. Soot is mainly generated from biomass or fuel combustion, including wildfire, residential combustion, and working engines. Non-exhausted PM from traffic, originating from tire wear, brake use and road dust resuspension, mainly consists of mineral particles. Since the reduction of exhaust emissions is performed worldwide, non-exhausted PM emissions will dominate traffic-related emissions in the near future.
1.2.4 Shape and morphology
Mineral dust typically has complex irregular shapes derived from its intrinsic crystal orientation and the force loading from crushing and abrasion (Kalashnikova and Sokolik, 2004; Nousiainen, 2009). Metallic particles, which are discharged from high-temperature processes like burning and metal cutting, are usually spherical (Sanderson et al., 2014). Soot is always amorphous and forms chain-like aggregates during its aging period (Adachi et al., 2010). Pollen and other biogenic particulates are often nonspherical (Amina et al., 2020), although it is commonly assumed that pollen grains are spherical (Theilade et al., 1993). Inorganic salts, including NaCl, sulfates and nitrates, are basically hydrophilic. Therefore, inorganic aerosols contain moisture at relatively high humidity levels, resulting in a spherical shape. Otherwise, the shape may be irregular (Ueda, 2021).
1.2.5 Optical properties
Complex refractive index (m) is the fundamental parameter to describe FPM, expressed in Eqn. (3).
where the real part, n is the refractive index indicating the degree of light dispersion through the media, and the imaginary part, η is the absorption coefficient, donating the light attenuation when it propagates through the media. If a particle can absorb light, its η is positive.
Among all the common FPMs, black carbon (BC) is the most light-absorbing component with an imaginary part ranging from 0.4 to 0.8 (Kelesidis and Pratsinis, 2019). Organic carbon (OC), also known as brown carbon (BrC), absorbs light as well (Zhang et al., 2017). Mineral and metallic particles both slightly absorb light (Ebert et al., 2002; Kandler et al., 2007).
The extinction coefficient (bext) of FPM includes the scattering coefficient and absorption coefficient (as detailed in Section 2.3), and it can be converted to visibility (Vis) by adapting the Koschmieder equation (Cao et al., 2012; ten Brink et al., 2018; Xiao et al., 2014):
where k is a constant assumed to be 3.912.
Single scatter albedo (SSA) is defined as the ratio of particle-scattering efficiency to the total extinction efficiency. It is a key parameter in radiative transport models for estimating aerosol direct radiative forcing (Jeong et al., 2020).
1.3 Effects and damage from FPMs
1.3.1 Human health
Short-term and long-term exposure to particles increases the risk of developing cardiovascular and respiratory diseases, as well as lung cancer (Brook et al., 2010). Outdoor PM2.5 is the fifth-largest risk factor for premature mortality worldwide (Feigin et al., 2016). Infants, the elderly, and outdoor workers are the most likely to be affected. The health effects of FPMs depend considerably on their size. Coarse PM reaches the upper part of the airways and lungs, while fine PM can penetrate more deeply into the lungs and may reach the alveoli. UFP can even directly translocate into the bloodstream and cells (Martinelli et al., 2013). Chemical composition issues in the health effects as well. Exposure to metal or metal-containing dust increases the risk of cardiovascular dysfunction (Ain and Qamar., 2021). Black carbon, as a universal carrier of various toxic constituents, has a strong association with premature mortality (Wang Y. et al., 2021). Inhalation of sand and concrete dust can lead to silicosis, an irreparable form of lung damage (Hoy and Chambers, 2020). Additionally, inhalation of pollen and other biogenic aerosols can induce allergy and respiratory problems (D’Amato et al., 2020).
1.3.2 Wealth and safely
FPMs impair visibility. Due to the prominent ability of light extinction, fine PM contributes more than gas pollutants to visibility degradation (Yu et al., 2016). On roads, visibility reduction increases the risk of accidents and escalates the costs associated with vehicle cleaning and equipment maintenance. FPM emissions also result in the cancellations of flights and avoidance of outdoor activities (Guo et al., 2021). For example, sudden volcanic ash discharges directly affect aircraft engines, causing them to stall and posing a threat to human and cargo safety (Prata, 2008). Heavy wind erosion of soils and dust storms diminish land values. Excessive emissions can also damage vegetation and reduce crop production. Burning smoke and flammable fine powders can cause fire or blast damage if ignited.
1.3.3 Environment and global climate
Various FPMs contribute differently to climate forcing owing to their distinct optical properties. For instance, black carbon aerosols strongly absorb solar radiation, leading to a warming effect (Bond et al., 2013). In contrast, mineral dust cools the atmosphere due to its ability to increase radiation reflection into space (Choobari et al., 2014). Besides, FPMs also have an indirect effect on the climate by modifying the properties of clouds given that particles act as cloud condensation nuclei (Williamson et al., 2019). For instance, soot is an efficient ice-nucleating particle that influences cirrus formation at the tropopause. Although the relatively short residence time and highly variable spatial distribution in the atmosphere further complicate the estimation of net effects of FPMs on the global climate, scientists are trying to include FPM emissions into global atmospheric models (Philip et al., 2017).
1.4 Current standards on FPM emissions
The most widely used method for PM measurements is based on sampling, and mass concentration, emission rate and emission factors are the highly concerned parameters. The International Organization for Standardization (ISO) has released the measurement standards for PM in the atmosphere and from the stationary source (ISO 11771-2010 /ISO 10155-1995 /ISO 9096-2017), and many countries have all set domestic standards. Since there are no specific standards for FPM, the above-mentioned ones are used for FPM measurements. In addition, some monitoring methods are recommended for FPM emissions by some institutions. The US Environmental Protection Agency (EPA) Method 22 “Visual Determination of Fugitive Emissions” was proposed. Through this method, viewers position themselves to have an unobstructed view of potential emissions. If visible emissions are observed, the viewer measures the duration of time that the visible emissions were present during the observation period. Method 22 is often used in the regulation of fugitive emissions from toxic materials that escape during material transfer (i.e. asbestos removal), escape from buildings housing material processing or handling equipment (i.e. asbestos presence in building demolitions), and/or are not captured by an exhaust hood or are emitted directly from process equipment. Method 9, known as the “Visible Determination of Opacity of Emissions from Stationary Sources,” involves the recording of readings as a percentage of opacity in terms of black and white particulate plumes or dense clouds of matter. While Method 9 is used extensively to sight and control visible emissions from stationary and non-stationary industrial processes, it is also used to measure visible emissions from unconfined places such as roads and bulk material storage areas.
2. Conventional methods for FPM measurement
As mentioned in Section 1.4, sampling methods universally accepted for PM measurements are equally applicable to FPM measurements. However, due to the temporary and unsteady-in-position of FPM emissions, it is essential to implement well-performed sampling strategies and consider the use of multiple measurements to gather comprehensive information about FPM emissions.
2.1 Sampling strategies and conditions
2.1.1 Upwind-downwind method
Upwind-downwind sampling requires a high density of vertical and/or horizontal measurements to determine the PM emission rate. Measurements of FPM emission rates are usually performed using this method, which has been described in detail in the previous study (Cowherd et al., 1974). For instance, particulate emission rates from gravel processing sites and traffic-busy roads were calculated on the basis of a mass balance approach using the upwind/downwind technique, respectively (Chang et al., 2010; Etyemezian et al., 2004).
2.1.2 Wind tunnel method
The wind tunnel method is suitable for measuring fugitive dust emissions from dried land. To conduct this method, a wind tunnel with a working section of several tens of meters in length, several meters in width, and height is required. A blower works at the tunnel entrance and PM monitors sample the wind-blown dust along the tunnel to evaluate the dust emission properties. This method has been successfully applied to measure fugitive emissions from soil surfaces (Fitz et al., 2021; Gao et al., 2020; Roney and White, 2006).
2.1.3 Isokinetic sampling method
The isokinetic sampling method, which means the sampling velocity is the same as the FPM/airflow, is employed to prevent incorrect lower or higher particle concentrations owing to anisokinetic effects from particle bypassing or swarming, respectively.
2.1.4 Size-selective inlet and cascade impactor
A size-selective inlet removes larger particulates and allows the particulate smaller than the designed size to pass. By applying a size-selective inlet, PM10, PM2.5 or UFP can be separated from the pollutant flow (Su et al., 2020). Cascade impactors operate on the principle of curvilinear motion of particles in the aerosol stream, and as a result, particles of various sizes are divided and collected on different plates. In this way, the size distribution of the sampling FPM is obtained (Manojkumar and Srimuruganandam, 2022).
2.2 Filter-based techniques
2.2.1 Direct gravimetric analysis
In direct gravimetric analysis, a filter is weighted by an electronic microbalance before and after sampling under constant temperature and humidity conditions. The mass change is used to calculate the degree of PM contamination (Lei et al., 2020). The collected filter can be used for offline chemical component analysis (Guo et al., 2021).
However, despite providing accurate and reliable data, the direct gravimetric method is time-consuming and inapplicable to FPM measurement.
2.2.2 Tapered element oscillating microbalances (TEOM)
Unlike the direct gravimetric method, the TEOM method uses a hollow glass tube as a microbalance for real-time mass loading measurement. Particles continuously deposit on the glass tube, increasing its inertia and consequently tuning its oscillation frequency. This frequency change is converted to an electrical signal, which is amplified for detection.
The TEOM method offers the advantage of high time resolution (2 seconds) (Sullivan et al., 2017), but it should be noted that this method is sensitive to temperature and moisture. Therefore, the incoming sample flow is heated and kept constant. Depending on these measuring conditions, it is difficult to precisely measure the semi-volatile particles. A filter dynamic measurement system (FDMS) is specially designed to overcome this drawback. TEOM instruments equipped with FDMS are operated alternately between a measuring cycle and a reference cycle. The mass loss of the glass tube in the reference cycle is used to correct the output in the measuring cycle, thereby increasing the accuracy of the TEOM results (Grover, 2005).
2.2.3 Beta attenuation monitoring (BAM)
The main principle of BAM is based on Lambert–Beer’s law. When airflow passes through the filter tape, particles are left on it. The beta radiation is attenuated by the attached particles before reaching the detector on the other side of the filter tape. The attenuation is an exponential function of the deposit amount and it is roughly not affected by particle composition or other properties. Hence, the mass concentration of particles can be examined. However, the moisture in the air may cause an error, so a heater is necessarily equipped at the sample inlet. Typically, the BAM method can be used for continuous online measurement, providing the mass concentration data hourly (Mueller et al., 2013). Moreover, offline chemical analysis can carry out on the used filter tape (Raja et al., 2017).
2.2.4 Offline characterization
Filter-based offline characterization has low time resolutions and fails to reflect the dynamic nature of the fugitive pollution sources, nevertheless, it gives more information about the particulate.
Electron microscopy (EM) techniques are valuable to detect and quantify the shape and size of particles (Gelencsér et al., 2011; Omidvarborna et al., 2018).
Ion chromatography (IC) is performed to examine the concentrations of the water-soluble ions in the particulate (Guo et al., 2021; Hu et al., 2019; Tian et al., 2020; Xiao et al., 2014; Zou et al., 2018).
Elements and trace metals, including Ca, Sc, Ti, V, Fe, Co, Zn, and Mo, were analyzed by X-ray fluorescence (XRF) spectrometry (Gao et al., 2015; Tian et al., 2020; Xiao et al., 2014) or Inductively Coupled Plasma-Mass Spectrometry (ICP-MS) (Hu et al., 2019; Philip et al., 2017).
The concentrations of OC and element carbon (EC) are analyzed by a thermal/optical carbon analyzer (Guo et al., 2021; Hu et al., 2019; Lei et al., 2020; Tian et al., 2020; Xiao et al., 2014; Zou et al., 2018).
In general, filter-based techniques are the most technically mature. However, the sampling conditions should be tightly controlled to reduce the effect of sampling conditions on accuracy (Le and Tsai, 2021).
2.3 Optical-based techniques
2.3.1 Basics of light scattering, absorption and extinction
The scattering pattern of a particle refers to its scattering efficiency as a function of the angle. It depends on the particle size, shape, refractive index, and the wavelength (λ) of the excitation light. The distribution of the scattering light as a function of a dimensionless particle size parameter, α, assuming the refractive index equals 1.33, is demonstrated in Fig. 1.
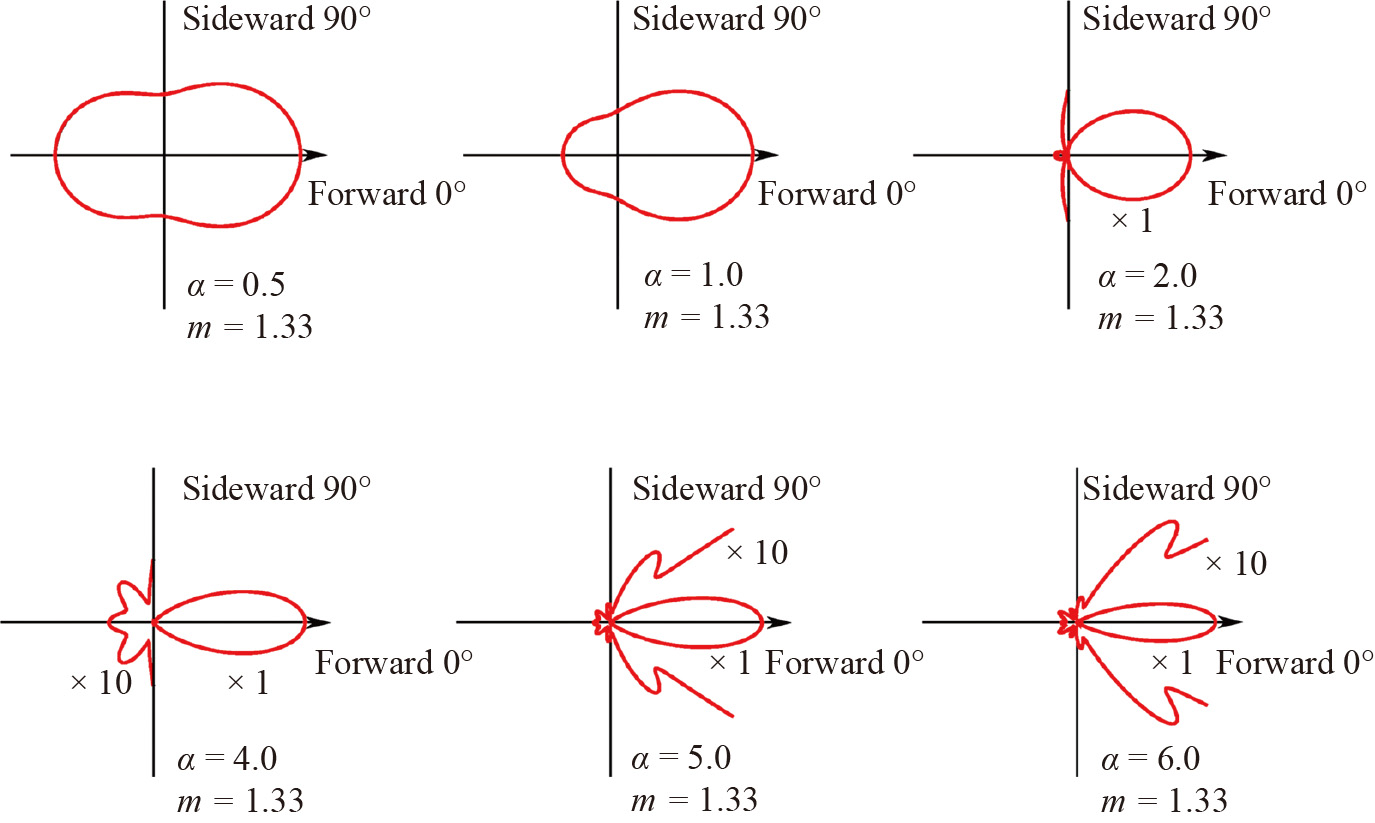
It is shown that the smaller the particle is (compared to the excitation wavelength), the more spherical the scattering pattern is. For large particles (e.g. α ≥ 4.0 in Fig. 1), most of the scattered intensity deviates with smaller angles, and side lobes appear as the diameter increases. Besides, the polarization of scattering light is also influenced by the particle properties, which are not shown in Fig. 1. Therefore, the particle size, shape, component, and concentration can be predicted using the information from the scattering signature theoretically. Mie theory (Hergert and Wriedt, 2012) is the most common description of light scattering. Despite its simple hypothesis that a uniform sphere is illuminated by a monochromatic plane wave, this theory has proved to be quite robust and applicable in particle size and concentration prediction.
When light passes through a cloud of particles, its intensity (I0) is attenuated because of the scattering and absorption effects of the particles, as seen in Fig. 2.
Assuming the particles disperse uniformly in the illuminated area, and then the transmitted light intensity (I) can be described with Eqn. (5).
where L is the path length of the light beam through the particles.
The extinction coefficient (bext) can be further divided into two parts, the scattering coefficient (bsca) and the absorption coefficient (babs).
bext, as a function of the particle number, diameter D, wavelength of the incident light λ, and the complex refractive index m, can be computed by Mie theory.
2.3.2 Nephelometer
A nephelometer is the most commonly used optical equipment for PM measurement. The pollutant air is sampled into the measuring chamber of the nephelometer, illuminated by a light beam. The scattering light is detected by a light detector set to one side of the light source. Despite the intensity is also related to the refractive index, shape, and size distribution of the measured particles, nephelometers are calibrated to a known particulate, then use an environmental-related factor to compensate for the error accordingly. After calibrating to a known particulate, the PM mass concentration can be evaluated from the scattered light intensity.
The DustTrakTM (TSI Co., Ltd.) is a classical nephelometer-type tool to determine the mass concentration in real time. The DustTrak aerosol monitors (model 8520, TSI Co., Ltd.) were run in the kitchens and living rooms of the selected sites to measure fine particulate matter (Sidra et al., 2015).
Portable In Situ Wind Erosion Laboratory (PI-SWERL) is a portable wind tunnel surrogate, equipped with DustTrak (Etyemezian et al., 2007). It is contained in an open-bottomed, cylindrical chamber operated by a direct-current motor and set parallel to the soil surface. By adjusting the rotation speed, the desired high winds with known wind shear are created and the soil and dust particles are lifted. With the application of PI-SWERL, the behavior of FPM emissions from unpaved roads, farmlands, and deserts was studied without the deployment of flux tower systems (Kuhns et al., 2010; Sweeney et al., 2021; Vos et al., 2021).
Thanks to the calibration method, the measurement accuracy depends on the assumption that the properties of FPM are constant, except for the concentration. However, FPM emissions are complicated and diverse. Single- angle scattering measurement can result in unreliable results. To solve this problem, SHARP-5030i (Thermo Scientific Co., Ltd.) measures PM2.5 mass concentrations based on the principles of particle light scattering (nephelometer) and beta attenuation (Su et al., 2020). The beta attenuation data can be used to calibrate the nephelometer.
2.3.3 Particulate counter
Optical particle counter (OPC) and condensed particle counter (CPC) are both used to measure particle number concentration and size distribution. OPC is based on sideward light scattering. The aerosols pass through the light-illuminated measuring spot particle by particle and the induced light scattering signal is detected by the light detector simultaneously. The particle size is a function of the scattering light intensity and the particle number is counted during the measuring period. Consequently, the particle number size concentration is achieved. CPC introduces condensation equipment before OPC, inducing the particle size growth by absorbing liquid, and therefore it can measure smaller aerosols with diameters of a few nanometers.
2.4 Electrical methods
2.4.1 Electrical low-pressure impactor (ELPI)
The ELPI (Dekati Ltd.) operates at 30 LPM and ambient particles are charged when the air sample passes through a unipolar charger. The charged particles are size-classified by aerodynamic diameter following the same principle as the cascade impactor mentioned in Section 2.1. The electrical currents arising from particle deposition are measured simultaneously from 12 stages with a multichannel electrometer in real time. Therefore, the ELPI is capable of measuring the particle number concentration over a wide size range (7 nm–10 μm) with 1–2 s resolution (Holmén et al., 2007).
2.4.2 Differential mobility analyzer (DMA)
The intake particles are electrically charged first and separated by deflection since the particles with different sizes have different electrical mobility. If it is combined with the CPC technique, known as scanning mobility particle sizer (SMPS), the lower limit of detection (several nanometers) is reached. Fast mobility particle sizer (FMPS) is another derived technique from DMA. It combines DMA with an electrometer to improve the time resolution to one second.
2.5 Real-time chemical characterization
The mass spectrometry techniques are quickly developed for the real-time chemical characterizations of ambient particulates, including aerosol mass spectrometer (AMS), high-resolution time-of-flight AMS, aerosol chemical speciation monitor, single-particle mass spectrometers, and aerosol time-of-flight mass spectrometer. The comparison between these techniques is well illustrated in Ref. (Wang F. et al., 2021).
However, continuous measurements at high time resolution remain impractical, and like most offline methods, volatile or reactive aerosol species can change before analysis.
3. New trends for FPM measurement
Conventional methods for FPM measurement all belong to point measurement techniques since they require a sampling process, which means that the space resolutions of these techniques are poor. Rigorous sampling strategies and multi-measuring equipment should be arranged to reveal the spatial distribution and movement of FPM. However, it is impractical to perform this arrangement considering the equipment is cumbersome and expensive. To achieve the high space- and time-resolved investigation of FPM, some cheap, portable, and remote sensing techniques are being developed.
3.1 Open-path optical techniques
3.1.1 Light detection and ranging (Lidar)
Lidar is an active light scattering detection method, based on the analysis of the radiation backscattered from a target. This technique is often used in climate research to measure altitude-dependent aerosol extinction. For instance, the distribution and movement of volcanic ash were observed with the ground-based lidar systems of the European Aerosol Research Lidar Network (EARLINET) (Ansmann et al., 2011). The strong and long-lasting stratospheric aerosol perturbation was also monitored all over Europe with EARLINET (Baars et al., 2019).
Lidar remote sensing has been introduced to measure the FPM near the ground. A scanning lidar system was applied to measure FPM emissions from different industrial sources simultaneously, determining the potential of lidar for tracking and differentiating plumes from various sites (Pal et al., 1998). The reliable detection of early fire was accomplished using lidars operating at 355 nm, 532 nm, 1064 nm, and 1540 nm, and the maximum detection distance relied on the wavelength (Lavrov et al., 2003). A three-wavelength scanning lidar system was built to simultaneously monitor FPM emissions from agricultural operations and road traffic. The mass concentration and size distribution were inversed assuming a bimodal lognormal size distribution and calibrated by standard facilities, including optical particle counters, PM10 and PM2.5 samplers, multistage impactors, and an AMS (Zavyalov et al., 2006).
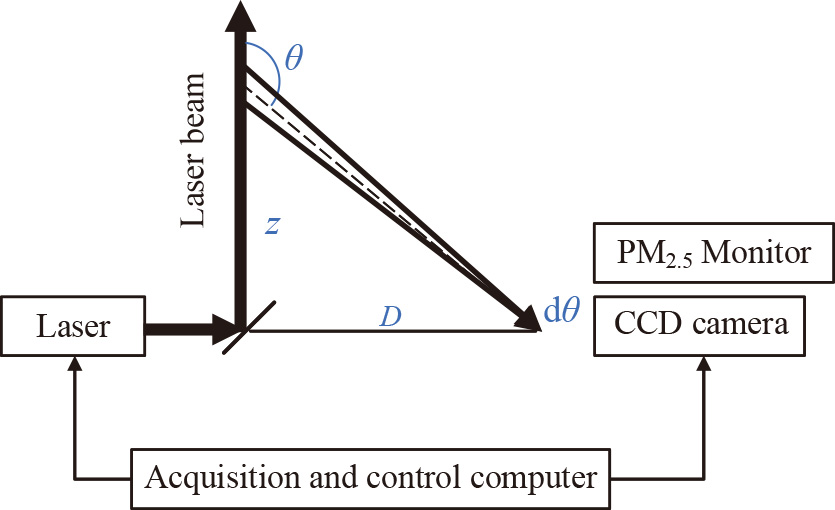
Traditional lidars are monostatic, requiring expensive electronics to measure the time of flight of the backscattered light and its corresponding distance. The overlap effects between the backscattered signal and receiver field of view near ground levels may impact the detection reliability for the nearby pollution. To avoid these disadvantages, a bistatic lidar, named CLidar, was established. In the CLidar, a laser source and a camera fitted with a wide-angle lens were separated several hundred meters away from each other. The laser transmits light vertically into the atmosphere, and the scattering light was imaged by the camera, as shown in Fig. 3. Owing to this setup, the altitude resolution is excellent near ground level, providing an efficient detector of pollution at low altitudes. The aerosol extinction coefficient along the altitude was inverted from the intensities of pixels. A grilling activity was successfully monitored since the aerosol extinction increased from 0.03 km−1 with no grilling to 0.085 km−1 (Kabir A. et al., 2018).
Moreover, the CCD-based scattering Lidar system (including sideward scattering and backward scattering) is verified to be useful to measure particle mass concentration and size distribution of cooking fumes and open smoldering as well (Wang W. et al., 2019; Zhou W. et al., 2020).
3.1.2 Hybrid optical remote sensing (h-ORS)
The h-ORS was mainly developed by the University of Illinois to measure FPM emissions from military-related activities, including back blasts from firing artillery, open burning and detonation, tracked and wheeled vehicle operation, and helicopter landing (Du et al., 2011; Varma et al., 2008; Yuen et al., 2013, 2015, 2017). It combines micro pulse Lidar (MPL), open-path Fourier Transform Infrared spectroscopy/Laser transmissometer (OP-FTIR/OP-LT), and/or filter-based sampling techniques (DustTrak or TEOM). The measurement system is schematically demonstrated in Fig. 4.

2-D PM mass concentration profile and mass emission factors can be calculated using the h-ORS system. First, the 2-D MPL data obtained using scanning mode were converted to the 2-D light extinction profiles with the LIDAR inversion algorithm. Second, the 2-D PM mass concentration profiles were determined from the 2-D light extinction profiles by multiplying a factor. This factor refers to the mass concentration at the reference point (as the blue point shown in Fig. 4) divided by the local light extinction obtained in the first step. The mass concentration at the reference point can be derived from the light extinction calculation performed by OP-FTIR/OP-LT or the results from DustTrak and TEOM, respectively. Last, the mass emission factors can be easily calculated if the wind speed and direction are recorded.
3.2 Image-based optical techniques
3.2.1 Camera-based detection
Biomass burning, especially wildfire, should be monitored and detected as soon as possible to avoid the expansion of combustion. As mentioned in Section 3.1, Lidar is useful to detect fire smoke in its early stage. It is demonstrated here that video monitoring is also effective for this smoke early sensing (Jakovčević et al., 2013). The camera-recorded video was segregated into a photographic sequence, then region segmentation and categorization, motion detection, and chromatic and shape analysis were performed on these photos to finally discriminate fire smoke from fog, clouds, and other stuff.
Besides, the road dust from busy traffic can be monitored by measuring the opacity of fugitive plume emissions. A camera-based light extinction method was described for quantifying the opacities of FPM (Du et al., 2013). This method was validated by performing simultaneous measurements using a co-located laser transmissometer, as shown in Fig. 5. Moreover, the values of the R, G, and B channels, and the grey value were all consistent with the opacities from the OP-LT measurement.
3.2.2 Photographic filter analysis
The direct gravimetric analysis of the filter is time-consuming and strict to the operating procedure. Picture-based filter analysis takes pictures of the filter before and after use and evaluates the mass of particles deposited on the filter depending on the difference of pictures accordingly. A smartphone is both easy to be attained and easy to operate and therefore it is a good option to perform the analysis. A prototype of such a system was proposed recently (Carretero-Pena et al., 2019), as displayed in Fig. 6. A testing box was designed to provide stable lighting conditions, in which a stable LED strip was equipped. The saturation parameter of the picture was proved to be able to estimate the mass concentration of dust deposited on the filter.
3.3 Low-cost, compact, mobile and connectable sensor system
Low-cost PM measurement techniques most commonly rely on the light-scattering-based (nephelometer or OPC) principle, which is available for below 50 USD (Kuula et al., 2019; Yi et al., 2018). PMS7003 (Plantower Co., Ltd.) and SDS011 (Nova Fitness Co., Ltd.) sensors, based on OPC and nephelometry, respectively, were confirmed precision and were linearly correlated with TEOM data (Kaźmierczak et al., 2018). However, these two sensors both had a bias concerning PM2.5 concentrations obtained from TEOM, indicating the importance of calibration of low-cost devices before use. PMS7003 was capable of measuring PM10 and PM2.5 with a measurement range from 0 to 500 μg m−3, signal response of less than 1 s, and resolution of 1–2.5 μm and 2.5–10 μm, respectively (Camarillo-Escobedo et al., 2022). SDS011 was successfully applied in residential biomass combustion monitoring (Nugraha et al., 2021). The data obtained from SDS011 sensors were reliable, but it may cause errors since high RH (over 80 %) negatively affected the sensor response (Liu et al., 2019). Usually, there is a trade-off between the accuracy of measurement and the cost of the sensor, which are both vital to the wide and proper use of low-cost sensors (Castell et al., 2017).
3.3.1 Drone-based measurement and sensors networks
Mobile measurements used to be carried out on airplanes (Froyd et al., 2019; Hobbs et al., 2003; Taubman, 2004; Zhang et al., 2017). The drone is small and exquisite. It can quickly fly to the place where FPM emission happens, facilitating the monitoring of FPM. The fugitive dust at the quarry sites was measured using a Sniffer4D module-equipped drone, providing measurements at 1 s intervals through a light scattering method (Kim et al., 2021). The volcanic ash was detected remotely by drone-based sensors (Sasaki et al., 2021). Small, lightweight, and cheap sensors were integrated for multiple measurements of atmospheric phenomena and related environmental information. For in situ local area measurements, a long-range wireless communication module with real-time monitoring and visualizing software applications was integrated as established in Fig. 7 (Madokoro et al., 2021).
3.4 Real-time laser-induced breakdown spectroscopy
Laser-induced breakdown spectroscopy (LIBS) has been proven to perform elemental microanalysis of PM on filters with high sensitivity (ppm-level) (Marina-Montes et al., 2021). The technique indicates the possibility of automated chemical analysis collaborating with conventional filter-based measurements in quasi-real time.
Moreover, online LIBS in open space detection has also been demonstrated in several field measurements, showing great potential for rapid monitoring and control of particulate emissions generated in public areas, such as toxic dust in a hostile environment of the steel industry (Girón et al., 2018), cigarette smoke in houses (Zhang et al., 2020), and incense smoke near around temples (Qu et al., 2021).
LIBS is a useful and promising tool to determine the elemental composition of FPM in situ. However, this technique is not sufficient for obtaining information on specific particulate sizes because of the breakdown of all particulates.
4. Summary and outlook
FPM has contributed a great portion to the total outdoor PM emissions, and it will account for more than PM emissions from stationary point sources, given that serious regulations and effective control measures are applied to the latter. However, the FPM emissions are irregular, highly dispersive, and intensity-fluctuated. The precise measurement of FPM is challenging but worthy, yet there is currently no uniform regulation or standard measurement procedure in place. In this work, we first introduced the sources of FPMs both natural and artificial, including soil & desert dust, wildfire smoke, volcanic ash, sea spray aerosols, pollen and fungi grains, traffic and transportation activities, heavy constructions, agriculture and livestock operations, mining and quarrying, metal processing, and residential combustion. Although the sources are diverse, the FPM can be sorted into five main categories: minerals, metallic particles, soot, inorganic salts, and biogenic substances. Each category possesses distinctive properties, resulting in varying effects on human health and the environment. Next, we provided an overview of conventional PM measurement methods. Sampling is necessary for these methods, with the upwind–downwind technique widely adopted. Filter-based methods are accurate, but the time resolution is generally poor (except for TEOM). Additionally, the filter can be used for offline chemical analysis. We also discussed two conventional optical methods, namely the nephelometer and particle counter, and demonstrated the basics of light scattering. Furthermore, we briefly explained electrical methods and real-time chemical characterization techniques. Conventional PM measurement belongs to point measurement which can provide scarce information about the spatial distribution of FPM. In response, open-path and image-based technologies have been developed. Lidar technology, for example, is an easy-performed method to detect FPM. The light extinction coefficient can be derived from the Lidar data to evaluate the degree of pollution. A camera-based bistatic Lidar has been proposed to avoid expensive time-of-flight electronics in monostatic Lidar. Additionally, several hybrid remote sensing strategies combing Lidar with sampling gravimetric analysis have been illustrated. Image-based optical methods have also been used to detect FPM, especially fire smoke. Low-cost sensors show great promise for widespread FPM monitoring because they are light and small, and can be equipped on drones for dynamic measurement. Moreover, real-time LIBS holds great potential for in-situ chemical analysis.
By far, the mass concentration is the most concerned parameter in FPM measurement. Other factors such as size distribution, shape, and complex refractive index are less mentioned. Light-scattering-based methods have the potential to reveal more information about particles by performing multi-angle, multi-wavelength, and polarization/depolarization measurements. However, these measurement systems are much more complicated, and may not be feasible for field measurements. The image-based optical methods are promising for particle measurement since the spatial and temporal light signals (often scattering light) can be recorded simultaneously. Besides, machine learning/deep learning algorithms can be applied to decouple the relationship between light patterns and particle clouds. It is feasible to build an FPM monitoring network using low-cost, compact, mobile, and connectable sensors. Individuals equipped with portable sensors can contribute to the data collection process, and drone-based sensor systems can effectively monitor dangerous or hard-to-reached places, enhancing the overall effectiveness of the monitoring network.
Acknowledgments
Financial support from the National Key Research and Development Project of China (2017YFC0211500) and the Shanghai Sailing Program (22YF1429600) is gratefully acknowledged.
References
- Adachi K., Chung S.H., Buseck P.R., Shapes of soot aerosol particles and implications for their effects on climate, Journal of Geophysical Research, 115 (2010) D15206. DOI:10.1029/2009jd012868
- Ain N.U., Qamar S.U.R., Particulate matter-induced cardiovascular dysfunction: a mechanistic insight, Cardiovascular Toxicology, 21 (2021) 505–516. DOI:10.1007/s12012-021-09652-3
- Amina H., Ahmad M., Bhatti G.R., Zafar M., Sultana S., Butt M.A., Bahadur S., Haq I.-U., Ghufran M.A., Lubna Ahmad S., Ashfaq S., Microscopic investigation of pollen morphology of Brassicaceae from Central Punjab-Pakistan, Microscopy Research and Technique, 83 (2020) 446–454. DOI:10.1002/jemt.23432
- Amoushahi S., Bayat R., Sanaei A., Szyszkowicz M., Faridi S., Hassanvand M.S., Health and economic impacts of ambient fine particulate matter in Isfahan, Iran, Urban Climate, 41 (2022) 101048. DOI:10.1016/j.uclim.2021.101048
- Ansmann A., Tesche M., Seifert P., Groß S., Freudenthaler V., Apituley A., Wilson K.M., Serikov I., Linné H., Heinold B., Hiebsch A., Schnell F., Schmidt J., Mattis I., Wandinger U., et al., Ash and fine-mode particle mass profiles from EARLINET-AERONET observations over central Europe after the eruptions of the Eyjafjallajökull volcano in 2010, Journal of Geophysical Research, 116 (2011) D00U02. DOI:10.1029/2010jd015567
- Baars H., Ansmann A., Ohneiser K., Haarig M., Engelmann R., Althausen D., Hanssen I., Gausa M., Pietruczuk A., Szkop A., Stachlewska I.S., Wang D., Reichardt J., Skupin A., Mattis I., et al., The unprecedented 2017–2018 stratospheric smoke event: decay phase and aerosol properties observed with the EARLINET, Atmospheric Chemistry and Physics, 19 (2019) 15183–15198. DOI:10.5194/acp-19-15183-2019
- Bond T.C., Doherty S.J., Fahey D.W., Forster P.M., Berntsen T., DeAngelo B.J., Flanner M.G., Ghan S., Kärcher B., Koch D., Kinne S., Kondo Y., Quinn P.K., Sarofim M.C., Schultz M.G., et al., Bounding the role of black carbon in the climate system: A scientific assessment, Journal of Geophysical Research: Atmospheres, 118 (2013) 5380–5552. DOI:10.1002/jgrd.50171
- Brook R.D., Rajagopalan S., Pope C.A., Brook J.R., Bhatnagar A., Diez-Roux A.V., Holguin F., Hong Y., Luepker R.V., Mittleman M.A., Peters A., Siscovick D., Smith S.C., Whitsel L., Kaufman J.D., et al., Particulate matter air pollution and cardiovascular disease, Circulation, 121 (2010) 2331–2378. DOI:10.1161/CIR.0b013e3181dbece1
- Camarillo-Escobedo R., Flores J.L., Marin-Montoya P., García-Torales G., Camarillo-Escobedo J.M., Smart multi-sensor system for remote air quality monitoring using unmanned aerial vehicle and LoRaWAN, Sensors, 22 (2022) 1706. DOI:10.3390/s22051706
- Cao J.-j., Wang Q.-y., Chow J.C., Watson J.G., Tie X.-x., Shen Z.-x., Wang P., An Z.-s., Impacts of aerosol compositions on visibility impairment in Xi’an, China, Atmospheric Environment, 59 (2012) 559–566. DOI:10.1016/j.atmosenv.2012.05.036
- Carretero-Pena S., Calvo Blazquez L., Pinilla-Gil E., Estimation of PM10 levels and sources in air quality networks by digital analysis of smartphone camera images taken from samples deposited on filters, Sensors, 19 (2019) 4791. DOI:10.3390/s19214791
- Castell N., Dauge F.R., Schneider P., Vogt M., Lerner U., Fishbain B., Broday D., Bartonova A., Can commercial low-cost sensor platforms contribute to air quality monitoring and exposure estimates?, Environment International, 99 (2017) 293–302. DOI:10.1016/j.envint.2016.12.007
- Chang C.T., Chang Y.M., Lin W.Y., Wu M.C., Fugitive dust emission source profiles and assessment of selected control strategies for particulate matter at gravel processing sites in Taiwan, Journal of the Air & Waste Management Association, 60 (2010) 1262–1268. DOI:10.3155/1047-3289.60.10.1262
- Chen S., Zhang X., Lin J., Huang J., Zhao D., Yuan T., Huang K., Luo Y., Jia Z., Zang Z., Qiu Y.A., Xie L., Fugitive road dust PM2.5 emissions and their potential health impacts, Environmental Science & Technology, 53 (2019) 8455–8465. DOI:10.1021/acs.est.9b00666
- Choobari O.A., Zawar-Reza P., Sturman A., The global distribution of mineral dust and its impacts on the climate system: a review, Atmospheric Research, 138 (2014) 152–165. DOI:10.1016/j.atmosres.2013.11.007
- Cowherd C.Jr., Axetell K. Jr., Guenther C.M., Jutze G.A., Development of emission factors for fugitive dust sources, U.S. Environmental Protection Agency, NC, 1974.
- Minguillón M.C., Viana M., Querol X., Particulate Matter: Environmental Monitoring and Mitigation, Future Science Book Series, Future Science Ltd, 2013, ISBN: 9781909453135. DOI:10.4155/9781909453135
- D’Amato G., Chong-Neto H.J., Monge Ortega O.P., Vitale C., Ansotegui I., Rosario N., Haahtela T., Galan C., Pawankar R., Murrieta-Aguttes M., Cecchi L., Bergmann C., Ridolo E., Ramon G., Gonzalez Diaz S., et al., The effects of climate change on respiratory allergy and asthma induced by pollen and mold allergens, Allergy, 75 (2020) 2219–2228. DOI:10.1111/all.14476
- de Weger L.A., Molster F., de Raat K., den Haan J., Romein J., van Leeuwen W., de Groot H., Mostert M., Hiemstra P.S., A new portable sampler to monitor pollen at street level in the environment of patients, Science of The Total Environment, 741 (2020) 140404. DOI:10.1016/j.scitotenv.2020.140404
- Du K., Rood M.J., Welton E.J., Varma R.M., Hashmonay R.A., Kim B.J., Kemme M.R., Optical remote sensing to quantify fugitive particulate mass emissions from stationary short-term and mobile continuous sources: part i. method and examples, Environmental Science & Technology, 45 (2011) 658–665. DOI:10.1021/es101904q
- Du K., Shi P., Rood M.J., Wang K., Wang Y., Varma R.M., Digital Optical Method to quantify the visual opacity of fugitive plumes, Atmospheric Environment, 77 (2013) 983–989. DOI:10.1016/j.atmosenv.2013.06.017
- Ebert M., Weinbruch S., Rausch A., Gorzawski G., Helas G., Hoffmann P., Wex H., Complex refractive index of aerosols during LACE 98#x2010; as derived from the analysis of individual particles, Journal of Geophysical Research: Atmospheres, 107 (2002) 8121. DOI:10.1029/2000JD000195
- Esmen N.A., Corn M., Residence time of particles in urban air, Atmospheric Environment (1967), 5 (1971) 571–578. DOI:10.1016/0004-6981(71)90113-2
- Etyemezian V., Ahonen S., Nikolic D., Gillies J., Kuhns H., Gillette D., Veranth J., Deposition and removal of fugitive dust in the arid southwestern United States: measurements and model results, Journal of the Air & Waste Management Association, 54 (2004) 1099–1111. DOI:10.1080/10473289.2004.10470977
- Etyemezian V., Nikolich G., Ahonen S., Pitchford M., Sweeney M., Purcell R., Gillies J., Kuhns H., The portable in situ wind erosion laboratory (PI-SWERL): a new method to measure PM10 windblown dust properties and potential for emissions, Atmospheric Environment, 41 (2007) 3789–3796. DOI:10.1016/j.atmosenv.2007.01.018
- February F.J., Piazzola J., Altieri K.E., Van Eijk A.M.J., Contribution of sea spray to aerosol size distributions measured in a South African coastal zone, Atmospheric Research, 262 (2021) 105790. DOI:10.1016/j.atmosres.2021.105790
- Feigin V.L., Roth G.A., Naghavi M., Parmar P., Krishnamurthi R., Chugh S., Mensah G.A., Norrving B., Shiue I., Ng M., Estep K., Cercy K., Murray C.J.L., Forouzanfar M.H., Global burden of stroke and risk factors in 188 countries, during 1990–2013: a systematic analysis for the Global Burden of Disease Study 2013, The Lancet Neurology, 15 (2016) 913–924. DOI:10.1016/s1474-4422(16)30073-4
- Fitz D., Pankratz D., Pederson S., Bristow J., A semi-portable enclosure to measure emission rates from small fugitive sources: leaf blower dust example, Aerosol and Air Quality Research, 21 (2021) 200566. DOI:10.4209/aaqr.200566
- Froyd K.D., Murphy D.M., Brock C.A., Campuzano-Jost P., Dibb J.E., Jimenez J.L., Kupc A., Middlebrook A.M., Schill G.P., Thornhill K.L., Williamson C.J., Wilson J.C., Ziemba L.D., A new method to quantify mineral dust and other aerosol species from aircraft platforms using single-particle mass spectrometry, Atmospheric Measurement Techniques, 12 (2019) 6209–6239. DOI:10.5194/amt-12-6209-2019
- Gao S., Wang Y., Shan M., Teng Y., Hong N., Sun Y., Mao J., Ma Z., Xiao J., Azzi M., Chen L., Zhang H., Wind-tunnel and modelled PM10 emissions and dust concentrations from agriculture soils in Tianjin, northern China, Aeolian Research, 42 (2020) 100562. DOI:10.1016/j.aeolia.2019.100562
- Gao Y., Lai S., Lee S.C., Yau P.S., Huang Y., Cheng Y., Wang T., Xu Z., Yuan C., Zhang Y., Optical properties of size-resolved particles at a Hong Kong urban site during winter, Atmospheric Research, 155 (2015) 1–12. DOI:10.1016/j.atmosres.2014.10.020
- Gelencsér A., Kováts N., Turóczi B., Rostási Á, Hoffer A., Imre K., Nyirő-Kósa I., Csákberényi-Malasics D., Tóth Á, Czitrovszky A., Nagy A., Nagy S., Ács A., Kovács A., Ferincz Á, et al., The red mud accident in Ajka (Hungary): characterization and potential health effects of fugitive dust, Environmental Science & Technology, 45 (2011) 1608–1615. DOI:10.1021/es104005r
- Girón D., Delgado T., Ruiz J., Cabalín L.M., Laserna J.J., In-situ monitoring and characterization of airborne solid particles in the hostile environment of a steel industry using stand-off LIBS, Measurement, 115 (2018) 1–10. DOI:10.1016/j.measurement.2017.09.046
- Gladding T.L., Rolph C.A., Gwyther C.L., Kinnersley R., Walsh K., Tyrrel S., Concentration and composition of bioaerosol emissions from intensive farms: pig and poultry livestock, Journal of Environmental Management, 272 (2020) 111052. DOI:10.1016/j.jenvman.2020.111052
- Grover B.D., Measurement of total PM2.5 mass (nonvolatile plus semivolatile) with the Filter Dynamic Measurement System tapered element oscillating microbalance monitor, Journal of Geophysical Research, 110 (2005) D07S03. DOI:10.1029/2004jd004995
- Guo L., Cui Y., He Q., Gao W., Pei K., Zhu L., Li H., Wang X., Contributions of aerosol chemical composition and sources to light extinction during haze and non-haze days in Taiyuan, China, Atmospheric Pollution Research, 12 (2021) 101140. DOI:10.1016/j.apr.2021.101140
- Hassan H., Kumar P., Kakosimos K.E., The impact of local fugitive particulate matter and emission inventories on air quality and health in dry and arid areas, Science of The Total Environment, 824 (2022) 153799. DOI:10.1016/j.scitotenv.2022.153799
- Hassan H., Saraga D., Kumar P., Kakosimos K.E., Vehicle-induced fugitive particulate matter emissions in a city of arid desert climate, Atmospheric Environment, 229 (2020) 117450. DOI:10.1016/j.atmosenv.2020.117450
- Hassan H.A., Kumar P., Kakosimos K.E., Flux estimation of fugitive particulate matter emissions from loose Calcisols at construction sites, Atmospheric Environment, 141 (2016) 96–105. DOI:10.1016/j.atmosenv.2016.06.054
- Hergert W., Wriedt T., The Mie Theory: Basics and Applications, Springer, 2012, ISBN: 978-3-642-43614-7. DOI:10.1007/978-3-642-28738-1
- Hobbs P.V., Sinha P., Yokelson R.J., Christian T.J., Blake D.R., Gao S., Kirchstetter T.W., Novakov T., Pilewskie P., Evolution of gases and particles from a savanna fire in South Africa, Journal of Geophysical Research: Atmospheres, 108 (2003) 8485. DOI:10.1029/2002JD002352
- Holmén B., Miller D., Hiscox A., Yang W., Wang J., Sammis T., Bottoms R., Near-source particulate emissions and plume dynamics from agricultural field operations, Journal of Atmospheric Chemistry, 59 (2007) 117–134. DOI:10.1007/s10874-007-9086-6
- Hoy R.F., Chambers D.C., Silica-related diseases in the modern world, Allergy, 75 (2020) 2805–2817. DOI:10.1111/all.14202
- Hu J., Wang H., Zhang J., Zhang M., Zhang H., Wang S., Chai F., PM2.5 pollution in Xingtai, China: chemical characteristics, source apportionment, and emission control measures, Atmosphere, 10 (2019) 121. DOI:10.3390/atmos10030121
- Jakovčević T., Stipaničev D., Krstinić D., Visual spatial-context based wildfire smoke sensor, Machine Vision and Applications, 24 (2013) 707–719. DOI:10.1007/s00138-012-0481-x
- Jeong J.I., Jo D.S., Park R.J., Lee H.-M., Curci G., Kim S.-W., Parametric analysis for global single scattering albedo calculations, Atmospheric Environment, 234 (2020) 117616. DOI:10.1016/j.atmosenv.2020.117616
- Kabir A.S., Sharma N.C., Barnes J.E., Butt J., Bridgewater M., Using a bistatic camera lidar to profile aerosols influenced by a local source of pollution, SPIE, 10636 (2018) 126–132. DOI:10.1117/12.2303544
- Kalashnikova O.V., Sokolik I.N., Modeling the radiative properties of nonspherical soil-derived mineral aerosols, Journal of Quantitative Spectroscopy and Radiative Transfer, 87 (2004) 137–166. DOI:10.1016/j.jqsrt.2003.12.026
- Kandler K., Benker N., Bundke U., Cuevas E., Ebert M., Knippertz P., Rodríguez S., Schütz L., Weinbruch S., Chemical composition and complex refractive index of Saharan Mineral Dust at Izaña, Tenerife (Spain) derived by electron microscopy, Atmospheric Environment, 41 (2007) 8058–8074. DOI:10.1016/j.atmosenv.2007.06.047
- Kaźmierczak B., Badura M., Batog P., Drzeniecka-Osiadacz A., Modzel P., Kutyłowska M., Piekarska K., Jadwiszczak P., Optical particulate matter sensors in PM2.5 measurements in atmospheric air, E3S Web of Conferences, 44 (2018) 00006. DOI:10.1051/e3sconf/20184400006
- Kelesidis G.A., Pratsinis S.E., Soot light absorption and refractive index during agglomeration and surface growth, Proceedings of the Combustion Institute, 37 (2019) 1177–1184. DOI:10.1016/j.proci.2018.08.025
- Kim M.K., Jang Y., Heo J., Park D., A UAV-based air quality evaluation method for determining fugitive emissions from a quarry during the railroad life cycle, Sensors, 21 (2021) 3206. DOI:10.3390/s21093206
- Kuhns H., Gillies J., Etyemezian V., Nikolich G., King J., Zhu D., Uppapalli S., Engelbrecht J., Kohl S., Effect of soil type and momentum on unpaved road particulate matter emissions from wheeled and tracked vehicles, Aerosol Science and Technology, 44 (2010) 187–196. DOI:10.1080/02786820903516844
- Kuula J., Kuuluvainen H., Rönkkö T., Niemi J.V., Saukko E., Portin H., Aurela M., Saarikoski S., Rostedt A., Hillamo R., Timonen H., Applicability of optical and diffusion charging-based particulate matter sensors to urban air quality measurements, Aerosol and Air Quality Research, 19 (2019) 1024–1039. DOI:10.4209/aaqr.2018.04.0143
- Lavrov A., Utkin A.B., Vilar R., Fernandes A., Application of lidar in ultraviolet, visible and infrared ranges for early forest fire detection, Applied Physics B: Lasers and Optics, 76 (2003) 87–95. DOI:10.1007/s00340-002-1053-y
- Le T.-C., Tsai C.-J., Inertial impaction technique for the classification of particulate matters and nanoparticles: a review, KONA Powder and Particle Journal, 38 (2021) 42–63. DOI:10.14356/kona.2021004
- Lei Y., Shen Z., Tang Z., Zhang Q., Sun J., Ma Y., Wu X., Qin Y., Xu H., Zhang R., Aerosols chemical composition, light extinction, and source apportionment near a desert margin city, Yulin, China, PeerJ, 8 (2020) e8447. DOI:10.7717/peerj.8447
- Liu H.-Y., Schneider P., Haugen R., Vogt M., Performance assessment of a low-cost PM2.5 sensor for a near four-month period in Oslo, Norway, Atmosphere, 10 (2019) 41. DOI:10.3390/atmos10020041
- Liu Y., Shao L., Wang W., Chen J., Zhang H., Yang Y., Hu B., Study on fugitive dust control technologies of agricultural harvesting machinery, Agriculture, 12 (2022) 1038. DOI:10.3390/agriculture12071038
- Madokoro H., Kiguchi O., Nagayoshi T., Chiba T., Inoue M., Chiyonobu S., Nix S., Woo H., Sato K., Development of drone-mounted multiple sensing system with advanced mobility for in situ atmospheric measurement: a case study focusing on PM2.5 local distribution, Sensors, 21 (2021) 4881. DOI:10.3390/s21144881
- Manojkumar N., Srimuruganandam B., Size-segregated particulate matter characteristics in indoor and outdoor environments of urban traffic and residential sites, Urban Climate, 44 (2022) 101232. DOI:10.1016/j.uclim.2022.101232
- Marina-Montes C., Motto-Ros V., Pérez-Arribas L.V., Anzano J., Millán-Martínez M., Cáceres J.O., Aerosol analysis by micro laser-induced breakdown spectroscopy: a new protocol for particulate matter characterization in filters, Analytica Chimica Acta, 1181 (2021) 338947. DOI:10.1016/j.aca.2021.338947
- Martinelli N., Olivieri O., Girelli D., Air particulate matter and cardiovascular disease: a narrative review, European Journal of Internal Medicine, 24 (2013) 295–302. DOI:10.1016/j.ejim.2013.04.001
- Mueller S.F., Mallard J.W., Mao Q., Shaw S.L., Fugitive particulate emission factors for dry fly ash disposal, Journal of the Air & Waste Management Association, 63 (2013) 806818. DOI:10.1080/10962247.2013.795201
- Mutlu A., Air quality impact of particulate matter (PM10) releases from an industrial source, Environmental Monitoring and Assessment, 192 (2020) 547. DOI:10.1007/s10661-020-08508-7
- Noh H.-j., Lee S.-k., Yu J.-h., Identifying effective fugitive dust control measures for construction projects in Korea, Sustainability, 10 (2018) 1206. DOI:10.3390/su10041206
- Nousiainen T., Optical modeling of mineral dust particles: a review, Journal of Quantitative Spectroscopy and Radiative Transfer, 110 (2009) 1261–1279. DOI:10.1016/j.jqsrt.2009.03.002
- Nugraha M.G., Saptoadi H., Hidayat M., Andersson B., Andersson R., Particulate matter reduction in residual biomass combustion, Energies, 14 (2021) 3341. DOI:10.3390/en14113341
- Omidvarborna H., Baawain M., Al-Mamun A., Al-Muhtaseb A.H., Dispersion and deposition estimation of fugitive iron particles from an iron industry on nearby communities via AERMOD, Environmental Monitoring and Assessment, 190 (2018) 655. DOI:10.1007/s10661-018-7009-4
- Ordou N., Agranovski I.E., Contribution of fine particles to air emission at different phases of biomass burning, Atmosphere, 10 (2019) 278. DOI:10.3390/atmos10050278
- Pal S.R., Hlaing D., Carswell A.I., Roy G., Bastille C., Scanning LIDAR application for pollutant sources in an industrial complex, SPIE, 3504 (1998) 76–86. DOI:10.1117/12.319574
- Pervez S., Bano S., Watson J.G., Chow J.C., Matawle J.L., Shrivastava A., Tiwari S., Pervez Y.F., Source profiles for PM10-2.5 resuspended dust and vehicle exhaust emissions in central India, Aerosol and Air Quality Research, 18 (2018) 1660–1672. DOI:10.4209/aaqr.2017.08.0259
- Philip S., Martin R.V., Snider G., Weagle C.L., van Donkelaar A., Brauer M., Henze D.K., Klimont Z., Venkataraman C., Guttikunda S.K., Zhang Q., Anthropogenic fugitive, combustion and industrial dust is a significant, underrepresented fine particulate matter source in global atmospheric models, Environmental Research Letters, 12 (2017) 044018. DOI:10.1088/1748-9326/aa65a4
- Prata A.J., Satellite detection of hazardous volcanic clouds and the risk to global air traffic, Natural Hazards, 51 (2008) 303–324. DOI:10.1007/s11069-008-9273-z
- Qu Y., Ji H., Oudray F., Yan Y., Liu Y., Online composition detection and cluster analysis of Tibetan incense, Optik, 241 (2021) 166999. DOI:10.1016/j.ijleo.2021.166999
- Raja S., Chandrasekaran S.R., Lin L., Xia X., Hopke P.K., Valsaraj K.T., Analysis of beta attenuation monitor filter rolls for particulate matter speciation, Aerosol and Air Quality Research, 17 (2017) 14–23. DOI:10.4209/aaqr.2016.03.0122
- Roney J.A., White B.R., Estimating fugitive dust emission rates using an environmental boundary layer wind tunnel, Atmospheric Environment, 40 (2006) 7668–7685. DOI:10.1016/j.atmosenv.2006.08.015
- Sanderson P., Delgado-Saborit J.M., Harrison R.M., A review of chemical and physical characterisation of atmospheric metallic nanoparticles, Atmospheric Environment, 94 (2014) 353–365. DOI:10.1016/j.atmosenv.2014.05.023
- Sasaki K., Inoue M., Shimura T., Iguchi M., In Situ, rotor-based drone measurement of wind vector and aerosol concentration in volcanic areas, Atmosphere, 12 (2021) 376. DOI:10.3390/atmos12030376
- Sedlacek Iii A.J., Buseck P.R., Adachi K., Onasch T.B., Springston S.R., Kleinman L., Formation and evolution of tar balls from northwestern US wildfires, Atmospheric Chemistry and Physics, 18 (2018) 11289–11301. DOI:10.5194/acp-18-11289-2018
- Sidra S., Ali Z., Sultan S., Ahmed S., Colbeck I., Nasir Z.A., Assessment of airborne microflora in the indoor micro-environments of residential houses of Lahore, Pakistan, Aerosol and Air Quality Research, 15 (2015) 2385–2396. DOI:10.4209/aaqr.2014.12.0338
- Su C.P., Peng X., Huang X.F., Zeng L.W., Cao L.M., Tang M.X., Chen Y., Zhu B., Wang Y., He L.Y., Development and application of a mass closure PM2.5 composition online monitoring system, Atmospheric Measurement Techniques, 13 (2020) 5407–5422. DOI:10.5194/amt-13-5407-2020
- Sullivan B., Allawatt G., Emery A., Means P., Kramlich J., Posner J., Time-resolved particulate emissions monitoring of cookstove biomass combustion using a tapered element oscillating microbalance, Combustion Science and Technology, 189 (2017) 923–936. DOI:10.1080/00102202.2016.1253564
- Sweeney M.R., Forman S.L., McDonald E.V., Contemporary and future dust sources and emission fluxes from gypsum- and quartz-dominated eolian systems, New Mexico and Texas, USA, Geology, 50 (2021) 356–360. DOI:10.1130/g49488.1
- Tao Z., Wang Z., Yang S., Shan H., Ma X., Zhang H., Zhao S., Liu D., Xie C., Wang Y., Profiling the PM2.5 mass concentration vertical distribution in the boundary layer, Atmospheric Measurement Techniques, 9 (2016) 1369–1376. DOI:10.5194/amt-9-1369-2016
- Taubman B.F., Smoke over haze: aircraft observations of chemical and optical properties and the effects on heating rates and stability, Journal of Geophysical Research, 109 (2004) D02206. DOI:10.1029/2003jd003898
- ten Brink H., Henzing B., Otjes R., Weijers E., Visibility in the Netherlands during New Year’s fireworks: the role of soot and salty aerosol products, Atmospheric Environment, 173 (2018) 289–294. DOI:10.1016/j.atmosenv.2017.11.020
- Theilade I., Mærsk-Møller M.L., Theilade J., Larsen K., Pollen morphology and structure of Zingiber (Zingiberaceae), Grana, 32 (1993) 338–342. DOI:10.1080/00173139309428961
- Tian J., Wang Q., Han Y., Ye J., Wang P., Pongpiachan S., Ni H., Zhou Y., Wang M., Zhao Y., Cao J., Contributions of aerosol composition and sources to particulate optical properties in a southern coastal city of China, Atmospheric Research, 235 (2020) 104744. DOI:10.1016/j.atmosres.2019.104744
- Ueda S., Morphological change of solid ammonium sulfate particles below the deliquescence relative humidity: experimental reproduction of atmospheric sulfate particle shapes, Aerosol Science and Technology, 55 (2021) 423–437. DOI:10.1080/02786826.2020.1864277
- Varma R.M., Hashmonay R.A., Du K., Rood M.J., Kim B.J., Kemme M.R., A novel method to quantify fugitive dust emissions using optical remote sensing, in: Kim Y.J., Platt U. (Eds.), Advanced Environmental Monitoring, Springer Netherlands, Dordrecht, 2008, pp.143–154, ISBN: 978-1-4020-6364-0. DOI:10.1007/978-1-4020-6364-0_11
- Vos H.C., Fister W., von Holdt J.R., Eckardt F.D., Palmer A.R., Kuhn N.J., Assessing the PM10 emission potential of sandy, dryland soils in South Africa using the PI-SWERL, Aeolian Research, 53 (2021) 100747. DOI:10.1016/j.aeolia.2021.100747
- Wang F., Yu H., Wang Z., Liang W., Shi G., Gao J., Li M., Feng Y., Review of online source apportionment research based on observation for ambient particulate matter, Science of The Total Environment, 762 (2021) 144095. DOI:10.1016/j.scitotenv.2020.144095
- Wang F., Zhang Q., Xu X., Zhao W., Zhang Y., Zhang W., Thermo-optical and particle number size distribution characteristics of smoldering smoke from biomass burning, Applied Sciences, 9 (2019) 5259. DOI:10.3390/app9235259
- Wang H., Han L., Li T., Qu S., Zhao Y., Fan S., Chen T., Cui H., Liu J., Temporal-spatial distributions of road silt loadings and fugitive road dust emissions in Beijing from 2019 to 2020, Journal of Environmental Sciences, 132 (2023) 56–70. DOI:10.1016/j.jes.2022.07.007
- Wang W., Zhou W., Cai X., Qin J., Huang Y.A.S., Remote measurement method for mass concentration of fugitive-dust-emission particulate based on backward light scattering (in Chinese), Acta Optica Sinica, 39 (2019) 1201001. DOI:10.3788/aos201939.1201001
- Wang Y., Li X., Shi Z., Huang L., Li J., Zhang H., Ying Q., Wang M., Ding D., Zhang X., Hu J., Premature mortality associated with exposure to outdoor black carbon and its source contributions in China, Resources, Conservation and Recycling, 170 (2021) 105620. DOI:10.1016/j.resconrec.2021.105620
- Williamson C.J., Kupc A., Axisa D., Bilsback K.R., Bui T., Campuzano-Jost P., Dollner M., Froyd K.D., Hodshire A.L., Jimenez J.L., Kodros J.K., Luo G., Murphy D.M., Nault B.A., Ray E.A., et al., A large source of cloud condensation nuclei from new particle formation in the tropics, Nature, 574 (2019) 399–403. DOI:10.1038/s41586-019-1638-9
- Xiao S., Wang Q.Y., Cao J.J., Huang R.J., Chen W.D., Han Y.M., Xu H.M., Liu S.X., Zhou Y.Q., Wang P., Zhang J.Q., Zhan C.L., Long-term trends in visibility and impacts of aerosol composition on visibility impairment in Baoji, China, Atmospheric Research, 149 (2014) 88–95. DOI:10.1016/j.atmosres.2014.06.006
- Yang D., Zhang H., Wang Z., Zhao S., Li J., Changes in anthropogenic particulate matters and resulting global climate effects since the Industrial Revolution, International Journal of Climatology, 42 (2021) 315–330. DOI:10.1002/joc.7245
- Yi E.E.P.N., Nway N.C., Aung W.Y., Thant Z., Wai T.H., Hlaing K.K., Maung C., Yagishita M., Ishigaki Y., Win-Shwe T.-T., Nakajima D., Mar O.,Preliminary monitoring of concentration of particulate matter (PM2.5) in seven townships of Yangon City, Myanmar, Environmental Health and Preventive Medicine, 23 (2018) 53. DOI:10.1186/s12199-018-0741-0
- Yu X., Ma J., An J., Yuan L., Zhu B., Liu D., Wang J., Yang Y., Cui H., Impacts of meteorological condition and aerosol chemical compositions on visibility impairment in Nanjing, China, Journal of Cleaner Production, 131 (2016) 112–120. DOI:10.1016/j.jclepro.2016.05.067
- Yuen W., Du K., Koloutsou-Vakakis S., Rood M.J., Kim B.J., Kemme M.R., Hashmonay R.A., Meister C., Fugitive particulate matter emissions to the atmosphere from tracked and wheeled vehicles in a desert region by hybrid-optical remote sensing, Aerosol and Air Quality Research, 15 (2015) 1613–1626. DOI:10.4209/aaqr.2014.12.0310
- Yuen W., Johnsen D.L., Koloutsou-Vakakis S., Rood M.J., Kim B.J., Kemme M.R., Open burning and open detonation PM10 mass emission factor measurements with optical remote sensing, Journal of the Air & Waste Management Association, 64 (2013) 227–234. DOI:10.1080/10962247.2013.851045
- Yuen W., Ma Q., Koloutsou-Vakakis S., Du K., Rood M.J., Lidar equation inversion methods and uncertainties in measuring fugitive particulate matter emission factors, Applied Optics, 56 (2017) 7691–7701. DOI:10.1364/AO.56.007691
- Zavyalov V.V., Marchant C., Bingham G.E., Wilkerson T.D., Swasey J., Rogers C., Ahlstrom D., Timothy P., Retrieval of physical properties of particulate emission from animal feeding operations using three-wavelength elastic lidar measurements, SPIE, 2006. DOI:10.1117/12.680967
- Zhang H., Sun W., Li W., Wang Y., Physical and chemical characterization of fugitive particulate matter emissions of the iron and steel industry, Atmospheric Pollution Research, 13 (2022) 101272. DOI:10.1016/j.apr.2021.101272
- Zhang Q., Liu Y., Yin W., Yan Y., Li L., Xing G., The in situ detection of smoking in public area by laser-induced breakdown spectroscopy, Chemosphere, 242 (2020) 125184. DOI:10.1016/j.chemosphere.2019.125184
- Zhang Y., Forrister H., Liu J., Dibb J., Anderson B., Schwarz J.P., Perring A.E., Jimenez J.L., Campuzano-Jost P., Wang Y., Nenes A., Weber R.J., Top-of-atmosphere radiative forcing affected by brown carbon in the upper troposphere, Nature Geoscience, 10 (2017) 486–489. DOI:10.1038/ngeo2960
- Zhou W., Mei C., Qin J., Cai X., Wang T., He W., Shi A., A side-scattering imaging method for the in-line monitoring of particulate matter emissions from cooking fumes, Measurement Science and Technology, 32 (2020) 034006. DOI:10.1088/1361-6501/abbd58
- Zou J., Liu Z., Hu B., Huang X., Wen T., Ji D., Liu J., Yang Y., Yao Q., Wang Y., Aerosol chemical compositions in the North China Plain and the impact on the visibility in Beijing and Tianjin, Atmospheric Research, 201 (2018) 235–246. DOI:10.1016/j.atmosres.2017.09.014
Nomenclature
AMS
Aerosol mass spectrometer
BAM
Beta attenuation monitoring
BC
Black carbon
BrC
Brown carbon
CPC
Condensed particle counter
DMA
Differential mobility analyzer
EARLINET
European Aerosol Research Lidar Network
EC
Element carbon
ELPI
Electrical low-pressure impactor
EM
Electron microscopy
EPA
U.S. Environmental Protection Agency
FDMS
Filter dynamic measurement system
FMPS
Fast mobility particle sizer
FP
Fine particulate
FPM
Fugitive particulate matter
h-ORS
Hybrid optical remote sensing
IC
Ion chromatography
ICP-MS
Inductively coupled plasma-mass spectrometry
IP
Inhalable particulate
ISO
International Organization for Standardization
LIBS
Laser-induced breakdown spectroscopy
Lidar
Light detection and ranging
LPM
Liter per minute
MPL
Micro pulse Lidar
NAAQS
National Ambient Air Quality Standards of the U.S.
OC
Organic carbon
OPC
Optical particle counter
OP-FTIR
Open-path Fourier transform infrared spectroscopy
OP-LT
Open-path laser transmissometer
PI-SWERL
Portable in-situ wind erosion laboratory
PM
Particulate matter
PM2.5
Particulate matter with a diameter of 2.5 μm or less in size
PM10–2.5
PM with diameters generally larger than 2.5 μm and smaller than or equal to 10 μm
PM10
Particulate matter with a diameter of 10 μm or less in size
SMPS
Scanning mobility particle sizer
SP
Suspended particulate
SSA
Single scatter albedo
TEOM
Tapered element oscillating microbalances
TSP
Total suspended particulate
UFP
Ultra fine particulate
WHO
World Health Organization
XRF
X-ray fluorescence a polluting activity rates
bext
extinction coefficient (Mm−1)
bsca
scattering coefficient (Mm−1)
babs
absorption coefficient (Mm−1)
D
particle diameter (μm)
Ḟ
mass emission factor
I
transmitted light intensity (J)
I0
initial light intensity (J)
k
Koschmieder constant (−)
L
path length of the light (m)
ṁ
mass emission rate (μg h−1)
m
complex refractive index (−)
n
refractive index (−)
v̇
volume flow rate of flue (m3 h−1)
γm
mass concentration (μg m−3)
Vis
visibility (km)
α
dimensionless particle size parameter (−)
λ
wavelength of extinction light (nm)
η
absorption coefficient (−)
Authors’ Short Biographies
Tianyi Cai

Tianyi Cai received his bachelor’s degree and a Ph.D.in Engineering from Southeast University in 2014 and 2020, respectively. He is now a lecturer in the School of Energy and Power Engineering at the University of Shanghai for Science and Technology. His research interests include particles and two-phase flow measurement, heterogeneous reaction flow measurement. He also researches on theoretical modeling of the heterogeneous reactions related to various carbon capture and utilization processes.
Wu Zhou

Prof. Wu Zhou received her degree from Nanjing University of Science and Technology in 2006 and a Ph.D.in Engineering from Southeast University in 2011.She is now an professor in the School of Energy and Power Engineering at the University of Shanghai for Science and Technology. Her research interests include particles and two-phase flow measurement, combustion measurement, mainly by image-based methods. She is also interested in mathematical modelling of the above processes. She is a member of Youth Council of the Chinese Society of Particuology.


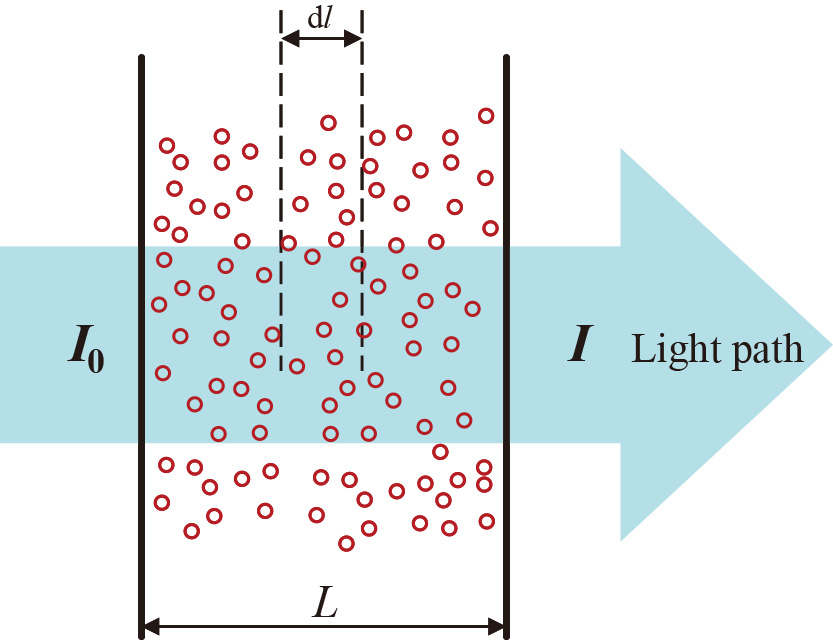
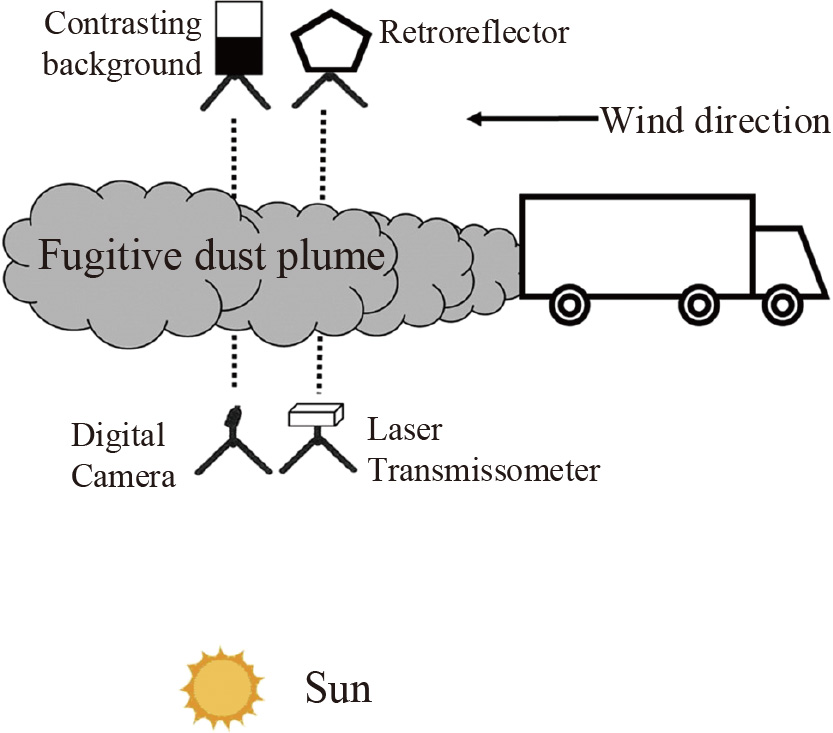

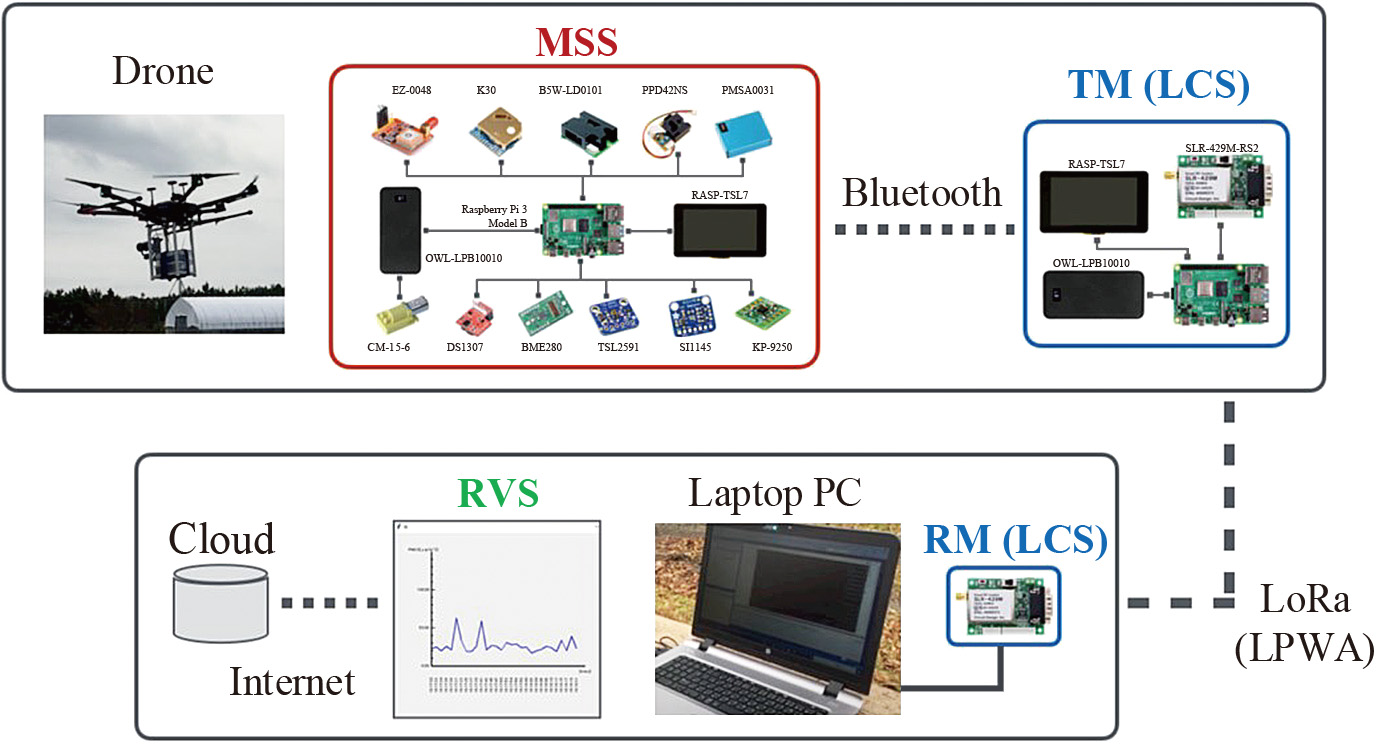
;%0A%09%09%09newWindow.document.open();%0A%09%09%09newWindow.document.write('<img src=%22./Graphics/41_2024008_08.jpg%22>');%0A%09%09%09newWindow.document.close();%0A%09%09)
;%0A%09%09%09newWindow.document.open();%0A%09%09%09newWindow.document.write('<img src=%22./Graphics/41_2024008_09.jpg%22>');%0A%09%09%09newWindow.document.close();%0A%09%09)