Abstract
The concept of a fractional base unit for the Kendrick mass defect (KMD) analysis of polymer ions is introduced for the first time. A fraction of the ethylene oxide (EO) repeat unit (namely EO/8) has been used for the KMD analysis of a poly(ethylene oxide) and found to amplify the variations of KMD between monoisotopic and 13C isotopes, producing an isotopically resolved KMD plot at full scale when the KMD plot computed with EO is fuzzy. The expansion of the KMD dimension using a fractional base unit has then been successfully used to unequivocally discriminate all the distributions from a blend of poly(ethylene oxide)s in a high resolution KMD plot calculated with EO/3 as base unit. Extending the concept of fractional base units to other repeat units, the visualization of the co-oligomers from a poly(ethylene oxide-b-propylene oxide-b-ethylene oxide) triblock copolymer has been dramatically improved using a fraction of the propylene oxide repeat unit (namely PO/3) in an oligomer and isotope resolved plot. High resolution KMD plots were eventually calculated from tandem mass spectra of poly(dimethylsiloxane) ions using a fraction of the dimethylsiloxane (DMS) unit (namely DMS/6) with clearer point alignments and a discrimination of all the product ion series, out of reach of the KMD analysis using DMS. Versatile and producing high resolution KMD plots, the introduction of fractional base units is believed to be a major step towards the implementation of the KMD analysis as a routine data mining tool for mass spectrometry in polymer chemistry.
INTRODUCTION
Mass spectrometry (MS) has become an essential analytical tool in polymer chemistry1,2) especially with high resolution mass analyzers such as time of flight with orthogonal acceleration3) or a spiral trajectory (SpiralTOF)4) and high resolution traps.5–7) In a favorable case (soluble, low molecular weight and dispersity), soft ionization techniques such as electrospray ionization (ESI) or matrix assisted laser desorption ionization (MALDI) transfer the intact polymer chains into the gas phase with no loss of the molecular information.8–13) Alternatively, harder ion sources such as laser desorption ionization (LDI), atmospheric solids analysis probe (ASAP)14,15) or pyrolysis16) produce satisfactory mass spectra retaining a part of the molecular information from high molecular weight or crosslinked polymers. Regardless of the ion source or the mass analyzer, a main issue in MS of polymers remains the data mining as the mass spectra are often complex (sample: technical blended polymers containing additives; MS step: isotope distribution, several ion adducts as well as multiply charged and fragment ion series). The analyst thus recovers thousands of points to be assigned and faces similar issues as those found in petroleomics.17)
Among several data mining tools, Kendrick mass defect (KMD) analysis18) has been one of the most widely used for the complex mass spectra of oils. A KMD analysis consists in a base transformation for the calculation of the mass-to-charge ratios (m/z). In a Kendrick base, a new base unit (typically CH2) is chosen in lieu of 12C (the base unit in the IUPAC scale at 12.0000) and its mass is set at the next integer (14.0000 instead of 14.0157 in the IUPAC scale for CH2). All the other masses are calculated accordingly and become Kendrick masses (KMs).19) The KMD defined as the difference between KM and its rounded value to the next integer (called nominal Kendrick mass, NKM) is of particular interest. Ions whose elemental composition differs by a number of base units only possess the same KMD value and line up horizontally in the associated KMD plot (NKM vs. KMD).
In an effort to facilitate the data mining of mass spectra of polymers, Sato et al. have proposed to extend the concept of KMD analysis from petroleomics to polymer chemistry by using the repeat unit of a polymer as the base unit for the calculation of the KM.20) Accordingly, oligomers belonging to the same distribution possess the same KMD value and line up horizontally—the mass spectrum of a simple homopolymer thus turning into a single line in a KMD plot calculated with its repeat unit. The KMD plot of a blend of homopolymers of the same monomer will display as many horizontal lines as distributions in the sample. On the opposite, a homopolymer distribution containing another repeat unit different from the base unit will line up in an oblique direction while the KMD plot of a copolymer calculated with one of the co-monomers will be a scatter plot.20–22) Despite its inherent qualities, the errors in the measurements of the mass-to-charges due to a poor calibration or distorted peak shapes often blur the KMD plots. Isotopes also constitute a major drawback as their KMD differs in a very limited extent and make the KMD plot fuzzy. For this last point, automatic deisotoping procedures are available but 1) require a fine tuning not suitable over the whole mass range owing to the evolution of the peak resolution and 2) could oversimplify the data by removing peaks of interest.
Since its introduction, several authors have refined the KMD analysis for polymers by varying the mass defect order23) or the base unit. In particular, the use of one of the co-monomeric units20,21) or the mass difference between two co-monomeric units22) are of interest for the KMD plots of copolymers and terpolymers, respectively. Using the neutral expelled during collision activated dissociation (CAD) as the base unit also provides useful alignments in the KMD plots from the tandem mass spectra of polymer ions.24) All these alternative base units make sense from a chemical point of view but in the course of the manipulation of KMD plots, the idea of a fractional base unit chemically senseless but mathematically acceptable has just arisen. Instead of the repeat unit of a polymer backbone, a fraction of this repeat unit (i.e., (repeat unit)/X) is proposed as the base unit and found to strikingly expand the KMD dimension, artificially amplifying the variations of KMD between peaks over the whole KMD range and in the end improving the resolution of the KMD plot. To the best of our knowledge, this article is the first report on the use of a fractional base unit for the KMD analysis of polymer ions. The concept is illustrated with the expansion of the isotope distribution in the KMD plot of a poly(ethylene oxide) (PEO) computed with EO/8 (EO: ethylene oxide). The so-introduced fractional base units are then used for the KMD analysis of mass spectra recorded from a blend of PEO chains as well as a P(EO-block-PO-block-EO) triblock copolymer (PO: propylene oxide) computed with EO/3 and PO/3, respectively. A last part extends the KMD analysis with fractional base units to the MS/MS stage with an enhanced visualization of tandem mass spectra of poly(dimethylsiloxane) ions by using DMS/6 in lieu of DMS as base unit (DMS: dimethylsiloxane).
MATERIALS AND METHODS
ChemicalsTrans-2-[3-(4-tert-butylphenyl)-2-methyl-2-propenylidene]-malononitrile (known as DCTB) and poly(ethylene oxide-block-propylene oxide-block-ethylene oxide) 1100 g mol−1 10 wt% EO (noted P(EO-b-PO-b-EO) were from Sigma-Aldrich (St. Louis, MO). Poly(ethylene oxide) monostearate (40 EO) (noted PEO monostearate) was purchased from Wako Pure Chemical Industries, Ltd. (Osaka, Japan). Chemicals were used as received without purification.
Mass SpectrometryThe polymer sample was dissolved in tetrahydrofuran (∼1 mg mL−1). 5 μL of the sample solution were pipetted and mixed with 15 μL of a solution of DCTB in tetrahydrofuran at 15 mg mL−1. Five aliquots of 1 μL of the mixed solution were then deposited on a non-hydrophobic surface (384 circles) from Hudson Surface Technology (HST Inc., Old Trappan, NJ) and let to air dry. MALDI mass spectra were recorded using a JMS-S3000 SpiralTOF mass spectrometer (JEOL, Tokyo, Japan) equipped with a Nd:YLF (Neodymium-doped yttrium lithium fluoride) laser irradiating the deposits. The so-generated ions were accelerated by a 20 kV high voltage and went through the spiralTOF analyzer along a spiral trajectory (approximate path length: 17 m) before their detection.4) The delay time was set at 300 ns to keep the peak width ΔM<0.03 Da at FWHM over the mass range of interest. Calibration was performed externally and internally using the sodium adducts of poly(methyl methacrylate) 1310 g mol−1 and 2680 g mol−1 standards. MSTornado control/analysis (JEOL) was used for data acquisition while mMass 5.5.0.0 was used for data processing and artworks.25)
Kendrick mass defect analysisData points have been peak-picked from the mass spectra using an automated procedure implemented in mMass with no deisotoping and a relative intensity threshold set at 5%. The accurate mass measurements of ions on the IUPAC scale were converted to KMs, NKMs and KMDs according to
 | (1) |
 | (2) |
 | (3) |
Contrary to the previous reports,
20–22,26) the base unit in the present article is a fraction of the repeat unit noted (repeat unit)/
X with the divisor
X being an integer ranging from 1 to 10 (10 has been arbitrarily chosen for the sake of simplicity). While the value of
X is increasing, the value of NKM is departing from the actual
m/
z value. To prevent any shift of the plots, a “corrected” NKM value was calculated according to
 | (4) |
The KMD plot displays the KMD of the detected oligomeric adducts as a function of their corrected NKM using a “bubble chart” where each disk expresses a data triplet (NKM, KMD, abundance)
20–22,26) except for the KMD plots of tandem mass spectra (scatter plot with no consideration for the peak intensity for the sake of point visualization). “Full scale” will be used throughout the text to designate a KMD plot with KMD ranging from −0.5 to 0.5, its minimum and maximum values by definition. KMD values and KMD plots calculated using a given “value” as base unit will be referred to as “value”-based KMD and “value”-based KMD plot.
RESULTS AND DISCUSSION
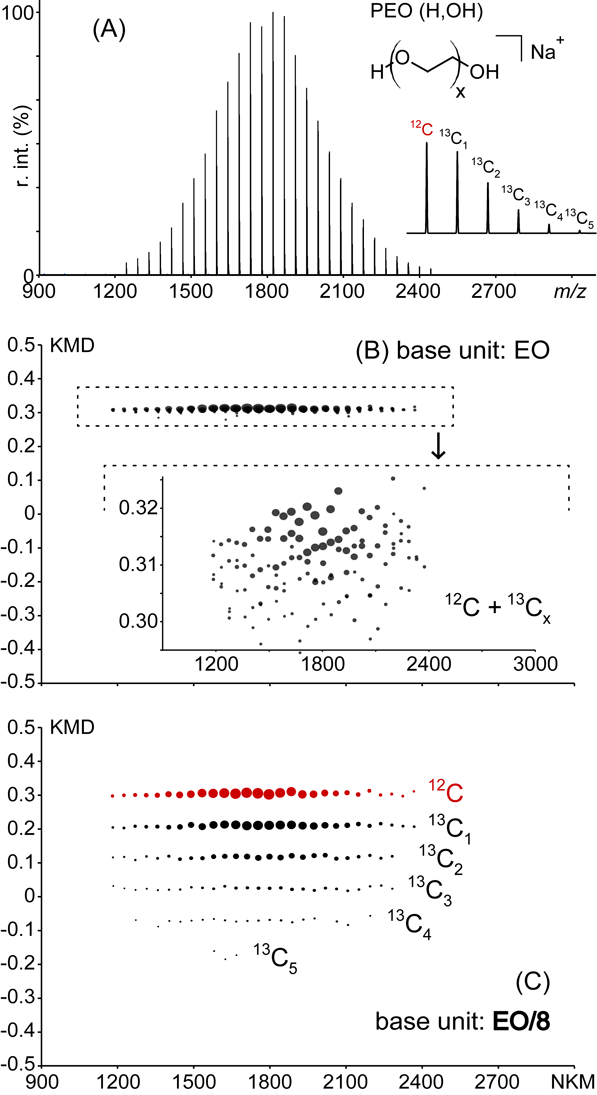
That's where it all begins: expansion of the KMD dimensionIllustrating the theory of serendipity, a fractional base unit has been used within the scope of calculating KMD for multiply charged ions without achieving the expected outcome but has offered an unexpected enhanced visualization of the KMD plot. The following first example constitutes the first accidental use of such fractional base unit chronologically speaking. The MALDI mass spectrum of a poly(ethylene oxide) (extracted from the PEO monostearate sample by water extraction) is depicted in Fig. 1A and displays a unique distribution of sodiated PEG chains (H,OH)-terminated (structure depicted in inset). A representative isotope pattern is also depicted in inset, exhibiting intense 13Cx peaks with x=1–5 in such a mass range (13C is the main isotope to be detected owing to its natural abundance and the resolving power of the mass spectrometer). The associated full scale EO-based KMD plot is depicted in Fig. 1B and displays a “single” horizontal line typical of a homopolymer and turning to become usual for the analysts used to the KMD plots of polymer ions. A magnification of the KMD plot depicted in inset of Fig. 1B (KMD ranging from +0.29 to +0.32) displays nevertheless a point cloud rather than a well-defined line. The monoisotopic peak and the 13Cx isotopes possess different KMD values (with EO as the base unit, ΔKMD(13C, 12C) is approximatively −0.0028). A perfectly calibrated spectrum with infinite resolution would lead to a magnified KMD plot displaying several horizontal lines assigned to the 12C and 13Cx isotopes of each PEO congener. In a real mass analysis, the errors in the measurements of m/z (calibration+peak shape, MS analysis step) and the inherent low value of ΔKMD(13C, 12C) with EO as the base unit (KMD analysis step) are responsible for the fuzzy plot depicted in Fig. 1B. Appropriate softwares such as msRepeatFinder (JEOL, Japan) allow the user to select some points of interest in the KMD plots to highlight their counterparts in the associated mass spectrum for an enhanced visualization of the data (so-called grouping mode). An unresolved cloud would obviously prevent the user from accurately selecting the points of interest in the KMD plots and would require a tedious preliminary deisotoping of the raw data. On the opposite and without any modification of the raw data, we accidentally obtained a strikingly higher resolution for the KMD plot using a counterintuitive EO/8 as an alternative “fractional” base unit (i.e., 5.5033→6). The full scale KMD plot calculated with EO/8 is depicted in Fig. 1C. A set of six horizontal lines is clearly seen and readily assigned to the 12C monoisotopic and 13Cx species (x=1–5) without any of the interferences found in the previous case.
The KMD plot calculated from the raw data of the mass spectrum with all the isotopes is isotopically resolved with no need for magnification—ΔKMD(13C, 12C) being approximately −0.094, i.e., 33 times larger than with EO as base unit. About the use of appropriate softwares, a user can now select the 12C peaks in the KMD plot (grouping mode) and visualize the associated peaks in the mass spectrum with an unprecedented accuracy in the point selection, offering an alternative method for deisotoping. As a prime importance feature, EO/8 as a base unit does not interfere with the horizontal alignments of congener ions and thus preserves the power of the KMD analysis. This latter point is more thoroughly studied in the Supporting Information in an attempt of rationalization as the presence of round functions in the calculation of KM, NKM and KMD renders their shape hard to predict when calculated with a fractional base unit. Briefly, it appears that the horizontal alignment of oligomers from a given distribution in the KMD plot (i.e., same KMD value regardless of the degree of polymerization) is remarkably obtained for a divisor X being a natural number (positive integer) as exemplified in Fig. S1 for the case of EO. Several decimal values for X also produce horizontal alignments, but for the sake of simplicity only positive integers will be considered in this first article.
The so-called expansion of the KMD dimension also strongly depends on the fractional base unit, i.e., the value of the divisor X. The shape-shifting of the isotope distribution of three consecutive PEO oligomers (20-, 21- and 22-mers) with the fractional base unit is evaluated in Fig. 2 (EO/X with X=1 to 10) and linked to a newly introduced coefficient of expansion ε (ratio of ΔKMD(13C, 12C) calculated with EO/X and EO as base units). A fractional EO/2 as the base unit does not modify the appearance of the full scale EO-based KMD plot with one horizontal line and a barely seen isotope distribution. On the contrary, the KMD plot calculated with EO/3 displays a remarkable expansion of the isotope distribution visible in full scale. The difference ΔKMD(13C, 12C) is ~−0.0256, i.e., approximately nine times larger than for EO or EO/2 (ε=+9). EO/4 and EO/5 lead to the KMD plots obtained for EO and EO/3, respectively. Using EO/6 or EO/7 as the base unit expands the isotope distribution to a greater extent and in a reverse order: ΔKMD(13C)/KMD(12C) is ~+0.0427, i.e., ε=+15. The expansion is at its maximum with EO/8 (ε=+33, see Fig. 1) and EO/10 (ε=−31) while EO/9 leads to the KMD plot found for EO/3 and EO/5. All in all, the fractional base unit EO/X with the divisor X a positive integer amplifies the variations of KMD and advantageously preserves the alignments expected for a KMD analysis. The newly proposed EO/X-based KMD plot thus offers the same features as the EO-based KMD plot with a gain of “resolution” using the same raw data.
Beyond the isotope resolution: resolving the KMD plots of mixtures and copolymersA fractional base unit makes the difference of KMD values between 12C and 13Cx isotopes greater than with the repeat unit itself, and so will be the KMD differences between oligomers of different distributions. Fractional base units are thus of interest in the case of polymer blends for which a regular KMD analysis fails at separating the components. The MALDI mass spectrum of a PEO monostearate sample is depicted in Fig. 3A. Those samples are widely used as non-ionic surfactants and typically synthesized by the capping of a PEO (H, OH)-ended chain with fatty acids such as stearic acid (saturated C18 chain) or palmitic acid (saturated C16 chain). As a chemical of industrial grade, the final product is a mixture composed of the unreacted PEO (H, OH)-terminated (noted (1), inset in Fig. 3A), the PEO (H, palmitate) (2a) and PEO (H, stearate) (2b) mono-capped chains and the PEO (palmitate, palmitate) (3a), PEO (stearate, palmitate) (3b) and PEO (stearate, stearate) (3c) di-capped chains based on the accurate mass measurements. The full scale EO-based KMD plot is depicted in Fig. 3B and displays three main domains formed of horizontally aligned points. Its magnification (KMD: −0.2–0.1) is depicted in Fig. 3C where three lines are readily assigned to the unreacted PEO (1) and the two mono-capped chains (2a) and (2b). The plot nevertheless fails at discriminating the three di-capped structures composing the cloud noted (3) while the isotope distributions also broaden the lines for (1) and (2). Based on the results presented in Figs. 1 and 2, EO/8 has been first chosen in an attempt to improve the resolution of the KMD plot (Fig. 3D). The isotope resolution is reached (12C and 13C1 are noted in inset) but the expansion of the KMD dimension is ironically far too important, inducing a strong aliasing eventually overlapping the horizontal lines in a fuzzy plot. Taking advantage of the influence of the divisor X on the coefficient of expansion (Fig. 2), other fractional units are readily tested within a minute until the best resolution is achieved. A fractional EO/3 expands the KMD dimension to a more reasonable extent (coefficient of expansion ε=9) and the associated KMD plot is depicted in Fig. 3E. An aliasing is still observed but it does not prevent from a clear distinction of all the series constituting the sample with the additional isotope resolution. In particular, the unresolved cloud noted (3) in Fig. 3C is now split in three distinct groups of horizontal lines and the three di-capped structures (stearate, stearate) 3c, (stearate, palmitate) 3b and (palmitate, palmitate) 3a are assigned without a doubt. It is worth mentioning that using a fractional base unit renders the point alignments cleaner—lines in Fig. 3E appear straighter than in Fig. 3C thanks to the absence of zooming of the KMD plot (full scale).
The two previous examples deal with EO-containing homopolymers but the concept of fractional base unit is obviously extendable to any other repeat unit. The coefficient of expansion ε is readily evaluated theoretically as a function of the divisor X and the repeat unit by simulating the composition of two oligomers and calculating the associated KMD of 12C and 13C1 species. The so-calculated coefficients for a set of representative repeat units—namely ethylene (E, 28 Da), EO (44 Da), PO (58 Da), DMS (74 Da), vinyl acetate (VA, 86 Da), vinyl pyrrolidone (VP, 111 Da) and ethylene terephtalate (ET, 192 Da) are depicted in Figs. S2 and S3 (Supporting Information) for the sake of example. The analyst can then choose the most appropriate value of X—so to say the coefficient of magnification—depending on the resolution needed (e.g., deisotoping or declustering). Illustrating the verstility of the method, a fractional PO/X is proposed as a base unit for the KMD analysis of a poly(ethylene oxide-block-propylene oxide-block-ethylene oxide) triblock copolymer. The MALDI mass spectrum of P(EO-b-PO-b-EO) 1100 g mol−1 with 10 wt% EO is depicted in Fig. 420,27) and displays numerous sodiated co-oligomers. The associated full scale PO-based KMD plot is depicted in Fig. 4B, displaying a flat shape accounted for by the low EO content. Such a plot is of interest in the framework of a comparative study with other copolymers (the shape of the plot reflecting the content in EO and PO20,21)) but is of limited impact for the sole molecular analysis of this sample. Its magnification (Fig. 4C) displays a cloud of points with low resolution—neither the congeners varying by their content in EO nor the 13Cx isotopes can be clearly discriminated.
Among all the possibilities for PO/X with X a positive integer, PO/3 offers a satisfactory coefficient of expansion (ε=−5.6, Fig. S2 in the Supporting Information). The full-scale KMD plot using PO/3 as the base unit is depicted in Fig. 4C. In spite of the obvious aliasing, several groups of horizontal lines are now clearly seen and assigned to the EOx series (each line contains x EO units and a varying number of PO units)—from EO=0 (PPO homopolymer) up to EO=12. The magnification of the KMD plot with KMD ranging from −0.30 to −0.15 shows its high resolution with a clear separation of the 12C and 13C isotopes as well as the EO=0 and EO=4 lines. Starting from the same raw data with no additional data treatment, the use of a fractional base unit dramatically enhances the information delivered by the KMD plot by discriminating at the same time the peak series based on their EO content and the 13Cx peaks from the isotope distributions, out of reach for the regular PO-based KMD plot.
Extension to the MS/MS stageBeyond the MS stage, it has been shown that the KMD analysis is successfully extendable to the case of tandem mass spectra.24) Similarly, this last part extends the concept of fractional base units to the MS/MS stage by offering a re-analysis of partially unresolved data published elsewhere.24,28) The ESI-CAD mass spectrum of a (methyl, methoxy)-ended poly(dimethylsiloxane) (PDMS) 25-mer adducted with ammonium ion is depicted in Fig. 5A (recorded with an orthogonal acceleration TOF Qstar Elite, Applied Biosystems SCIEX, Concord, ON, Canada). It displays a main product ion series covering the entire mass range (noted bn+) in addition to two minor series in the low mass range (noted Kn+ and bn+-trimethylmethoxysilane).28,29) The associated DMS-based KMD plot (Fig. 5B) fails at discriminating the three ion series (no clear point alignments) owing to a poor expansion in the KMD dimension (KMD range: −0.07–+0.03). The low intensity of the product ions in the high mass range also accounts for the high errors in the calculations of the KMD values. According to the brief analysis reported in the Supporting Information (Fig. S2 and associated comment), a divisor set at X=6 reasonably expands the isotope distribution of a PDMS with a coefficient of expansion ε at −7.7. Using DMS/6 as the base unit produces a highly resolved KMD plot (Fig. 5C) sorting the three ion series in three distinct lines with KMD values ranging from −0.4 to +0.4 conveniently displayed in a full-scale plot.
As a last example, the ESI-CAD mass spectrum of a doubly charged (trimethylsilyl, trimethylsiloxy)-PDMS 23-mer adducted with ammonium ion is depicted in Fig. 5D and displays a notoriously large number of singly and doubly charged product ion series noted bn+, Hbn+, Jn2+, bn+-TMS, bn++NH4+, Mezn and Mezn-CH4.28) The associated DMS-based KMD plot (Fig. 5E) satisfactorily separates some product ion series24) but two clouds remain unresolved (Mezn/Mezn-CH4 and Hbn+/Jn2+, in red) in spite of different end-groups and charge states owing to some errors in the measurements of m/z and a limited variation of their KMD values. On the contrary, the expansion of the KMD dimension results in a complete removal of all the interferences in the KMD plot calculated with DMS/6 as the base unit (Fig. 5F). All the product ion series now line up at distinct KMD values regardless of the errors in the m/z measurements and each group can be properly assigned (with an emphasis on the four above-mentioned series plotted in red). In the two examples, the resolution of the KMD plot has thus been increased by using a fractional base unit without any modification of the raw data: the visualization is greatly enhanced with both a better point alignment and a declustering of overlapped point.
CONCLUSION
High resolution KMD analysis has been achieved by using a fraction of a repeat unit as the base unit for the KM calculations in lieu of the repeat unit itself. This newly introduced fractional base unit amplifies the variations of the KMD values and expands the points over the whole KMD range, leading to a better separation of clusters or cleaner alignments in the associated KMD plots. Depending on the sample, fractional base units are successfully used in MS for deisotoping by discriminating the 12C and 13Cx isotopes, for declustering by separating the components of a polymeric blend or a copolymer and are also suitable for the distinction of the product ion series in MS/MS. The implementation of fractional base units is immediate with every software already performing the KMD analysis using a manual entry and greatly enhances its capabilities for complex mass spectra of polymers. As a breakthrough derived from this founding article and relying on the gain of resolution of the KMD analysis, low resolution and high resolution/high mass range mass spectral data have been turned into informative KMD plots using the fractional base units.30) It is expected that the KMD analysis will become widespread and the introduction of the fractional base units is an important step towards its use as a routine data mining technique in the field of polymer chemistry and as an effective way to present MS results to wide audiences with highly visual plots.
Supporting information
Additional supporting information is found in the online version of this article.
Abbreviations
ASAP, atmospheric solids analysis probe; CAD, collision activated dissociation; DMS, Dimethylsiloxane; E, ethylene; EO, ethylene oxide; ESI, electrospray ionization; ET, ethylene terephthalate; IUPAC, International Union of Pure and Applied Chemistry; KM, Kendrick mass; KMD, Kendrick mass defect; LDI, laser desorption ionization; MALDI, matrix assisted laser desorption ionization; MS, mass spectrometry; MS/MS, tandem mass spectrometry; m/z, mass-to-charge ratio; NKM, nominal Kendrick mass; PDMS, polydimethylsiloxane; PO, propylene oxide; VA, vinyl acetate; VP, vinyl pyrrolidone.
Acknowledgments
T. Fouquet and H. Sato gratefully acknowledge the ongoing financial support by the Japan Society for the Promotion of Science (JSPS) under the postdoctoral fellowship for overseas researchers program (FY2015) and a Grant-in-Aid “JSPS KAKENHI” (Grant number: JP 15F15344).
REFERENCES
- 1) G. Montaudo, R. P. Lattimer. Mass Spectrometry of Polymers, CRC Press, Taylor and Francis group, Oxford, 2001.
- 2) C. Wesdemiotis. Multidimensional mass spectrometry of synthetic polymers and advanced materials. Angew. Chem. Int. Ed. 56: 1452–1464, 2017.
- 3) L. Charles. Influence of internal standard charge state on the accuracy of mass measurements in orthogonal acceleration time-of-flight mass spectrometers. Rapid Commun. Mass Spectrom. 22: 151–155, 2008.
- 4) T. Satoh, H. Tsuno, M. Iwanaga, Y. Kammei. The design and characteristics features of a new time-of-flight mass spectrometer with a spiral ion trajectory. J. Am. Soc. Mass Spectrom. 16: 1969–1975, 2005.
- 5) M. C. Bridoux, X. Machuron-Mandard. Capabilities and limitations of direct analysis in real time orbitrap mass spectrometry and tandem mass spectrometry for the analysis of synthetic and natural polymers. Rapid Commun. Mass Spectrom. 27: 2057–2070, 2013.
- 6) A. J. Hoteling, P. T. Papagelis. Structural characterization of silicone polymers using compositional ultra-high performance liquid chromatography separation, electrospray ionization, and high resolution/accurate mass. Anal. Chim. Acta 808: 231–239, 2014.
- 7) F. Xian, C. L. Hendrickson, A. G. Marshall. High resolution mass spectrometry. Anal. Chem. 84: 708–719, 2012.
- 8) L. Charles. MALDI of synthetic polymers with labile end-groups. Mass Spectrom. Rev. 33: 523–543, 2014.
- 9) T. Gruendling, S. Weidner, J. Falkenhagen, C. Barner-Kowollik. Mass spectrometry in polymer chemistry: A state-of-the-art up-date. Polym. Chem. 1: 599–617, 2010.
- 10) M. Hakkarainen. Mass Spectrometry of Polymers—New Techniques. Springer-Verlag, Berlin Heidelberg New York, 2012.
- 11) S. D. Hanton. Mass spectrometry of polymers and polymer surfaces. Chem. Rev. 101: 527–570, 2001.
- 12) C. A. Jackson, W. J. Simonsick Jr. Application of mass spectrometry to the characterization of polymers. Curr. Opin. Solid State Mater. Sci. 2: 661–667, 1997.
- 13) H. Pasch, W. Schrepp. MALDI-TOF Mass Spectrometry of Synthetic Polymers, Springer-Verlag, Berlin Heidelberg New York, 2003.
- 14) C. Barrère, W. Selmi, M. Hubert-Roux, T. Coupin, B. Assumani, C. Afonso, P. Giusti. Rapid analysis of polyester and polyethylene blends by ion mobility-mass spectrometry. Polym. Chem. 5: 3576–3582, 2014.
- 15) T. Fouquet, C. Barrère-Mangote, M. Farenc, C. Afonso, P. Giusti. Atmospheric solid analysis probe mass spectrometry vs. electrospray tandem mass spectrometry of polydimethylsiloxanes in positive and negative ionization modes. Rapid Commun. Mass Spectrom. 29: 982–986, 2015.
- 16) S. Tsuge, H. Ohtani, C. Watanabe. Pyrolysis-GC/MS Data Book of Synthetic Polymers—Pyrograms, Thermograms and MS of Pyrolyzates. Elsevier, Amsterdam, 2011.
- 17) A. G. Marshall, R. P. Rodgers. Petroleomics: The next grand challenge for chemical analysis. Acc. Chem. Res. 37: 53–59, 2004.
- 18) L. Sleno. The use of mass defect in modern mass spectrometry. J. Mass Spectrom. 47: 226–236, 2012.
- 19) E. Kendrick. A mass scale based on CH2=14.0000 for high resolution mass spectrometry of organic compounds. Anal. Chem. 35: 2146–2154, 1963.
- 20) H. Sato, S. Nakamura, K. Teramoto, T. Sato. Structural characterization of polymers by MALDI spiral-TOF mass spectrometry combined with Kendrick mass defect analysis. J. Am. Soc. Mass Spectrom. 25: 1346–1355, 2014.
- 21) T. Fouquet, H. Aizawa, H. Sato. Taking MALDI SpiralTOF high-resolution mass spectrometry and mass defect analysis to the next level with ethylene vinyl acetate vinyl alcohol terpolymers. Rapid Commun. Mass Spectrom. 30: 1818–1822, 2016.
- 22) T. Fouquet, S. Nakamura, H. Sato. MALDI SpiralTOF high-resolution mass spectrometry and Kendrick mass defect analysis applied to the characterization of poly(ethylene-co-vinyl acetate) copolymers. Rapid Commun. Mass Spectrom. 30: 973–981, 2016.
- 23) I. K. Dimzon, X. Trier, T. Frömel, R. Helmus, T. P. Knepper, P. de Voogt. High resolution mass spectrometry of polyfluorinated polyether-based formulation. J. Am. Soc. Mass Spectrom. 27: 309–318, 2016.
- 24) T. Fouquet, H. Sato. Convenient visualization of high-resolution tandem mass spectra of synthetic polymer ions using Kendrick mass defect analysis—The case of polysiloxanes. Rapid Commun. Mass Spectrom. 30: 1361–1364, 2016.
- 25) M. Strohalm, D. Kavan, P. Novák, M. Volný, V. Havlícek. mMass 3: A cross-platform software environment for precise analysis of mass spectrometric data. Anal. Chem. 82: 4648–4651, 2010.
- 26) T. Fouquet, M. Torimura, H. Sato. Multi-stage mass spectrometry of poly(vinyl pyrrolidone) and its vinyl succinimide copolymer formed upon exposure to sodium hypochlorite. Mass Spectrom. (Tokyo) 5: A0050, 2016.
- 27) T. Sato, K. Teramoto, T. Satoh, Y. Ueda. Ethylene oxide–propylene oxide block copolymer analysis by MALDI Spiral-TOF/TOF. Kobunshi Ronbunshu 69: 406–415, 2012.
- 28) T. Fouquet, V. Toniazzo, D. Ruch, L. Charles. Use of doubly charged precursors to validate dissociation mechanisms of singly charged poly(dimethylsiloxane) oligomers. J. Am. Soc. Mass Spectrom. 24: 1123–1129, 2013.
- 29) C. Wesdemiotis, N. Solak, M. J. Polce, D. E. Dabney, K. Chaicharoen, B. C. Katzenmeyer. Fragmentation pathways of polymer ions. Mass Spectrom. Rev. 30: 523–559, 2011.
- 30) T. Fouquet, H. Sato. Extension of the Kendrick mass defect analysis of homopolymers to low resolution and high mass range mass spectra using fractional base units. Anal. Chem., acs.analchem.6b05136, 2017. DOI: 10.1021/acs.analchem.6b05136