Effect of Reaction Layer on Water Durability in BaO–FeO–Fe2O3–P2O5 Glasses
2018 Volume 59 Issue 3 Pages 437-442

Details
2018 Volume 59 Issue 3 Pages 437-442
FeO–Fe2O3–P2O5 and BaO–FeO–Fe2O3–P2O5 glasses were immersed in ultrapure water at 120℃ for 24–168 h. The weight loss of ternary barium iron phosphate glasses immersed for 168 h with a value of < 1.0 × 10⁻⁹ kg mm−2 (< 0.03% of initial sample weight) was ten times smaller than that of the binary iron phosphate glass. A reaction layer was formed during immersion tests on the barium iron phosphate glasses. FE-SEM observations indicated the thickness of reaction layer increased with immersion time up to a thickness of 150–230 nm. Weight loss of dissolution samples was suppressed once the reaction layer reached a thickness greater than 150 nm. TEM-EDS analysis with selected-area electron diffraction patterns revealed the reaction layer consisted of 6-line ferrihydrite and non-crystalline phase containing phosphorus with a Fe–O richer and no Ba (< 1 at%) composition, compared to the original glass composition. The dissolution and precipitation process of ionic species with a role of Ba ions for local pH modification is discussed for the formation of the reaction layer.
Binary iron phosphate (IP) glasses have been studied to immobilize nuclear wastes as a potential host1) due to good chemical durability2) and high loading capacity. Radioactive water was generated by cooling the reactor of the Fukushima Daiichi nuclear power plant on March 2011 during and after the catastrophic earthquake and ensuing tsunami. A co-precipitation method was applied at the initial step of the water treatment. This decontamination process created radioactive sludge including BaSO4 as a main component.3) In a previous study,4) iron phosphate glasses containing BaSO4 were optimized for increased water durability and stability against crystallization at high temperatures. It was found that the corrosion resistance of ternary barium iron phosphate (BaIP) glasses was superior to that of binary iron phosphate glasses.
Chemical durability of barium iron phosphate glass has been studied from the viewpoint of glass structure and chemical bonding. The phosphate-chain length of BaO–FeO–Fe2O3–P2O5 glasses was measured with chromatographic analysis and was found to decrease with increasing FeOx (x = 1–1.5) and BaO concentrations.5) The dissolution rate after immersion tests at 120℃ for 72 h demonstrated a similar decrease with FeOx and BaO addition. The results implied that the hydration resistance of Fe–O–P bonds to pyro- and ortho- phosphate led to the decrease of dissolution rate.5) Bingham et al.6) also revealed that the water durability of iron phosphate glasses was improved by addition of BaO. They also found BaO is more effective as an additive than other monovalent oxides such as Li2O, Na2O, and K2O.
The dissolution rate is related to glass structure in iron phosphate glasses, whereas the dissolution behavior is influenced by the behavior of reactions at the surface of the glass. The chemical composition of glass surface changes by immersion in water. Yano et al.7) evaluated the surface composition of Cr2O3, CoO, and Al2O3 doped iron phosphate glasses before and after immersion tests at 90℃ for 168 h using X-ray photoelectron spectroscopy. They reported the composition of glass surface varied toward Fe2O3-rich compositions after immersion tests and suggested the composition change contributed to the improvement of water durability. In our previous study,4) a reaction layer was formed on the BaIP glasses immersed in water. The reaction layer may play a role to suppress the dissolution of barium iron phosphate glasses into water with a low weight loss value of < 1.0 × 10⁻⁹ kg mm−2 (< 0.03% of initial sample weight) after immersion tests at 120℃ for 72 h. However, the effect of surface microstructure on water durability is not well understood.
In this study, the role of the reaction layer on water durability in BaO–FeO–Fe2O3–P2O5 glasses is studied. The water durability is evaluated by the weight loss in course of immersion time. The reaction layer is characterized by field emission-scanning electron microscope (FE-SEM) and transmission electron microscope (TEM) observations. The formation process of the reaction layer is discussed in terms of microstructural variation.
The nominal compositions of samples were xBaO–(100 − x)·(0.65FeOy–0.35P2O5), where x = 0, 10, 20 mol% and y = 1 ≤ y ≤ 1.5. The mole fraction of oxygen y changes due to ferrous and ferric ions.4) The samples are expressed by an abbreviated designation called IP35 or xBaIP35 glasses due to BaO concentration x.
These glasses were selected from the previous study due to the difference in the formation of the reaction layer.4) Batches for 25 g of glass were mixed and melted in Pt crucibles between 1150℃ and 1200℃ for 1 h. The melts were poured into preheated graphite mold, annealed at the glass transition temperatures, and then cooled to room temperature at 1℃/min. The prepared glass compositions have been analyzed previously.5) These results are shown in Table 1. The compositions were determined by inductively-coupled plasma optical emission spectroscopy (ICP-OES, PerkinElmer Optima 2000 DV, Norwalk, USA), and the fraction of Fe2+ iron was determined by a titration method using KMnO4 (0.002 mol/L).5) Non-crystalline state of prepared glasses was confirmed by powder X-ray diffraction analysis (XRD, X'pert powder diffractometer, PANalytical, Netherlands).
| Abbreviation | Nominal composition (mol%) |
Analyzed composition (mol%) |
|||||
|---|---|---|---|---|---|---|---|
| BaO | Fe2O3 | P2O5 | BaO | FeO | Fe2O3 | P2O5 | |
| IP35 | 0 | 35 | 65 | 0 | 8.0 | 29.9 | 62.1 |
| 10BaIP35 | 10 | 31.5 | 58.5 | 9.6 | 7.3 | 26.9 | 56.2 |
| 20BaIP35 | 20 | 28 | 52 | 19.2 | 7.4 | 23.4 | 49.9 |
The immersion tests were performed according to MCC-2 static, high-temperature leach test method8) due to iron phosphate glasses have high water durability without weight loss after immersion tests in water at ~90℃. Specimens for immersion tests were made to plates of 10 × 10 × 3 mm with polished mirror surfaces using CeO2 powder. The sample was suspended by a fluoroethylene resin thread in a PTFE sealed vessel (TAF-SR-50, Taiatsu Techno Co., Japan) and immersed in ultrapure water at 18.2 MΩ·m. The glass surface area to solution volume ratio was 0.0065 ± 0.0005 mm−1. The vessel containing a suspended sample was held at 120℃ for 24–168 h.
The water durability of samples was evaluated by the weight loss per a specific surface area, the pH of the leachate solution and the normalized elemental mass release. The weight loss per a specific surface area, ΔW/S, was calculated by the measured weight loss ΔW and sample surface area S. The pH values of leachate solutions were measured with a pH electrode (D-51, HORIBA, Japan). These values are average using measurements of three different samples. The elements in the leachate were measured by inductively-coupled plasma mass spectrometry (ICP-MS, Varian 820-MS, Varian, USA). The normalized elemental mass release Ri was calculated from the equation,
| \[R_i = \frac{C_i}{f_i \cdot (S \cdot V^{ - 1})}\] | (1) |
Microstructure of the reaction layer formed by immersion tests on the 20BaIP35 glass was evaluated using FE-SEM (S-5500, HITACHI, Japan) and 200 kV TEM (JEM-2100, JEOL Ltd., Japan). TEM samples were prepared by stripping the reaction layer from glass sample in ethanol, then placing the layer fragments on TEM grid. The electron beam diffraction and TEM-EDS were performed to the TEM samples.
Figure 1 shows weight loss per surface area with immersion time for IP35, 10BaIP35 and 20BaIP35 glasses. The ΔW/S of binary iron phosphate (IP35) glass increases gradually with immersion time. ΔW/S of IP35 glass immersed for 168 h has a value of ~1.1 × 10⁻⁸ kg mm−2 (~0.3% of initial sample weight). On the other hand, 10BaIP35 and 20BaIP35 glasses have hardly change in weight loss even after 72 and 168 hours immersions. These glasses immersed for 168 h have ΔW/S values (< 1.0 × 10⁻⁹ kg mm−2, < 0.03% of initial sample weight) ten times smaller than that of binary iron phosphate glass. Figure 2 shows how the pH of the leachate solutions changes with time for the samples, with the more acidic solutions correlated with glasses with the lowest barium content.

Variations of weight loss with immersion time for glass samples. Inset: weight loss for the barium iron phosphate glasses magnified. Dotted lines are added as guides to the eye.
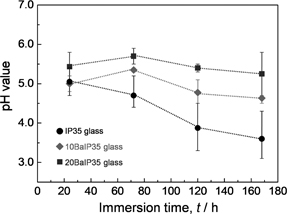
Comparison of measured pH values of leachate solutions. Dotted lines are added as guides to the eye.
Figure 3 shows the normalized mass release data for barium, phosphorus, and iron from 20BaIP35 glasses. 20BaIP35 glass was used as a representative composition with low ΔW/S values. 20BaIP35 glass preferentially releases ions in the order P > Ba > Fe. The dissolution rates of barium and phosphorus ions expressed by the slopes decrease after 72 h.

Normalized mass release of barium, phosphorus, and iron for 20BaIP35 glasses. The dotted lines are guide to the eyes.
Figure 4 shows the macroscopic appearance of the samples before and after immersion tests. After immersion at 120℃ for 168 h, IP35 glass is macroscopically broken (Fig. 4(b)). The extent of fracture gradually increased with immersion time. The barium iron phosphate glasses exhibit interference color in the surface region without macroscopic shape change (Fig. 4(c)). The cross sign on the immersed barium iron phosphate glass is from the fluoroethylene resin thread used for suspension. The reaction layer was hardly formed on areas of the sample in contact with the thread.

Macroscopic appearance of samples: (a) before immersion tests and after immersion for 168 h: (b) IP35 glass and (c) 20BaIP35 glass.
Figure 5 shows FE-SEM micrographs of a cross section view of 20BaIP35 glass samples immersed for (a) 24 h and (b) 72 h. For the following evaluations, 20BaIP35 glass is used as a representative composition. The reaction layer is formed on the surface of the glass matrix. A gap is observed between the layer and glass matrix. The matrix of the sample immersed for 168 h has a large number of voids measuring 200 nm wide with a depth of < 1 μm. The thickness of reaction layer was measured by FE-SEM micrographs. The respective thicknesses of reaction layer in the samples immersed for 24, 72, and 120–168 h were 60–120, 120–170, and 150–230 nm, respectively. Figure 6 shows variations of reaction layer thickness and weight loss with immersion time for 20BaIP35 glass. The thickness increases with immersion time up to 120 h and then becomes constant at 150–230 nm. The dissolution rates of glass components also decrease after 72 h (Fig. 3). The results of Fig. 6 suggest that the formation of reaction layer with > 150 nm inhibits the elution of glass matrix components.

FE-SEM micrographs of a sectional view of 20BaIP35 glass samples: immersed for (a) 24 h and (b) 72 h.

Variations of reaction layer thickness and weight loss with immersion time for 20BaIP35 glasses. The dotted lines are added as guides to the eye.
Figure 7 shows the micrographs of the reaction layer in 20BaIP35 glass: (a) TEM bright field image and (b) FE-SEM micrograph. A spotted contrast is recognized in Fig. 7(a) with a white line. The contrast results from the aggregates structure observed in Fig. 7(b).

The micrographs of the stripped reaction layer fragments: (a) the bright field image and (b) FE-SEM micrograph.
Table 2 shows cation ratios of Fe/P and Ba/P of 20BaIP35 glass before immersion tests and the reaction layer. The cation ratios of the reaction layer were calculated by the average of TEM-EDS results for ten places measured on the fragment of length 4 μm. Oxygen element was qualitatively detected in both as-prepared glass and the reaction layer. Fe/P ratio of the reaction layer is 11 ± 2. No Ba element (< 1 at%) was detected from the reaction layer. From the result, the reaction layer has a Fe–O richer composition as compared to the glass before immersion tests (Fe/P = 0.5 → 11).
| Sample | Fe/P (Atomic ratio) | Ba/P (Atomic ratio) |
|---|---|---|
| 20BaIP35 glass (Before the test) |
0.5 ± 0.02 | 0.19 ± 0.01 |
| Reaction layer | 11 ± 2 | < 1 |
Figure 8(a) shows the selected-area electron diffraction (SAED) patterns of the reaction layer using a selected area aperture with a diameter of ~1.4 μm. The SAED pattern shows a bright and broad ring at 0.25–0.35 nm (like an amorphous halo) and several Debye-Scherrer rings (pale rings). Debye-Scherrer rings were diffracted from d-spacing values of 0.225, 0.198, 0.173, and 0.156–0.148 nm. Figure 8(b) illustrates the SAED pattern of the reaction layer using a selected area aperture with a diameter of ~140 nm. The SAED pattern has reflections from nanocrystals and diffused rings. The reflections diffracted from the d-space values of 0.225, 0.198, 0.173, 0.156, and 0.148 nm. These d-spacing values correspond to 6-line ferrihydrite (Table 3).9–12)

SAED patterns of the reaction layer using selected area apertures with diameters of (a) ~1.4 μm and (b) ~140 nm. The d-values of reflections are included in (b).
The result of SAED pattern indicates that the reaction layer consists of ferrihydrites as iron hydroxides. The results of cation ratio (Table 2) and SAED pattern (Fig. 8) suggest the existence of non-crystalline phase containing phosphorus without apparent reflection on SAED pattern.
The SAED results reveal that the reaction layer of 20BaIP35 glass has 6-line ferrihydrite phases. Ferrihydrite is a kind of ferric hydroxide with a nominal composition of 5Fe2O3·9H2O.12) On the other hand, elementary phosphorus was detected in the reaction layer without any specific crystalline phases by TEM-EDS. This result suggests the existence of a non-crystalline phase containing phosphorus. In summary, the reaction layer consists of 6-line ferrihydrite nanocrystal and a non-crystalline phase containing phosphorus.
The phases detected in the reaction layer are similar to those in the film formed by iron phosphate coating for the surface treatment of metals.13–16) According to Pryor et al.14,15) protective film is formed on steel plate due to immersion in pH 4.5–12.3 NaPO3 solution at room temperature. The film consists of γ-Fe2O3 and FePO4·2H2O phases. Hashimoto and Cohen reported similar films composed of γ-FeOOH and FePO4·2H2O phases by anodic deposition in pH 5–8 NH4ClO4, Fe(ClO4)2, and NH4H2PO4 solution at 25℃.16) In these studies, iron ions react with phosphate and hydroxide ions in the solution, and the film consisting of ferric hydroxide (or oxide) and iron phosphate is formed as precipitation. In our study, the glass component ions are released into the leachate solutions (Fig. 3). Although the release elements of phosphorus and barium increased with immersion time, the values of ΔW/S little change after 72 h (Fig. 1). It is considered that the weight loss is balanced by precipitation of the hydroxide using release ions from the glass samples. Then the low iron concentration in the leachate supports the formation of the reaction layer by precipitation of release ions from the glass surface. Consequently, Fe2+and Fe3+ ions, and phosphate ions17) such as HPO42−, H2PO4− dissolved from the glass matrix. The reaction layer seems to be formed by deposition of ferrihydrite and iron phosphate.
4.2 Effect of BaO additionNo Ba element (< 1 at%) was detected in the reaction layer. However, the reaction layer was formed only on the samples containing 10 and 20 mol% BaO. It is presumed that BaO content influences the formation of the reaction layer. Pryor and Cohen14) reported that the formation rate of protective film at pH 7.0 was faster than that at pH 4.5. This report suggests the formation of reaction layer depends on pH values. In our study, phosphate ion dissolved from glass sample. Phosphate ion produces the decrease of pH value toward acidic side at glass surface locally due to proton dissolution by dissociation.18) Figure 2 shows the pH values of binary iron phosphate glass tend to decrease with immersion time. Although the barium iron phosphate glasses release phosphate ions, the pH values of the leachate are almost constant with immersion time. It is considered that the release of barium ions affect an increase of pH value. Huang et al. reported dissolution of alkali and alkaline earth metal oxides resulted in pH value decrease by an additional reaction.19) Consequently, the glass surface created more basic leachate solutions locally. It is inferred that BaO addition promotes the formation of the reaction layer by the increase of local pH around glass surface.
4.3 Formation process of the reaction layerThe formation process of reaction layer is considered in terms of phase and microstructure. Figure 9 shows a schematic diagram of the formation process of the reaction layer in 20BaIP35 glass. The glass constituent ions such as Fe2+, Fe3+, H2PO4−, and Ba2+ react with H2O molecule and these ions are dissolved to the leachate. The Fe2+ and Fe3+ ions react with hydroxide and phosphate ions to form the reaction layer components such as ferrihydrite and iron phosphate. The dissolution of Ba2+ ion causes the increase of local pH around glass surface and promotes the formation of the reaction layer components. Figure 7 shows 20BaIP35 glass forms a flat layer with thickness of 60–120 nm after immersion for 24 h. After the reaction layer initially forms, the dissolution of the sample glass progresses, and the layer thickness increases up to > 150 nm (Fig. 6). The dissolution could be considered to proceed between the reaction layer and glass matrix due to penetrating water through the aggregated structure of the reaction layer. This process could explain the formation of the voids after immersion for > 24 h (Fig. 7). The reaction layer thickness grows in the direction of the glass matrix due to precipitation of ferrihydrite and iron phosphate on the underside of the layer. External water becomes difficult in passing through the layer with the increase of the reaction layer thickness. The decrease of penetrated water results in the saturation of the solution under the reaction layer and the dissolution of glass matrix is inhibited.

The scheme of formation behavior of the reaction layer.
Formation of the reaction layer contributes to water durability in BaO–FeO–Fe2O3–P2O5 glasses. The samples with the reaction layer have extremely small weight loss (< 1.0 × 10⁻⁹ kg mm−2, < 0.03% of initial sample weight), and the weight loss hardly changes with immersion time. Their dissolution amounts depend on the thickness of the reaction layer. The reaction layer with > 150 nm in thickness acts as a protective layer. The reaction layer consists of 6-line ferrihydrite nanocrystals and the non-crystalline phase containing phosphorus. The released glass constituent ions such as Fe2+, Fe3+, H2PO4− react on the glass surface to form the reaction layer. No Ba was detected from the reaction layer due to TEM-EDS analysis, however, BaO addition effects presumably the formation of the reaction layer due to the increase of local pH around glass surface.