Abstract
In regard to the dimensional accuracy of additive manufactured parts, the prediction and control of residual stresses constitute a challenging issue. The objective of this research is to develop a simplified method of estimating residual stresses in powder-bed electron beam additive manufacturing (EBAM). We propose a model in which residual stresses arise from thermal strains during the cooling step, and confirmed the validity of the model by X-ray diffraction using the sin2ψ method and the modified internal residual stress method. The stress distribution of the model showed good agreement with the experiment except in local areas such as the side of the additive layer and the interface with the base plate. We clarified that the residual stresses of manufactured parts in powder-bed EBAM can be mostly estimated by thermal strains induced in the additive layer and the base plate during cooling step.
1. Introduction
In metal-based additive manufacturing, the residual stress distribution of a manufactured part is complicated since the whole part is built by the metal melting and solidifying processes.1–8) It is necessary to predict and control residual stress formation because residual stresses cause deformation and cracking. The characteristics of residual stress formation have been studied in parts of various size composed of various materials manufactured by power directed energy deposition and wire directed energy deposition.1–6) On the other hand, residual stresses in the case of powder-bed electron beam additive manufacturing (EBAM) have not been considered a serious problem, since powder-bed EBAM parts with a preheat step are kept at a high temperature during the process. However, residual stresses in a simple prism of “Inconel 718” had peak values of 90 MPa.8) In addition, these residual stresses were distributed inside the parts, and the greater the proximity to the base plate, the more marked the transition from tensile to compressive strain became.8) Since stresses would concentrate in thin supports and lattice structure, these residual stresses should not be considered negligible.
Thermo-elastic-plastic analysis by the finite element method (FEM) would be effective in calculating residual stresses. However, in EBAM where the preheat and melt steps are repeated by a high-speed heat source, it would be impracticable to model all the manufacturing steps because the simulation would take such a long time. Thus, the development of a simplified method to estimate residual stresses would be of great value.
The objective of this research is to develop a simplified method of estimating residual stresses in powder-bed EBAM. We propose a model in which residual stresses arise from thermal strains during the cooling step, and confirmed its validity by FEM and an experimental study using a fundamental model.
2. Experimental Procedure
2.1 Simulation approach
Residual stresses arise solely from plastic and thermal strain distribution, unless there is an external load. In powder-bed EBAM process, the preheat temperature is kept at approximately 700–1000℃8–12), and build velocity is several millimeters per hour. Manufactured parts are generally kept above creep temperature for several hours or days, and induced strains and stresses during the melting process would be relieved. Therefore, thermal and plastic strains induced during the cooling step are considered to be the dominant factor in residual stress formation.
The cooling rate during the creep temperature, e.g. approximately 700–1000℃, is generally high. For example in this experimental condition, the average rate at the base plate was 19℃/minute from 1000℃ to 700℃. In addition, since manufactured parts are cooled with preheated powder bed, large temperature gradient during the cooling step is rarely induced. In this condition, influence of strain relaxation would be small, and generation of plastic strains resulting from inner temperature difference would be limited. Therefore, in order to estimate residual stresses in the manufactured parts, it is considered to be valid to consider only thermal strains induced during the cooling step.
2.2 FE methodology
To perform a calculation considering the thermal strains induced during the cooling step, the following FE model was developed. We developed a 3D FEM model using commercial software “SYSWELD”. Figure 1 shows the model configuration. The model consisted of a base plate and an additive layer. The base plate and the additive layer had dimensions of 150 × 150 × 10 mm3 and 40 × 40 × 10 mm3, respectively. The additive layer was located at the center of the baseplate. The workpiece was meshed with eight-node linear hexahedron solid elements. The model was composed of 154,240 elements. The parts and the base plate were attached completely.

In calculating stresses and deformation, thermal strains generated during the cooling step were provided in the base plate and the additive layer. Table 1 shows the material properties used by FEM. The base plate was 304 stainless steel of γ-f.c.c. single phase, and the additive layer was 12 Cr steel with martensitic transformation. The thermal strain was equivalent to thermal strains generated from the maximum preheat temperature (1000℃) to ambient temperature (20℃). Thermal strains of the additive layer contain martensitic transformation strains. Young's modulus, Poisson's ratio and yield stress are at ambient temperature. The model assumes isotropic hardening.
Table 1
Material properties in FE simulation.
| Parameters |
Values |
Base plate
(SUS13)) |
Additive layer
(12Cr steel)
(experimental values) |
| Young’s modulus, Es/GPa |
192 |
210 |
| Poisson’s ratio, νs |
0.3 |
0.28 |
| Yield stress, σy/MPa |
271 |
685 |
| Work hardening rate, dσ/dε/GPa |
14 |
54.5 |
Thermal strain (1000℃ → 20℃),
Δεth (%) |
−1.8 |
−1.1 |
The boundary condition is defined to restrict the model rotation.
2.3 Experimental methodology
The samples were fabricated by an “ARCAM A2 EBM” system. The powder used in this study was gas-atomized 12Cr steel powder with the nominal composition shown in Table 2. The powder consisted of spherical particles with a size of 45–126 μm. Cubic samples with dimensions of 40 × 40 × 10 mm3 were built directly on the base plate without support structures in the conditions shown in Table 3.
Table 2
Chemical composition (mass%) of 12Cr steel.
| Fe |
Cr |
W |
Co |
V |
C |
Nb |
| Bal. |
10.5 |
2.5 |
1.0 |
0.2 |
0.09 |
0.08 |
Table 3
Build parameters for EBAM.
| Parameters |
Values |
| Input heat power, P/W |
300 |
| Layer thickness, tlayer/mm |
0.07 |
| Preheat temperature, Tp/℃ |
Max.1000 |
Residual stresses of manufactured parts were measured by X-ray diffraction using the sin2ψ method and the modified internal residual stress (MIRS) method.14–16) Figure 2 shows the measuring point. The sin2ψ method was applied on the surface with a pitch of 3 mm, and the MIRS method was applied at the center. Table 4 shows the measuring conditions of the sin2ψ method. In the MIRS method, the reference diameter was 2.5 mm and Young's modulus was 210 GPa.
Table 4
Measuring condition of sin
2ψ method.
| Parameters |
Values |
| Voltage, U/kV |
40 |
| Current, I/mA |
40 |
| Beam size, db/mm |
2 |
| Wavelength, Lw/nm |
0.2291 (CrKα) |
| Measuring time, tm/s |
100 |
| Young’s modulus, Ex/Gpa |
223.45 |
| Poisson’s ratio, νx |
0.2729 |
| Stress constant, Cx/MPa/deg |
−318 |
| Diffraction plane |
{211}/154.5° |
| ψ angle, θψ (point) |
10 |
| Rocking ω axis, θω/deg |
± 2° |
3. Results and Discussions
In order to evaluate residual stress distribution, stress contours by FEM are shown in Fig. 3. Figure 4 shows stress contours of YZ cross-section in the center of the model. The stresses generated notably in the X and Y directions (the in-plane directions), and showed higher value at the boundary of the base plate and the additive layer. From Fig. 4, the in-plane stresses inside the additive layer were in tension on the surface and in compression near the boundary. The in-plane stresses inside the base plate were in compression on the bottom and in tension near the boundary. The stresses of the Z direction (growth direction) were relatively small except at the point of the additive layer corner where stress concentrated. Since stresses would arise from the thermal strain mismatch between the base plate and the additive layer, the tendency for the in-plane stresses near the boundary to be higher would be reasonable.

In order to confirm the validity of FEM, FEM results are compared with those of the experiment in Fig. 5 and Fig. 6.
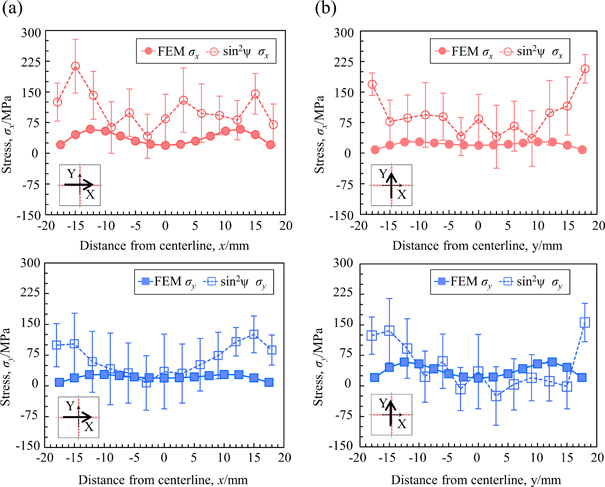
Figure 5 shows the stress distribution profile on the surface. Figure 5 (a) and (b) indicate the line profile of the X and Y direction, respectively.
As shown in Fig. 5(a), the experimental values (sin2Ψ method) of the central region (−12 mm ≦ x ≦ +12 mm) were +41–+141 MPa (σx) and +7–+107 MPa (σy) with no drastic change, and the experimental values around the both sides (x ≧ +15 mm, x ≦ −15 mm) were relatively high. The simulation values (FEM) indicated a slightly double-peak pattern where the maximum stress was located around the both sides (x = ±12.5 mm). The values were +19–+58 MPa (σx) and +8–+27 MPa (σy), and the values of the central region (−12 mm ≦ x ≦ +12 mm) were almost inside the confidence interval of the experiment.
As shown in Fig. 5(b), the stress distribution showed the similar tendency with Fig. 5(a). The experimental values of the center region (−12 mm ≦ y ≦ +12 mm) did not change drastically where the values were +36–+99 MPa (σx) and −24–+91 MPa (σy), and the values around the both sides (y ≧ +15 mm, y ≦ −15 mm) were slightly higher. The simulation values also showed a slightly double-peak pattern, and the values of the center region (−12 mm ≦ y ≦ +12 mm) were mostly inside the confidence interval of the experiment.
Thus, it was clarified that the FEM results showed good agreement with the experimental values except in the both sides.
The experimental profile, where the stresses around the both sides showed relatively high, was unique, and difference from the knowledge in welding structure where normal stress decreases near the free plane. Because the top surface of the additive layer has no huge asperity pattern, the influence of stress concentration due to the surface geometry would be small. The primary causes of the unique profile are considered likely to be the elastic strain distribution. In AM process, it has been discussed that some particular temperature distribution during cooling step might generate an inverse quench effect whereby sides of additive layer cool more slowly3). If the effect was induced at approximately 700–1000℃ where plastic strain would be easy to generate, the shrinkage force from the inner region might generate compressive plastic strain around the sides of the additive layer. The plastic strain would not be relieved during the cooling and remain at ambient temperature. When the variation of total strain is not equal to the variation of the plastic strain because of the surrounding restraint, the elastic strain would be induced to balance the plastic strain. As a result, the characteristic profile was considered to be generated.
Figure 6 shows the result for internal stress distribution along the center line profile of the Z (growth) direction with the top surface at 0 on the horizontal axis.
The experimental values obtained by the MIRS method were in biaxial stress where the stresses of the X and Y directions were the same, and indicated distribution like a cubic function whose inflection point was located at the boundary between the base plate and the additive layer. The stresses in the additive layer were in compression at all the points and the maximum compressive stress was −185 MPa at z = +7 mm. The stresses in the base plate were in tension at all the points and the maximum tensile stress was +233 MPa at z = +13 mm. The stress at the boundary (z = +10 mm) was nearly zero.
Only one point was plotted in the simulation results since the values of the X and Y directions were the same. Similar to the MIRS results, the FEM results showed a tendency like a cubic function. The stresses in the additive layer were in compression at all the points and the maximum compressive stress was −255 MPa at z = +9 mm. The stresses in the base plate were in tension at all the points and the maximum tensile stress was +327 MPa at z = +11 mm. The stress at the boundary (z = +10 mm) was nearly zero. The maximum stresses obtained by the FEM method were slightly higher than those obtained by the MIRS method and, in addition, the difference between the FEM and the MIRS method became greater around the boundary of the base plate and the additive layer (z = +8–+12 mm). However, the FEM and MIRS results were fairly close inside the additive layer (z = 0–+7 mm) and the base plate (z = +13–+15 mm), with a difference of −3–+88 MPa, and the valid range of the proposed model was proved.
Causes of the difference of the stress values in the boundary as shown in Fig. 6 and the consistency with the previous research are discussed in the following.
Firstly, the stress difference is considered to be attributable to the influence of component dilution during the manufacturing process. In the proposed FE model, the material properties and the thermal strains changed drastically at the boundary. However, this model would be slightly different in realistic conditions.
In the manufactured parts, the properties at the boundary would vary gradually due to composition dilution of 12Cr steel (the additive layer) and SUS304 (the base plate). Since the gradual variation of the properties directly influences stress distribution, the stress variation of the experiment certainly was smoother than in the case of the proposed method. Development of an FE model with well-defined material properties would play a critical role for improving the accuracy of the stress estimation at the boundary, although the need to evaluate the local-field material properties poses a challenge.
Next, the consistency with the previous study is discussed. The stress distribution in this research showed the same tendency as in the previous study where the greater the proximity to the base plate, the more compressed the in-plane stresses in the additive layer became.8) However, the absolute values of stresses showed some difference and were higher than those in the previous research. Based on the proposed model, thermal strains generated during the cooling step are the critical factor for residual stress formation. In addition, the size of the additive layer influences the stress values in terms of stress balance. The thermal strain from 1000℃ to 20℃ in this research (12Cr) is −1.1% (Table 1), and is smaller than those of the previous study with −1.4% of “Inconel 718”17): the difference of thermal strains between the base plate and the additive layer are larger in this research. Moreover, the size of the additive layer in this study, 40 × 40 × 10 mm3, is larger than that of the additive layer in the previous study, 10 × 5 × 20 mm3. This tendency would lead to larger stresses, and the consistency with the previous research was confirmed.
4. Conclusion
The objective of this research is to develop a method of estimating residual stresses in EBAM. We proposed a model in which residual stresses arise from thermal strains during the cooling step. The validity of the model was confirmed by comparison with the experimental results.
The conclusions are summarized below.
-
(1)
The surface stresses of the FE model showed almost inside the confidence interval of the experiment in the central region.
-
(2)
The internal stresses of the FE model were different in certain respects around the boundary of the additive layer and the base plate; however, the stresses inside the additive layer and the base plate were fairly close to those in the case of the experiment.
-
(3)
The residual stresses of manufactured parts in powder-bed EBAM can be mostly estimated by thermal strains induced in the additive layer and the base plate during cooling step except in local areas such as the side of the additive layer and the interface with the base plate.
Product names mentioned herein may be trademark of their respective companies.
REFERENCES
- 1) P. Rangaswamy, M.L. Griffith, M.B. Prime, T.M. Holden, R.B. Rogge, J.M. Edwards and R.J. Sebring: Mater. Sci. Eng. A 399 (2005) 72–83. 10.1016/j.msea.2005.02.019
- 2) L. Wang, S.D. Felicelli and P. Pratt: Mater. Sci. Eng. A 496 (2008) 234–241. 10.1016/j.msea.2008.05.044
- 3) R.J. Moat, A.J. Pinkerton, L. Li, P.J. Withers and M. Preuss: Mater. Sci. Eng. A 528 (2011) 2288–2298. 10.1016/j.msea.2010.12.010
- 4) C.A. Brice and W.H. Hofmeister: Metall. Mater. Trans., A 44A (2013) 5147–5153. 10.1007/s11661-013-1847-z
- 5) N. Hoye, H. Li, D. Cuiuri and A. Paradowska: Mater. Sci. Forum 777 (2014) 124–129. 10.4028/www.scientific.net/MSF.777.124
- 6) R. Cottam and J. Wang: J. Mater. Res. 29 (2014) 1978–1986. 10.1557/jmr.2014.190
- 7) A.S. Wu, D.W. Brown, M. Kumar, G.F. Gallegos and W.E. King: Metall. Mater. Trans., A 45A (2014) 6260–6270. 10.1007/s11661-014-2549-x
- 8) L.M. Sochalski-kolbus, E.A. Payzant, P.A. Cornwell, T.R. Watkins, S.S. Babu, R.R. Dehoff, M. Lorenz, O. Ovchinnikova and C. Duty: Metall. Mater. Trans., A 46A (2015) 1419–1432. 10.1007/s11661-014-2722-2
- 9) B. Cheng, S. Price, J. Lydon, K. Cooper and K. Chou: ASME J. Manuf. Sci. Eng. 136 (2014) 061018-1–12.
- 10) S. Price, B. Cheng, J. Lydon, K. Cooper and K. Chou: ASME J. Manuf. Sci. Eng. 136 (2014) 061019-1–10. 10.1115/1.4028485
- 11) S.H. Sun, Y. Koizumi, S. Kurosu, Y.P. Li and A. Chiba: Acta Mater. 86 (2015) 305–318. 10.1016/j.actamat.2014.11.012
- 12) W.J. Sames, K.A. Unocic, R.R. Dehoff, T. Lolla and S.S. Babu: J. Mater. Res. 29 (2014) 1920–1930. 10.1557/jmr.2014.140
- 13) J. Guiral, E. Rodriguez, A. Bayon and L. Jones: Fusion Eng. Des. 84 (2009) 2187–2196. 10.1016/j.fusengdes.2009.04.009
- 14) H. Kitano, S. Okano and M. Mochizuki: Quarterly Journal of the Japan Welding Society 31 (2013) 124s–128s. 10.2207/qjjws.31.124s
- 15) R.H. Leggatt, D.J. Smith, S.D. Smith and F. Faure: J. Strain Anal. Eng. Des. 31 (1996) 177–186. 10.1243/03093247V313177
- 16) P. Bouchard, D. George, J. Santisteban, G. Bruno, M. Dutta, L. Edwards, E. Kingston and D. Smith: Int. J. Press. Vessels Piping 82 (2005) 299–310. 10.1016/j.ijpvp.2004.08.008
- 17) “InconelR alloy718 Product Specifications”. SPECIAL METALS. http://www.specialmetalswiggin.co.uk/pdfs/products/INCONEL%20alloy%20718.pdf, (accessed 2017-04-14)