Abstract
Continuous cooling transformation of plain high chromium cast irons with Cr/C value from 2 to 15 was investigated using a transformation measuring apparatus with subzero function, and the transformation behavior was clarified. Both AC1 and nose temperature of pearlite transformation (TP-n) rose slightly and its nose time (tP-n) shifted to long time side with an increase in Cr/C value. When the austenitizing temperature was increased, TP-n did not change but tP-n moved to long time side in each Cr/C value. The relationship between tP-n and Cr/C value can be expressed by following equations (1). MS and Mf temperatures rose with increasing Cr/C value and the relations can be expressed by equations below (2). As Cr/C value increased, the maximum hardness after finishing transformation increased to the highest at 6 Cr/C, and then decreased in spite of subzero treatment.

This Paper was Originally Published in Japanese in J. JFS 90 (2018) 224–229.
1. Introduction
High Cr cast irons containing Cr content from 10 to 30 mass% are Fe–Cr–C ternary alloys and they have been applied as wear, corrosion or heat resistant materials depending on the Cr content. Since M7C3 carbide has high hardness, the high Cr cast iron with eutectic M7C3 carbide has an excellent abrasive wear resistance and has been preferably used for rolls of hot strip mills and mineral pulverizing mills.
Some alloying elements like Mo and Ni are usually added to the high Cr cast iron to improve heat treatment behavior. If these alloying elements will be added to the cast iron, the transformation behavior must be changed in heat treatment process. Therefore, it would be useful to clarify the relationship between added alloying elements and the behavior of continuous cooling transformation (CCT) diagram that is the fundamentals of heat treatment. Before clarifying the effect of alloying elements, the CCT diagrams of plain high Cr cast irons must be understood.
As for the studies of CCT diagrams of high Cr cast irons, it had been researched by F. Maratray,1) M. Kuwano2,3) and C. Tong.4) However, the systematic researches of plain high Cr cast irons with wide range of Cr and C can not be found. Besides that, MS and/or Mf temperatures could not always be measured in the case that either or both of them lies below room temperature.
In this study, therefore, the CCT curves of plain high Cr cast irons varying Cr/C value from 2.64 to 14.9 were obtained using an automatic transformation measuring apparatus with subzero function (Formastor-F and F-2, Fuji Electric Industrial Co., Ltd.). Their CCT diagrams were constructed from the cooling curves and the relationships between Cr/C value and behavior of continuous cooling transformation were made clear.
2. Experimental Procedures
2.1 Production of specimens
In this work, Cr/C parameter which tells Cr and C concentrations in austenite was introduced to discuss the transformation behavior. 16 kinds of plain high Cr cast irons were prepared by changing Cr and C contents in the range of 9.7 to 26.8 and 1.4 to 3.6%, respectively, and resultantly, Cr/C values ranged between approximately 2 to 15.
Charge materials of 1.3 kg were melt using a high frequency introduction furnace and poured from 1773 K into a Y-block type CO2 sand mold with cavity size of 10 × 52 × 90 mm. The chemical composition of specimens is shown in Table 1. After the cast ingots were annealed at 1223 K for 18 ks, the test pieces with ϕ4 × 10 mm to measure the CCT curves were made using a wire-cutting machine.

Table 1 Chemical composition of test materials (mass%).
The test piece was heated up to two levels of austenitizing temperatures, 1273 K and 1323 K for 600 s and held it for 1.8 ks. Then, the test piece was cooled at various constant rates. The start and finish temperatures of pearlite (PS, Pf), bainite (BS, Bf) and martensite (MS, Mf) transformations were determined from the transformation points on cooling curve.
How to determine the start and finish temperatures of each transformation is illustrated in Fig. 1. A tangent line was drawn on the straight portion of cooling curve just before expansion or contraction appeared on the curve, and then, the points at which the cooling curve was apart from the tangent line were determined as the start and/or end points of the transformations. From the transformation points obtained, CCT curves were constructed.
The nose temperature (TP-n) and the time (tP-n) of pearlite transformations were determined in the specimens cooled from each austenitizing temperature. The AC1 temperature shown in each CCT diagram was adopted the average value of transformation points measured when the same series of specimens were heated up to austenitizing temperature. MS and Mf temperatures were also adopted when they were obtained at the highest cooling rate of 10 K/s from each austenitzing temperature.
2.3 Hardness
Macro-Vickers hardness were measured at a load of 196 N (20 kgf) for all the specimens cooled to the room temperature and the relation of hardness vs. half cooling time which shows the criterion of hardenability was obtained.
2.4 Observation of microstructure
The microstructures of representative specimens of which transformations were completed were investigated by optical microscope (OM) and SEM. The microstructure was revealed by etching with Nital (HNO3: 5 cm3, ethanol: 100 cm3) for specimens with Cr content less than 20% and by Vilella (Picric acid: 1 g, HCl: 5 cm3, ethanol: 100 cm3) for those with Cr content more than 20%.
3. Results and Discussions
3.1 CCT diagrams
The CCT diagrams of specimens with 2.64, 4.64 and 11.0 Cr/C values are shown in Fig. 2(a) to (c), respectively. Pearlite (P) and martensite (M) transformations exist in all of CCT diagrams. Cr/C value increasing over 10, however, bainite (B) transformation appears between P and M transformations as shown in Fig. 2(c). It could be because Cr content in γ became high and P transformation was suppressed. The MS and Mf temperatures increases as the cooling rate decreased regardless of Cr/C value. This is because a decrease in the cooling rate made secondary carbide precipitate more from destabilized γ during cooling and then, Cr and C concentrations in γ were reduced.

Looking at the transformation points of each specimen, nose temperature of pearlite (TP-n) in the specimen with 2.64 Cr/C is around 850 K irrespective of austenitizing temperature. However, the nose time of pearlite (tP-n) in the same specimen cooled from 1273 K austenitizing was located at about 70 s and that from 1323 K austenitizing was greatly delayed to about 150 s. The MS temperatures appeared at almost 350 K in both austenitizing temperatures and the Mf temperatures were at about 180 K. When Cr/C value increased to 4.64, the tP-n was lengthened to 130 to 250 s. The MS and Mf temperatures were almost same as that of specimen with 2.64 Cr/C at 1273 K austenitization but the MS temperature descended when austenitizing temperature rose to 1323 K. In the case of the specimen with 11 Cr/C, the tP-n shifted remarkably to long time side and MS and Mf temperatures increased, while the TP-n was almost same as other specimens.
3.2 Effect of Cr/C value on temperatures of AC1 and pearlite nose temperature (TP-n)
In order to clarify the effect of Cr/C value on CCT, the relationships between AC1, TP-n and Cr/C value are shown in Fig. 3. AC1 temperature rose lineally as Cr/C value increased. TP-n rose also in proportion to an increase in Cr/C value and the temperatures did not make much difference by the difference in austenitizing temperatures. Since the slope of each line was a little different, it can be said that the change of Cr/C value affects little the degree of supercooling necessary for pearlite transformation.
The relationships between AC1, TP-n and Cr/C value are expressed by following eqs. (1) and (2).
| \begin{equation}
\mathrm{A}_{\text{C1}}\ (\text{K}) = 1018 + 7.2\ (\text{Cr/C})\quad (\mathrm{R} = 0.89)
\end{equation}
| (1) |
| \begin{equation}
T_{\text{P-n}}\ (\text{K}) = 864 + 3.7\ (\text{Cr/C})\quad (\mathrm{R} = 0.59)
\end{equation}
| (2) |
Figure 4 shows the relationship between tP-n and Cr/C value. It is evidently that the tP-n increases linearly with an increase in Cr/C value but the relation is divided by austenitizing temperatures; the higher austenitizing temperature of 1323 K postpones the tP-n around twice than the case of 1273 K austenitizing. The relationships between the tP-n and Cr/C value can be expressed by next eqs. (3) and (4).
| \begin{equation}
t_{\text{P-n}}\ (\text{s})\ (1273\,\text{K$\gamma$}) = 43\exp\,(0.3(\text{Cr/C}))\quad (\mathrm{R} = 0.67)
\end{equation}
| (3) |
| \begin{equation}
t_{\text{P-n}}\ (\text{s})\ (1323\,\text{K$\gamma$}) = 79\exp\,(0.3(\text{Cr/C}))\quad (\mathrm{R} = 0.64)
\end{equation}
| (4) |
As discussed in section 3.2, Cr/C value influences little on the degree of supercooling for the pearlite transformation because the degree of supercooling for pearlite transformation was small to the increase in Cr/C value. It is well known that an increase in Cr/C value makes the concentration of Cr increase and that of C decrease in the matrix.4,5) Therefore, it can be said that the increase of Cr concentration inhibited the C diffusion for pearlite formation. On the other hand, the increase in austenitizing temperature delayed the tP-n at the same Cr/C value. It is also considered that this was caused by the inhibition of C diffusion in matrix associated with the increase of Cr concentration as well.
3.4 Effect of Cr/C value on MS and Mf temperatures
The relationships between MS, Mf temperatures and Cr/C values are shown in Fig. 5. MS as well as Mf temperature increased with an increase in Cr/C value in both austenitizing temperatures. It is because C content in γ reduced as Cr/C values increased. Both of MS and Mf temperatures were lowered in the case of higher austenitizing temperature of 1323 K because Cr and C content in γ were more at higher austeniteizing temperature and they stabilized the austenite. The degree of dropping the MS temperature was larger than that of Mf in response to the increase of austenitizing temperature. Moreover, the temperature difference between MS and Mf temperatures by 1273 K austenitizing was about 220 K, while that by 1323 K austenitizing was 140 K.
The relationships between the MS, Mf and Cr/C value are expressed by following eqs. (5) to (8).
In the case of 1273 K austenitizing,
| \begin{equation}
\mathrm{M}_{\text{S}}\ (\text{K}) = 342 + 8.5\ (\text{Cr/C})\quad (\mathrm{R} = 0.82)
\end{equation}
| (5) |
| \begin{equation}
\mathrm{M}_{\text{f}}\ (\text{K}) = 150 + 6.8\ (\text{Cr/C})\quad (\mathrm{R} = 0.83)
\end{equation}
| (6) |
In the case of 1323 K austenitizing,
| \begin{equation}
\mathrm{M}_{\text{S}}\ (\text{K}) = 262 + 8.0\ (\text{Cr/C})\quad (\mathrm{R} = 0.67)
\end{equation}
| (7) |
| \begin{equation}
\mathrm{M}_{\text{f}}\ (\text{K}) = 143 + 4.0\ (\text{Cr/C})\quad (\mathrm{R} = 0.61)
\end{equation}
| (8) |
Figure 6 shows the representative SEM photomicrograph of specimens with Cr/C value of 2.64, 8.26 and 11.0 that transformed to pearlite from 1273 K. Matrix consists of plate-like pearlite in the specimen with 2.64 Cr/C (a). In the case of the specimen with 11.0 Cr/C, however, matrix are coarse granular pearlite (c). The matrix of specimen with 8.26 Cr/C shows mixed microstructure of plate-like and granular pearlite (b). It could not be cleared why Cr/C value affected a pearlite morphology. As the matrix of specimen with 8.97 Cr/C (No. 14) showed only granular pearlite, it will be possible that about 9 Cr/C is critical stage that determines the pearlite morphology. From our calculation using Thermo-Calc,6) it was found that M3C, M7C3 and M23C6 carbides existing at 973 K were stable at 2.7, 8.00 and 11.0 Cr/C values, respectively. From these facts, therefore, it can not be contradicted that the kind of precipitated carbide might influence the pearlite morphology.

On the specimens in which the continuous cooling transformation were completed, the relationship between macro hardness and half cooling time was obtained, and it is shown in Fig. 7. The solid and dashed lines show the hardness of specimens without subzero treatment after finishing all of the transformations and the broken line shows those with subzero treatment. In the specimens without subzero treatment, the hardness of specimen with smaller half cooling time is lower due to the more existence of retained austenite. The hardness rose with an increase in the half cooling time because MS and Mf temperatures increased by the precipitation of carbides during slow cooling and then, more martensite transformed from destabilized residual austenite. However, when the half cooling time became too longer, the hardness gradually decreased because pearlite transformation proceeded. From these results, it is found that the maximum hardness (Hmax) is obtained at the half cooling time when it passed just before the pearlite nose. When the specimen was cooled down to subzero region, on the other hand, the residual austenite transformed to martensite additionally and therefore, the hardness increased more even at the shorter half cooling time.
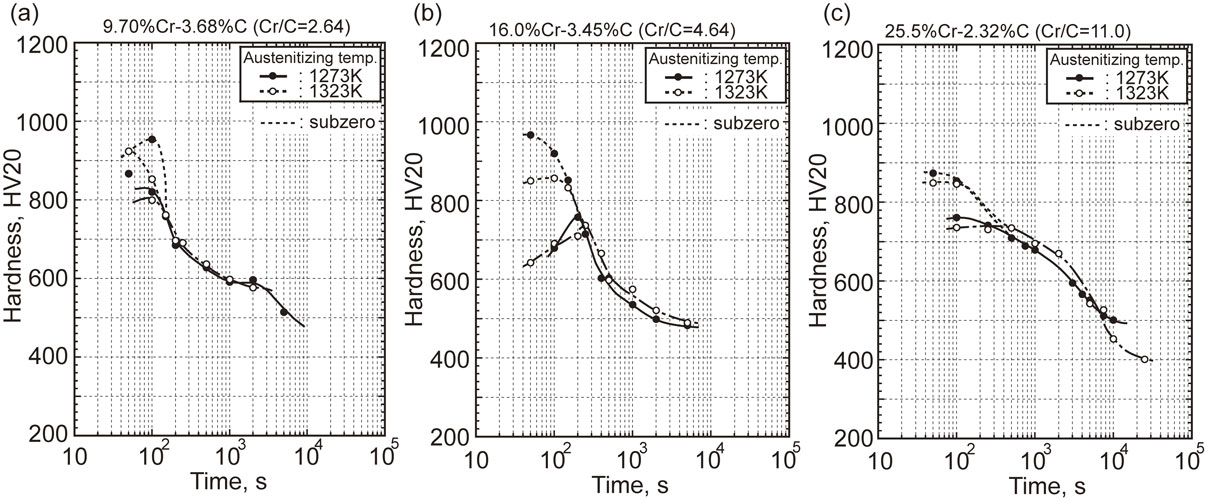
Figure 8 shows the relationship between Hmax and Cr/C values. In the specimen without subzero treatment, Hmax was low and scattered when Cr/C values was less than 6. Hmax increased to the highest at Cr/C values from 6 to 7. There, around 900HV20 was obtained in specimens without subzero treated and about 1000HV20 in subzero treated specimens. When Cr/C value got over 6, Hmax gradually lowered with increasing Cr/C value. The reason why Hmax values were low in the region of Cr/C values less than 6 is due to higher amount of retained austenite. On the other hand, the reason why Hmax values were reduced over 6 Cr/C is considered by that C concentration in matrix was lowered and therefore, the hardness of transformed martensite itself was low. Overall the specimens with subzero treatment, Hmax of specimens ausenitized at 1273 K were higher than those austenitized at 1323 K. It is noted that Hmax values of specimens austenitized at 1323 K are lower than those austenitized at 1273 K until 6 Cr/C, while over the 6 Cr/C, the Hmax values were almost the same as those austenitized at 1273 K. It could be said that the higher amount of retained austenite existed possibly even though the Mf temperature appeared at low Cr/C value.

4. Conclusion
The effect of Cr/C value on continuous cooling transformation behavior of plain high Cr cast irons with Cr/C value from 2 to 15 was investigated. The results obtained are summarized as follows.
-
(1)
Pearlite (P) and martensite (M) transformations are existed in all the CCT diagrams. However, Bainite (B) transformation occurs with P and M transformations when Cr/C values increases over 10.
-
(2)
AC1 and nose temperature of P transformation (TP-n) increase lineally as Cr/C value increases. TP-n does not change even if the austenitizing temperature decreases.
-
The relationships between AC1, TP-n and Cr/C value are expressed by following equations, respectively.
| \begin{equation*}
\mathrm{A}_{\text{C1}}\ (\text{K}) = 1018 + 7.2\ (\text{Cr/C})
\end{equation*}
|
| \begin{equation*}
T_{\text{P-n}}\ (\text{K}) = 864 + 3.7\ (\text{Cr/C})
\end{equation*}
|
-
(3)
Pearlite nose time (tP-n) shifts to the long time side with an increase in Cr/C value and austenitizing temperature. The relationship between the tP-n and Cr/C value can be expressed by next equations.
| \begin{equation*}
t_{\text{P-n}}\ (\text{s}) = 43 \exp\,(0.3(\text{Cr/C}))\ \text{at 1273$\,$K austenitizing}
\end{equation*}
|
| \begin{equation*}
t_{\text{P-n}}\ (\text{s}) = 79 \exp\,(0.3(\text{Cr/C}))\ \text{at 1323$\,$K austenitizing}
\end{equation*}
|
-
(4)
MS and Mf temperatures rise as Cr/C value increases. Both of MS and Mf temperatures are lowered by higher austenitizing temperature.
-
The equations for relationships between MS, Mf and Cr/C value are as follows.
-
In case of 1273 K austenitizing,
| \begin{equation*}
\mathrm{M}_{\text{S}}\ (\text{K}) = 342 + 8.5\ (\text{Cr/C})
\end{equation*}
|
| \begin{equation*}
\mathrm{M}_{\text{f}}\ (\text{K}) = 150 + 6.8\ (\text{Cr/C})
\end{equation*}
|
-
In case of 1323 K austenitizing,
| \begin{equation*}
\mathrm{M}_{\text{S}}\ (\text{K}) = 262 + 8.0\ (\text{Cr/C})
\end{equation*}
|
| \begin{equation*}
\mathrm{M}_{\text{f}}\ (\text{K}) = 143 + 4.0\ (\text{Cr/C})
\end{equation*}
|
-
(5)
The highest hardness (Hmax) of specimens with and without subzero treatment after finishing continuous cooling transformation appears when the Cr/C value is from 6 to 7.
REFERENCES
- 1) F. Maratray and R. Usseglio-Nanot: ATLAS. Transformation Characteristics of Chromium and Chromium-Molybdenum White Irons, (Climax Molybdenum S. A., Paris, 1970).
- 2) M. Kuwano, K. Ogi and A. Sawamoto: J. JFS 63 (1991) 613–619.
- 3) M. Kuwano, K. Ogi and A. Sawamoto: J. JFS 66 (1994) 199–204.
- 4) C.P. Tong, T. Suzuki and T. Umeda: J. JFS 62 (1990) 344–351.
- 5) G. Raynor and V.G. Rivlin: Phase Equlibria in Iron Ternary Alloys – Part 4, (The Institute of Metals, London, 1988) pp. 143–156.
- 6) B. Sundman, R. Hanson and J.-O. Andeson: Calphad 9 (1985) 153–190.


