Evaluation of the Surface Condition of Spur Gears Using the Acoustic Emission Method
2019 Volume 60 Issue 12 Pages 2542-2551

Details
2019 Volume 60 Issue 12 Pages 2542-2551
The vibration method is a standard non-destructive inspection method used to identify defects in rotary machines. However, it is difficult to detect defects at an early stage with this method. Therefore, an effective alternative monitoring technique is required to detect defects at an early stage. The acoustic emission (AE) method can be used to determine small defects in a material by detecting elastic waves that occur when cracks or deformations begin to form. In this study, we developed a method to monitor the surface condition of the gear teeth, and examined its relationship with the released AE wave. A correlation was obtained between the RMS value and the average roughness of the gear teeth surface, wherein the RMS value increases with the increase in the surface roughness. However, a large deviation was observed due to the existence of wear particles. Therefore, the effect of wear particles on AE signals was examined. The existence of the particles was estimated by measuring the AE signals of 33–140 kHz, and the approximate teeth surface roughness was estimated by measuring the AE signals of 140–300 kHz.
Large-scale gear wear due to excessive load, foreign matter contamination, and lubrication problems can cause serious mechanical component failure.1) It is rather difficult to evaluate the lifespan of gears. Therefore, regular inspection to prevent accidents due to gear failure is essential.
Current measurement methods to diagnose gear failure use the vibration method that measures the vibrations from the occurrence of the failure.2,3) It can be used to monitor gear failure due to dents, pitting, and transmission errors. However, it also has a few shortcomings. Specifically, it is difficult to detect defects at an early stage and in gears with low-speed rotation using this method.4) Therefore, a more advanced inspection method is required.
The acoustic emission (AE) method is a monitoring method that is used to identify mechanical component failure due to dynamic deformation, transformation, dislocation, micro-fracture, and breakage by detecting elastic waves inside a material.5) It can lead to earlier detection of smaller failures in rotating components compared to the vibration method.4) Furthermore, it can be used under slow rotation conditions.
Tan et al. diagnosed a lubricated gearbox via the AE method and determined that the RMS value of the AE amplitude was affected by the oil temperature, due to changes in the oil film thickness.6) Hamel et al. analyzed gearboxes while changing the quantity and temperature of lubricant to reproduce boundary lubrication, mixed lubrication, and hydrodynamic lubrication, and noted that the RMS value of the AE signals changed with the lubrication condition.7) Kostopoulos et al. analyzed gearboxes without a slip ring via the AE method and detected changes in the load experienced by gears.8) Furthermore, changes in the oil temperature and propagating cracks were also detected via the AE method.9) Elforjani et al. used the AE method to detect defects in the attached outer ring of the bearing holder, and demonstrated its ability to detect defects in worm gears.10) Miyachika et al. carried out fatigue tests on case-hardened gears and noted that the AE method can be used to detect fatigue.11) These studies show that the AE method can detect lubrication problems, crack initiation, and fatigue in various materials and types of gears.
However, the change in the RMS value of the AE amplitude due to wear in gears has not been investigated to date. Hase et al. measured severe-mild wear transition by the AE method and noted that the true area contact, size of the transfer particles, and the number of transfer particles affect the AE waveforms, while also demonstrating that the specific wear rate could be estimated using the AE method.12) Hence, it is also possible to estimate the wear condition of spur gears.
In this study, we compared the AE signals generated from the gears and the average roughness of the teeth surfaces, and evaluated the feasibility of the AE method in monitoring the surface condition of gears. A common sign of failure in gears due to pitting and tooth breakage, are changes in the teeth surface.1) Accordingly, we examined the effect of changes in the teeth surface on AE signals, to detect small surface changes that can cause critical damage. The results of the study indicate that an increase in the RMS value increases the surface roughness. However, a deviation was observed due to the existence of wear particles generated between the teeth. Therefore, we also examined the effect of wear particles between the teeth on the AE signals.
In this section, we present the AE method to monitor the surface condition of the gears. We simultaneously measured the roughness of the gear teeth surfaces and the AE waveforms generated from the gears. Furthermore, we evaluated the correlation between the roughness and RMS value.
2.1 Experimental setup 2.1.1 Gear reducerFigure 1 shows the experimental setup to monitor the AE signals from damaged gears. Table 1 lists the gear specifications. The materials used for the pinion and the large gear were brass (JIS C3604) and steel (JIS S45C), respectively. The hardness of brass was 122 HV and that of steel was 195 HV. Different types of materials were used for each gear since the effect of the large gear can be neglected. The teeth of the small gears were numbered from 1 to 16, and none of the teeth exhibited any previous damage. The rotation speed of the pinion was set to 270 rpm which was fast enough to cause wear and produce noises from the other mechanical components.

Experimental setup for monitoring the AE signals from gears.

The AE sensors used were R3α and R50α, with resonance frequencies of 30 kHz and 170 kHz, respectively, since the AE signals generated from gears exhibit frequencies of approximately 30 kHz and 150 kHz. Two AE sensors were attached on the inside and outside of the pinion side of the bearing holder. This required the AE signals to pass through the pinion, shaft, bearing, and bearing holder before reaching the sensors. Consequently, the sensitivity of this setup was lower, compared to a setup with the sensors attached directly on the pinion. However, in a previous study, AE signals generated from the failure of the gear teeth were successfully detected even without attaching the sensors directly on the pinion.10) In the case of the 30 kHz sensor, noises with a frequency lower than 20 kHz were also obtained. This stems from the machine noise and environment noise, and thus, a 25 kHz high-pass filter was used to remove the low-frequency components. The acquired AE waveforms were amplified by a preamplifier and recorded via an oscilloscope. An angle sensor was used to identify the tooth responsible for generating the AE signals.
2.1.2 Analysis methodThe AE signals were acquired for approximately one round of small gears and divided for each gear by using the angle sensor. Figure 2 depicts the method for detecting the tooth responsible for generating the AE signals. The voltage of the angle sensor decreases with the increase in the angular displacement of the pinion shaft. This property of the angle sensor was used to adapt angular displacements of the pinion teeth mesh to the voltage of the angle sensor. By measuring the voltage of the angle sensor, the tooth generating the AE signals was detected. However, the angle sensor exhibits a property wherein the voltage increases rapidly and is unstable at the point when the shaft just takes a turn. To avoid this property, the trigger was set to Ch. 1 (angle sensor) and to a voltage that was equivalent to that of tooth No. 1.

Detection method for the tooth generating the AE signals.
Table 2 lists the sampling conditions of the experiment. The AE waveforms were measured for approximately one round, in which the number of sampling points were 5.0 × 10⁶. The sampling interval was set to 400 ns, which is enough to analyze AE signals under 300 kHz. The waveforms were excessively long, and thus direct analysis was difficult. Hence, we divided the waveforms for each gear tooth based on the voltage of the angle sensor, and analyzed the frequency characteristics using the fast Fourier transform. The number of sampling points for the divided waveforms was 32768. The AE waveforms were measured every 20 minutes since the AE signals were continuously generated from the gears, which results in an excessively high number of waveforms. The measurement period when the gearboxes ceased to function normally was 1400 ks.

The method used to evaluate the average roughness was to measure the teeth tip and pitch area from end to end, 5 times. Average roughness was measured by a replica method using a laser microscope. The measured area was 1.424 mm × 1.068 mm and the resolution was 1391 nm/pixel.
Figure 3 shows the experimental procedure of the experiment. The AE waveforms were acquired until the trend of the AE signals changed. If the trend changed, the rotating gears were stopped, the teeth were cleaned with ethanol, and the surface of the teeth was observed via the replica method.

Experimental procedure for measuring the effect of changes in the tooth surface on the AE signals.
The experiment for surface changes was performed thrice. All tests indicated that the RMS value of the AE signals correlated with the average roughness.
2.2 Results and discussionThe analysis of the AE waveforms of teeth Nos. 1–13 showed that the trend of the amplitude was different for each tooth. Therefore, we analyzed the trends of the AE signals and surface roughness for tooth No. 5 and tooth No. 7, wherein the amplitude exhibited higher and lower trends. To obtain more stable data, the averaged RMS values were used. The changes in the average RMS values are shown in Fig. 4 and Fig. 5. Specifically, Fig. 4 shows the transition of the average RMS value of 10 samples before cleaning, and Fig. 5 shows the transition of the average RMS value of 5 samples after cleaning. The difference in the number of samples used is because of the effect of wear particles after cleaning. In the analysis, a few signals exhibited extremely high RMS values due to the noise from other mechanical components that were unrelated to the experiment. Therefore, AE signals exceeding 0.08 V RMS value were considered as noise and excluded from the analysis. A slight difference existed between the transitions due to the existence of wear particles. Until 300 ks, the RMS values increased monotonically since the teeth surface was worn. From 300 ks to 600 ks, the RMS values decreased since the wear subsided. After 850 ks, the RMS values increased again since the tips of the teeth disappeared due to wear. Given the disappearance, the contact period was shorter, and the contact force applied to the teeth increased.

Transition of RMS value before cleaning (average of 10 values); ((a): No. 5, (b): No. 7).

Transition of RMS value after cleaning (average of 5 values); ((a): No. 5, (b): No. 7).
Figure 6 shows the change in the RMS value of the AE signals for tooth No. 5 as filtered via a Chebyshev filter software ((a): 60–140 kHz, (b): 140–300 kHz). The RMS value changed significantly when the rotation of the gearbox was stopped to examine the teeth surfaces. This is potentially due to the change in the contact conditions of the teeth surface caused by the removal of wear particles when the gearbox was stopped.

Change in RMS value for tooth No. 5 ((a): 60–140 kHz, (b): 140–300 kHz).
Figure 7 shows the changes in the surface average roughness (Ra) of tooth No. 5 (Fig. 7(a)) and tooth No. 7 (Fig. 7(b)). During the running-in period (before 250 ks), the average roughness (Ra) monotonically increased, since the tooth surface condition changed from original to sandy. After the running-in period (250–800 ks), the average roughness decreased, and the roughness of both areas was similar. This is because both tooth areas are equally contacted at this stage. After the teeth tips disappeared, the roughness of both areas was scattered. This also caused a decrease in the meshing length and an increase in the contact time of both gear teeth. Thus, the force applied to the teeth increased.13)

Change in the average roughness (Ra); ((a): No. 5, (b): No. 7).
As shown in Figs. 5 and 7, the transition in the RMS value and average roughness (Ra) was similar. Therefore, the relationship between them was examined. Figure 8 shows the relationship between the RMS value and the average roughness (Ra) of the center surfaces. Figure 8(a) shows the relationship before cleaning, and Fig. 8(b) shows the relationship after cleaning. The difference corresponds to the existence of wear particles.

Relationship between the surface roughness and RMS value ((a): Before cleaning, (b): After cleaning).
As shown in Fig. 8, an increase in the surface roughness increased the RMS value. The correlation coefficient of both parameters corresponded to 0.29 (30 kHz) and 0.46 (170 kHz) before cleaning. Conversely, the correlation coefficient corresponded to 0.42 (30 kHz) and 0.58 (170 kHz) after cleaning, excluding the double line plot. The results indicate that the wear particles influence the AE signals, and the surface roughness can be estimated more accurately by eliminating the wear particles.
The results of this analysis indicate the possibility of estimating the surface condition using the AE method: the RMS values of the AE waveforms increased with increase in the roughness of the gear teeth surface. However, wear particles generated between the teeth also affected the AE signals. Therefore, gear-induced AE signals are changed by the wear particles and tooth surface roughness. The surface roughness can be estimated more accurately by investigating the influence of the wear particles.
The effect of the AE signals on the surface condition can also change with the material of the gears. Therefore, it is necessary to analyze the effect of the change in the gear material when estimating the surface condition using the AE method.
In this section, we examine the effect of the wear particles generated between the surfaces of the gear teeth on AE signals. We compared the difference in the AE signals generated from gears with the presence/absence of particles. Furthermore, we compared the particles and teeth surfaces, before and after the experiment, to estimate the source of the AE signals from the particles.
3.1 Experimental setup and analysis 3.1.1 Experimental setupFigure 9 shows the experimental setup to monitor the AE signals from gears. The gearbox used for the experiment was the same as that in the previous experiment. The gears used for the experiment are almost identical to those in the previous experiment, although the pinion material was changed to steel since the effect of wear was eliminated. The rotation speed of the pinion was slowed to 160 rpm to reduce the effect of wear and to focus on the effect of the particles. As shown in Fig. 6, the frequency property of the changing area was approximately 30–160 kHz. Therefore, the AE sensor used was R15α and the resonance frequency was 150 kHz. A 25 kHz high-pass filter was used to remove the low-frequency components. An 80 kHz low-pass filter and high-pass filter were used since the AE waveforms from gears exhibit peak frequencies of approximately 60 kHz and 80–160 kHz. Furthermore, the AE signals used in the experiment were filtered via the Chebyshev filter software to evaluate the effect of a specific frequency domain.

Experimental setup for monitoring the AE signals from gears.
Table 3 lists the sampling conditions of the experiment. As shown in the previous experiment, the changes in the AE signals generated from the gears corresponded to a change in the surface roughness and the effect of the wear particles generated between the gear teeth, and the RMS value of the AE signals and the surface roughness were correlated. Thus, the effect of the wear particles was lower than that of surface changes. Furthermore, the peak frequencies of the AE signals generated from the change in the surface conditions were approximately 60 kHz and 160 kHz. To distinguish the effect of the wear particles by the difference of frequency property, a more detailed analysis was needed. The sampling interval of the experiment was 100 ns, which was shorter than the previous experiment. The AE signals were acquired at an interval of 120 s and the tooth corresponding to each AE waveform was detected using the angle sensor. Unlike the previous experiment, AE signals were individually acquired since the data size of the waveforms was too high to be analyzed under the experimental conditions (Fig. 10). The rotation of the gearbox was stopped occasionally, the teeth were cleaned with alcohol, and the surface of the teeth was observed using the replica method. Simultaneously, particles were observed using a scanning electron microscope (SEM).


Detection method for the tooth generating the AE signals.
Table 4 lists the experimental conditions of the lubricant and wear particles. The lubricant used to fix the particles on the gear teeth surfaces was compound grease, and approximately 3 g of it was applied uniformly. The particles cannot be fixed if an excessively low amount of grease is used, and the effect of the particles disappears if an excessively high amount of grease is used. The particles were composed of steel with sizes ranging from 15 µm to 30 µm (Fig. 11).


Microscopic images of steel particles before testing ((a): Particles (×1000), (b): Particles (×500)).
The experiment with particles was performed thrice. All tests indicated that the RMS value of the AE signals were higher in the case of the existence of particles between the teeth.
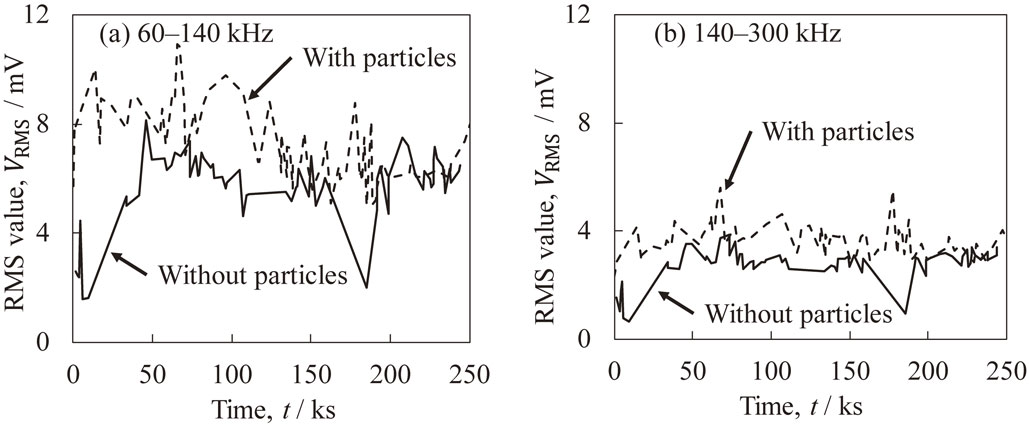
3.2 Results and discussionThe AE signals of the gears with the presence or absence of the particles were analyzed, and the AE signals generated from the tooth that generated the most signals were compared. Figure 12 and 13 show the changes in the RMS values of tooth No. 5 (Fig. 12(a) and (b)) and tooth No. 8 (Fig. 13(a) and (b)) due to the presence or absence of the particles. At the beginning of the test (until 150 ks), the RMS values for frequencies of 60–140 kHz exhibited a higher trend when compared to those in the case with particles. The increase in the RMS values in the case with particles was due to the compression and crushing of the particles between the teeth surfaces. After 150 ks, the RMS values for frequencies of 60–140 kHz exhibited a similar trend in both conditions. This was because the particles had departed from the teeth surface to the tip of the teeth, and outside the pair of gears. Based on the result, the existence of the particles was estimated by analyzing AE signals filtered at 60–140 kHz.

Comparison of the change in the RMS values of tooth No. 5 in the presence or absence of particles ((a): 60–140 kHz filtered, (b): 140–300 kHz filtered).
Comparison of the change in the RMS values of tooth No. 8 in the presence or absence of particles ((a): 60–140 kHz filtered, (b): 140–300 kHz filtered).
Compared to the change in the RMS values for frequencies of 140–300 kHz, the change in the RMS values for frequencies of 60–140 kHz was smaller, due to the existence of the particles. This indicates that the effect of the particles was lower at 140–300 kHz. Therefore, the effect of other phenomena such as the change in teeth surface could be suitably detected at this frequency range.
The cause of the different trends for frequencies of 60–140 kHz and 140–300 kHz is the characteristics of the AE sensors and the difference in propagation. The resonant frequency of the sensors affects the frequency property. The AE signals generated from the compression or fracture of particles passed through the lubricant layer, and therefore, the high frequency components were attenuated sharply.
Table 5 shows a comparison of the roughness of tooth No. 5 and tooth No. 8. As shown in the table, the average roughness of tooth No. 5 without particles was lower than that with particles. A comparison of the result and the change in the RMS values for frequencies of 140–300 kHz (shown in Figs. 12 and 13) indicated that an increase in the RMS value did not increase the surface roughness, and the trend was different from section 2. There are two reasons for this: the first is that the change in the roughness was too small to detect, and the second is that the effect of particles is low at frequencies of 60–140 kHz. Consequently, the effect of the particles was eliminated by analyzing the RMS value of the AE signals that were filtered by the 140–300 kHz band-pass filter.

Figure 14 shows the microscopic image of the tooth surface for tooth No. 5 and tooth No. 8 (the most shaved out area was observed). In the absence of the particles, the tooth surface roughness was high since the grease film thickness was low and the gear teeth were in direct contact. Conversely, the roughness of the shaved area decreased when particles were present. In both cases, the surface of the tip had the vertical line direction because of rolling particles, and the center had a glossy surface because of crushing finer particles. This indicates that the particles were sufficiently small and acted as abrasives.

Comparison of the surface condition of teeth surfaces in the presence or absence of particles (focusing on the most shaved out area, namely the edge of the surface); ((a): Tooth No. 5 without particles (Tip, Ra = 2.326), (b): Tooth No. 8 without particles (Center, Ra = 1.930), (c): Tooth No. 5 with particles (Tip, Ra = 1.968), (d): Tooth No. 8 with particles (Center, Ra = 1.809)).
Figure 15 shows the crushed steel particles that existed between the teeth surfaces, after testing. Compared to Fig. 11, the large particles were rounded. The compression due to the teeth surface leads to the chipping of the sharp edges from the particles. In the case of the particles that existed between the two surfaces, the load applied to the particles increased with the size of the particles.14) Therefore, larger particles were commonly compressed and slid, thereby leading to a round shape. However, in another study, a trend was observed wherein the size of the particles that continuously existed between two sliding surfaces decreased.15,16) Therefore, the larger particles were removed from the contacting surfaces before their size decreased. If the largest particle was removed from the contact surfaces, the second largest particle compressed and slid and was subsequently removed. This phenomenon was repeated until the particles that existed between contact surfaces were small, thereby making the teeth surface smoother.

Microscopic images of steel particles after testing ((a): Particles (×1000), (b): Particles (×1000)).
As shown in a previous study, the frequency of the AE signals generated due to wear are 100–500 kHz or exceed 500 kHz. Additionally, the AE signals with frequencies exceeding 100 kHz correspond to the fracture or plastic deformation of the wearing objects.13) To distinguish the wear mechanism, the measurement of frequencies exceeding 500 kHz was more suitable. However, when the AE signals from the gears were analyzed, it was determined that measuring the signals with frequencies exceeding 500 kHz was difficult due to the small scale and noise from other mechanical components. Consequently, in this study, AE signals in the frequency range of 60–140 kHz and 140–300 kHz were analyzed. The results indicated that decreases in the frequency values were due to the existence of particles and increases in the frequency values were due to changes in the teeth surface roughness. As indicated by the results, the AE method was used to detect the teeth surface roughness condition and the existence of particles.
The shape of the particles may also affect AE signals from the gearbox. Large and sharp particles accrue a higher magnitude of AE signals. Therefore, the effect of the AE signals on the shape of particles requires further study.
In this study, we examined the feasibility of the AE method in monitoring the surface conditions of gears. The AE signals generated from the gears were analyzed at regular intervals. Additionally, the teeth surface roughness was analyzed and compared with the AE parameters. A weak correlation was found between the RMS values and teeth surface roughness. However, a large deviation was observed and attributed to the effect of wear particles. Without the wear particles, a better correlation exists between the RMS values and teeth surface roughness. Therefore, the surface roughness can be more accurately estimated by considering the effects of wear particles.
We further evaluated the feasibility of the AE method in monitoring the condition of wear particles between gear teeth. We compared AE signals based on the presence or absence of particles while using grease lubricants. The results indicated that frequencies of 60–140 kHz were attributed to the compression or crushing of particles and that the effect of the particles was smaller at frequencies of 140–300 kHz. The existence of the wear particles was estimated by measuring the transition of the frequency of AE waveforms at 60–140 kHz, and the effect due to factors other than the particles, such as teeth surface roughness, was estimated by measuring the transition of the frequency of AE waveforms at 140–300 kHz.