Abstract
The yield strength and work hardening of Al–Mg–Si alloys are related to the concentration of solute atoms. This study was carried out to clarify the effect of two kinds of solute atoms on these properties in terms of a linear combination of contributions from a solid solution. Tensile tests were conducted with Al and with Al–0.62Mg–0.32Si, Al–0.65Mg–0.81Si, Al–2.4Mg, and Al–4.4Mg (mass%) alloys in solid solution. Work hardening was analyzed using the Kocks–Mecking model, yielding two parameters which indicate the storage and recovery of dislocations in the material. The yield strength could not be expressed as a linear combination of solute atom concentrations, but the amount of dislocation storage and dynamic recovery could be expressed as such linear combinations. In the high-strain region, the Kocks–Mecking model no longer applies, and the maximum stress at which the model failed increased with increasing concentrations of solute atoms. It is generally known that an interaction between strain fields around solute atoms and quenched-in vacancies can affect the yield strength owing to dislocation motion and that these atoms can retard the development of microstructures in high-strain regions. A linear combination of contributions from solid solutions is possible only for the storage and recovery of dislocations in the low-strain region.
This Paper was Originally Published in Japanese in J. Japan Inst. Met. Mater. 82 (2018) 314–318.
1. Introduction
In solid solution in metal, a solute atom, the size of which is different from that of a solvent atom, acts as an obstacle to dislocation motion. When the concentration of such solute atoms is low, the atoms modify the lattice constant of the metal1) and also generate strain fields around them. The interaction between dislocations and these fields in metal reduces the dislocation mobility and increases the metal strength.
In tensile deformation, the contribution of yield strength from solute atoms can be expressed as the necessary stress for dislocation to leave such strain fields.2) When the solute atom concentration is low and these strain fields are not affected by each other, an increase in the yield strength is expressed as proportional to the square root of the solute atom concentration.2)
In the plastic deformation region, solute atoms modify the amount of storage and the recovery of dislocations by affecting the dislocation motion on the slip plane and, consequently, they change the development of dislocation density. The well-known Taylor equation expresses the dependence of the dislocation density on flow stress as
| \begin{equation}
\sigma_{D} = \alpha \mu bM\rho^{1/2},
\end{equation}
| (1) |
where σ
D is an increase in strength from yield strength, and α, μ,
b,
M, and ρ are constant, bulk modulus, magnitude of the Burgers vector, Taylor factor, and dislocation density, respectively.
3) Furthermore, Kocks and Mecking proposed a model of dislocation density development (the Kocks–Mecking model)
4,5) as expressed by
| \begin{equation}
\frac{\partial \rho}{\partial \varepsilon} = k_{1}\rho^{1/2} - k_{2}\rho,
\end{equation}
| (2) |
where ε is the true strain and
k1 and
k2 are coefficients. The first and second terms in the right-hand side of
eq. (2) mean the amount of dislocation storage and dynamic recovery through dislocation interaction, respectively.
k1 and
k2 are considered as a function of solute atom concentration, but a formula for such coefficients has not been established yet. As long as σ
D depends only on dislocation density and the dislocation density depends only on strain,
eq. (1) and
eq. (2) combine to give the following equation:
| \begin{equation}
\frac{d\sigma_{D}}{d\varepsilon} = \frac{\partial \sigma_{D}}{\partial \rho}\frac{\partial \rho}{\partial \epsilon} = \frac{1}{2}\alpha \mu bk_{1}M - \frac{1}{2}k_{2}\sigma_{D}.
\end{equation}
| (3) |
This equation means that a linear relationship between dσ
D/dε and σ
D can be obtained as long as the Taylor equation and the Kocks–Mecking model apply. That is,
k1 and
k2 can be obtained from the intercept and the slope of the line, respectively. In fact, it was found that
k1 increased and
k2 decreased with increasing solute Mg concentration in relative low-strain region in Al–Mg alloys.
6,7) It was found that
k1 increased and
k2 decreased with increasing solute Cu concentration in Al–Cu alloys, too.
7,8) However, it has been considered that the above relationship will not apply in the high-strain region, that is, the high dislocation density region, because of the formation of cell structures. So far, there has not been any study to verify the Kocks–Mecking model through the entire strain region.
In metal with several kinds of solute atoms, the strength will be expressed by a linear combination of strengths due to these atoms if the total concentration of solute atoms is sufficiently low and the strain fields around them do not overlap each other. In the Al–Mg–Si alloy with Mg–Si precipitates and residual solute Mg and Si atoms, Myhr and co-workers estimated the yield strength in terms of a linear addition of strengthening contributions from precipitates and solute atoms; the estimated yield strength was in good agreement with the strength derived from the hardness-yield strength relationship obtained in the experiment.9) However, a study to verify the strengthening contribution to the yield strength and the work hardening from several kinds of solute atoms without such a conversion has not yet been reported.
In this study, using a supersaturated Al–Mg–Si alloy, we verified the linear addition of yield strength and work hardening contributions from solute Mg and Si atoms.
2. Experimental Procedure
Table 1 shows the chemical compositions of alloys used in this study. Other compositions without Al, Mg, and Si are almost the same as for these alloys. Alloy P is pure aluminum. Alloy B is a balanced alloy (Mg/Si ratio = 2). Alloy ES is an alloy with an excess amount of Si (Mg/Si ratio = 0.8). These alloys were cast followed by homogenized heat treatment at 560°C for 6 h, hot-rolling at 530°C from 72 mm to 4 mm thickness, and cold-rolling from 4 mm to 1 mm thickness in laboratory in the UACJ corporation. Japanese Industrial Standard (JIS) No. 5 tensile specimens, the tensile direction of which was parallel to the rolling direction with 50 mm gauge length, were prepared from the cold-rolled sheets. These specimens were subjected to solution heat treatment at 550°C for 30 min in air immediately followed by ice water quenching and then stored in liquid nitrogen before experiments to maintain solid solution.

Table 1 Alloy compositions for Al–Mg–Si alloys and pure Al.
Table 2 shows the chemical compositions of the Al–Mg alloys used in this study. Alloys 5052 and 5182 had different Mg concentrations. JIS No. 5 tensile specimens, the tensile direction of which was parallel to the rolling direction, were prepared from well-annealed sheets of 1 mm thickness. In these alloys, Mg was in solution. The tensile test was conducted at room temperature.

Table 2 Alloy compositions for Al–Mg alloys.
The average grain size in alloys in Tables 1 and 2 was 50–100 µm. Hence, we assumed that the effect of grain size on strength was less in all alloys. That is, the difference in yield strength in alloys is attributed to the difference in concentration in solute Mg and Si atoms.
The strain rate in the tensile test was 1 mm/min in the low-strain region to measure the precise yield strength and 10 mm/min after measuring the yield strength to suppress natural aging during the tensile test. Strain was measured by using an extensometer with a gauge length of 50 mm.
3. Results and Discussions
3.1 Tensile properties
Figure 1 shows the nominal stress–strain curves of alloy P, alloy B, and alloy ES. Figure 2 shows those of alloys 5052 and 5182. The yield and tensile strengths increase with increasing solute atom concentration in all alloys. The tensile properties obtained for all alloys are listed in Table 3.

Table 3 Tensile properties for various alloys.
If the local strain fields around all the solute atoms were independent of each other, we could express the yield strength as a linear combination of strengths due to solute Mg and Si atoms. Thus, we obtain the following equation:
| \begin{equation}
\sigma = \sigma_{0} + k_{Mg}C_{Mg}{}^{1/2} + k_{Si}C_{Si}{}^{1/2},
\end{equation}
| (4) |
where σ
0,
CMg, and
CSi are the yield strengths of Al, solute Mg concentration, and solute Si concentration, respectively, and
kMg and
kSi are coefficients. Using the values in
Table 3,
CMg and
CSi for alloy P, alloy B, and alloy ES are calculated to be 0 and 0.02 at%, 0.76 and 0.34 at%, and 0.80 and 0.87 at%, respectively. σ is the same as σ
y given in
Table 3. Substituting these values into
eq. (4), we obtained σ
0 = 21 MPa,
kMg = 3.8 MPa/at%
1/2, and
kSi = 40 MPa/at%
1/2.
Table 4 shows the chemical compositions and yield strength of standard 1XXX alloys.10) Chemical compositions without Mg and Si are almost the same as the ones of alloy P, alloy B, and alloy ES. The calculated strength σ0, 21 MPa, is among the values in Table 4. Therefore, eq. (4) is valid because the calculated value of σ0 is in good agreement with the yield strength of pure aluminum.

Table 4 Alloy compositions and yield strength.
Figure 3 shows the relationship between yield strength and solute Mg concentration to 1/2 in 5052 and 5182 alloys obtained in this study and in the literature.11) They are fit in a straight line. kMg, 38 ± 3 MPa/at%1/2, was obtained from the slope of this line and was 10 times larger than the above calculated value, 3.8 MPa/at%1/2. On the other hand, the yield strength from the solute Si atom in the Al–Si alloy was estimated to be less than the one from the solute Mg atom.12) Our study shows that the former is higher than the latter. Therefore, it was suggested that the yield strength in the supersaturated Al–Mg–Si alloy is not expressed as a linear combination of the strengths due to solute Mg and Si atoms.
There are two possible reasons why the above linear combination does not apply for these alloys.
One plausible reason is that the yield strength contributed by one solute atom is not proportional to its atom concentration to 1/2 owing to the interaction between the strain field around solute Mg atoms and the one around solute Si atoms. In the Al–Mg alloy, the strain field around solute Mg atoms could not overlap each other until their concentration is less than 15 at%.1) In the Al–Si alloy, the strain field around Si atoms could not overlap each other until their concentration is less than 1.0 at%.1) In the Al–Mg–Si alloys in this study, the concentration of solute Mg atoms and solute Si atoms are 0.80 at% and 0.87 at%, respectively. Thus, it was expected that a linear combination of yield strength due to solute atoms would apply because the strain fields around one solute atom would not overlap the one around it. However, in alloys with several kinds of solute atoms, a study to verify such a linear combination of yield strength due to the solute atom if the strain field around one solute atom overlaps that around the other kind of solute atom, has not yet been conducted. The radius of solute Mg atom is higher than the one of Al by 11%. On the other hand, the radius of solute Si atoms is smaller than the one of Al by 7%.13) Therefore, if atoms with radius higher than Al and atoms with radius smaller than Al would coexist, the yield strength could not be expressed as a linear combination. In fact, it was found that there was an interaction between Cu atoms and Si atoms in Fe(BCC), where the radius of Cu atoms and that of Si atoms are larger and smaller than the one of Fe.14)
The other reason is attributed to the effect of quench-in-vacancy. The complexes of vacancy-solute Mg atoms and the ones of vacancy-solute Si atoms were observed in Al–Mg–Si alloys immediately after the heat treatment of the solution.15) Furthermore, in the Al–Si alloy, the yield strength was increased when vacancy-Si atom complexes existed.12) Thus, in supersaturated Al–Mg–Si alloys, vacancy-Si complexes could form and consequently the strength was increased because such complexes suppressed dislocation motion. However, the effect of such vacancy-atom complexes on yield strength would not be significant. Therefore, we consider that the above differences in yield strength are due to the interaction between the two kinds of solute atoms, that is, the interaction caused by the difference in atomic size. In this study, we could not realize the reason why a linear combination in yield strength due to their atoms does not apply.
3.3 Work hardening
Figure 4 shows the Kocks–Mecking plots in alloy P, alloy B, and alloy ES. Figure 5 shows the corresponding plots in 5052 and 5182 alloys. In the plots of the low-strain region of all alloys, linear relationships were observed between dσD/dε and σD.
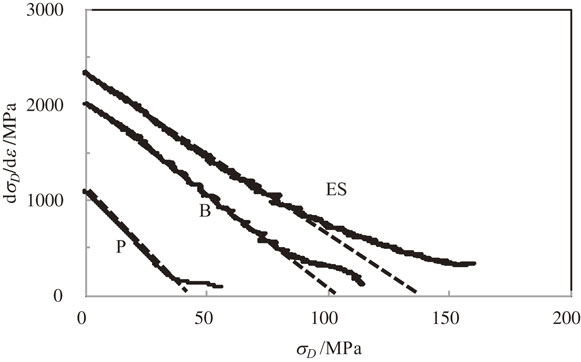

Figure 6 shows the relationship between the intercepts of the straight lines obtained from Figs. 4 and 5 and the sum of solute Mg and Si concentrations. Figure 7 shows the relationship between the slopes of these lines and the sum of solute Mg and Si concentrations. Vertical values in Fig. 6 depend on k1, which indicates the amount of dislocation storage, and the ones in Fig. 7 depend on k2, which indicates the amount of dynamic recovery. Solid curves in both figures were drawn on the assumption that k1 and k2 could depend on the sum of concentrations of both solute atoms, that is, hardening and dynamic recovery could be expressed as a linear combination of contributions from such a sum of concentrations. In the Al–Mg and Al–Cu alloys, with increasing solute concentration, k1 increased and then saturated and k2 decreased.7) These findings are in good agreement with this study. Furthermore, the relationship between k1 and solute Mg concentration in the Al–Mg alloy is the same as the relationship between k1 and the sum of solute Mg and Si concentrations in the Al–Mg–Si alloy. Thus, difference between the dependence of concentration of both solute atoms on k1 and on k2 is small. These findings suggest that in the low-strain region, the influence of solute Mg concentration on the storage and the recovery is the same as the one of solute Si concentration. Also, it was suggested that k1 and k2 could be expressed as a function of the sum of concentrations of solute atoms. Accordingly, it was found that the effect of several kinds of solute atoms on the yield strength is different from that on the hardening and dynamic recovery.

The radii of Mg and Si in Al are higher and smaller considerably than the one of Al, respectively. Then, Al lattice around solute Mg atoms and the one around solute Si atoms are affected by elastic compression stress and elastic expanded stress, respectively.1) This suggests that the dislocation storage and its dynamic recovery owing to solute atoms will not strongly depend on the kinds of strain fields around solute atoms as already found in the literature,7) although the result obtained in this study was not clearly understood.
On the other hand, the deviation from the straight-line drawn in the low-strain region in the Kocks–Mecking plot can be seen in the high-strain region, where the slope decreased with stress. Based on eq. (3), the decrease in the slope means a decrease in the magnitude of k2, that is, a decrease in dynamic recovery.
The values of stress σD at which such a deviation from the Kocks–Mecking plot occurred in alloy B and alloy ES were approximately 90 MPa, as can be seen in Fig. 4, and were higher than the one in alloy P, 35 MPa. The vertical value dσD/dε at which such a deviation occurred in alloy ES was higher than the one in alloys B and P, and the one in alloy B was higher than the one in alloy P. Based on eq. (1), such an increase in the stress indicates that dislocation substructure was forming and developing into a stable one in the higher-strain region, that is, the higher dislocation density region in alloys ES and B than in alloy P. This result suggests that plastic instability commenced in the higher-strain region in alloys ES and B than in alloy P. It also accounts for the increase in strength and elongation with solute Mg and Si atoms as can be seen in Figs. 1 and 2. In Fig. 5, the deviation from the straight line in the Kocks–Mecking plot for the 5182 alloy occurred at approximately 130 MPa and was higher than the one in 5052 alloy, 90 MPa. Furthermore, the hardening rate, dσD/dε, at which such a deviation occurred in 5182 alloy was higher than the one in 5052 alloy. Mg concentration is higher in 5182 alloy than in 5052 alloy. Thus, the development of dislocation substructure was retarded and shifted to the high-strain region, that is, high dislocation density region with increasing solute Mg concentration. Waldron and co-workers performed a TEM observation and found that with Mg concentration the evolution of dislocation cell structure was retarded and then the homogeneous distribution of dislocation tangles was formed.16) The present study is in good agreement with their findings qualitatively. Incidentally, the strain where the above deviation from the straight line in the Kocks–Mecking plot occurred was higher than the strain at which the strain rate in tensile test, 1 mm/min, was changed to 10 mm/min. Hence, there was no influence of strain rate on stress–strain curves.
4. Conclusion
To verify the yield strengthening and the work hardening contribution from solute Mg and Si atoms, tensile tests with supersaturated Al–Mg–Si alloys with different concentrations of constituent elements were performed, and the following findings were obtained:
-
(1)
The yield strength cannot be expressed as a linear combination of solute atoms. Although the reason could not be clearly understood in this study, this is considered to be due to the interaction between solute Mg atoms and solute Si atoms or the effect of the vacancy-solute atom complexes on dislocation motion.
-
(2)
In the low-strain region, the Kocks–Mecking model is valid and the storage and dynamic recovery of dislocation can be expressed as a linear combination of solute Mg and Si atoms.
-
(3)
In the high-strain region, the Kocks–Mecking model is no longer valid. The reason is considered to be the dislocation rearrangement suppressed by solute atoms. It is known that dislocations are distributed homogeneously. It is suggested that the dislocation density at which such a rearrangement occurs, increases with increasing solute atom concentration.
Acknowledgments
The authors would like to thank the UACJ Corporation for preparing the alloys used in this study.
REFERENCES
- 1) H.W. King: J. Mater. Sci. 1 (1966) 79–90.
- 2) J. Friedel: Dislocations, (Pergamon Press, Oxford-London, 1964) pp. 389–393.
- 3) G.I. Taylor: Proc. R. Soc. London, Ser. A 145 (1934) 362–387.
- 4) H. Mecking and U.F. Kocks: Acta Metall. 29 (1981) 1865–1875.
- 5) U.F. Kocks and H. Mecking: Prog. Mater. Sci. 48 (2003) 171–273.
- 6) D.J. Lloyd: Mater. Sci. Forum 519–521 (2006) 55–62.
- 7) N.Yu. Zolotorevsky, A.N. Solonin, A.Yu. Churyumov and V.S. Zolotorevsky: Mater. Sci. Eng. A 502 (2009) 111–117.
- 8) J. Da Costa Teixeria, Y. Brehet, Y. Estrin and C. Hutchinson: Proc. of 12th International Conference on Aluminum Alloys, Yokohama, Japan, (2010) pp. 536–541.
- 9) O.R. Myhr, Ø. Grong and S.J. Andersen: Acta Mater. 49 (2001) 65–75.
- 10) Japan Aluminium Association: Aluminium Handbook (in Japanese), 7th ed., (Japan Aluminium Association, Tokyo, 2007) pp. 243, 252, 271.
- 11) K.L. Kendig and D.B. Miracle: Acta Mater. 50 (2002) 4165–4175.
- 12) Q. Zhao and B. Holmedal: Mater. Sci. Eng. A 563 (2013) 147–151.
- 13) C. Kittel: Introduction to Solid State Physics, 7th ed., (John Wiley & Sons Inc., New York, 1996) p. 78.
- 14) H. Sueyoshi, Y. Fukutamura, T. Tsuchiyama and S. Takaki: CAMP-ISIJ 16 (2003) 1521.
- 15) B. Klobes, T.E. Staab, M. Haaks, K. Maier and I. Wieler: Phys. Status Solidi 2 (2008) 224–226.
- 16) G.W.J. Waldron: Acta Metall. 13 (1965) 897–906.


