Abstract
In the present study, a newly established in situ indentation technique by the use of an optically transparent indenter and an immersion liquid, so-called “modified optical indentation microscopy”, was applied for an investigation on the plastic deformation behavior of various samples during indentation. In this technique, the gap between the indenter and the specimen surface is filled with the immersion liquid such as silicone oil and kerosene to widely observe the specimen surface during indentation. In the in situ observations by this technique using polycrystalline pure Mg, the occurrence of various plastic deformation mechanisms and the increase of the anisotropic contact area during indentation can be recognized. Moreover, the increase and the decrease of the contact area which is corresponding to superelasticity during indentation were observed by this technique using the TiNi superelastic alloy. The results of the in situ observations were consistent with the analysis results based on the Hertz theory.
1. Introduction
Indentation is a suitable technique for simultaneous measurement of various mechanical properties using small specimens. To more accurately measure the mechanical properties using indentation, it is necessary to accurately determine indentation parameters such as the penetration depth, the applied load, and the contact area during indentation. Moreover, for understanding deformation behaviors during indentation, it is valuable to clarify the relationship between above indentation parameters and various deformation traces associated with the deformation such as slip traces, twins, sink-in, and pile-up. However, it is difficult to clarify the above relationship by the conventional ex situ indentation techniques. Unloading may result in the disappearance of deformation traces or in some case additional deformation caused by back stress. Therefore, it is necessary to establish an in situ indentation technique which enables simultaneous observation of the above deformation traces and the indentation parameters.
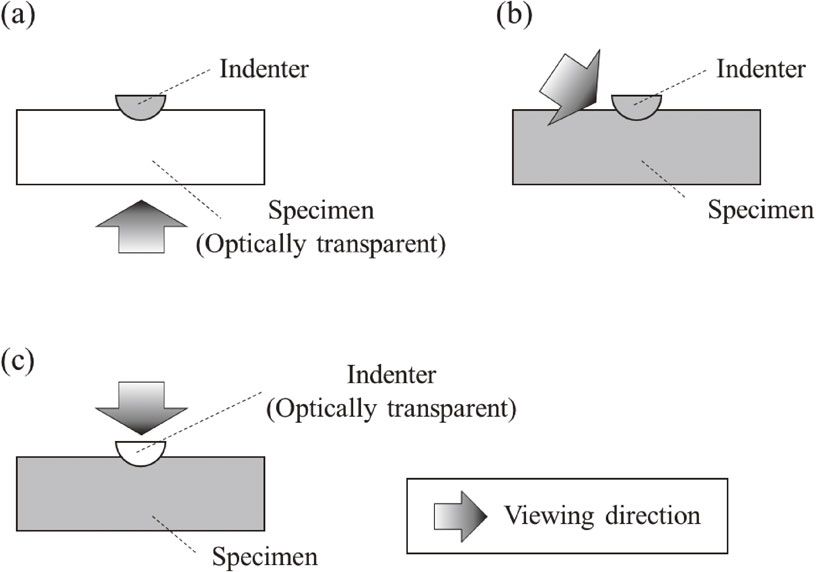
Various in situ indentation techniques have been proposed previously.1–14) These techniques can be classified into three groups (Fig. 1).
-
(a)
In situ indentation by the use of optically transparent specimens (Fig. 1(a)).1–4)
-
(b)
In situ indentation with the viewing directions inclined from the specimen surface (Fig. 1(b)).5–7)
-
(c)
In situ indentation by the use of optically transparent indenters (Fig. 1(c)).8–14)
The techniques (a) enable the wider observation of the deformation and the fracture behavior, however, these can be applied only on optically transparent materials. In the techniques (b), high-resolution observation of the deformation behavior around the contact area can be attained by using various electron microscopy. Nevertheless, the contact area is hardly determined and the observable region around the contact area is quite limited. By contrast, the techniques (c) can be applied not only optically transparent materials but also various materials. Moreover, these techniques enable simultaneous observation of the deformation behavior on the non-contact surface with various indentation parameters such as the penetration depth, the applied load, and the contact area during indentation. In the
in situ indentation techniques by the use of the optically transparent indenter, incident rays may undergo the refraction and the total reflection at the indenter/air interface because a refractive index of the indenter is significantly different from that of air. The refraction of the incident rays causes a distortion of observed
in situ images, and the total reflection of that causes an invisible area. For the above reason, the visible area of the specimen surface around the contact area is quite limited in the
in situ indentation technique by the use of optically transparent indenters proposed by Miyajima
et al.8,9) and Feng
et al.10,11) Maslenikov
et al.12) proposed a new indenter shape for controlling incident ray paths, resulting in avoiding the distortion of observed
in situ images attributed to the refraction of the rays. However, in their technique, the total reflection at the indenter/air interface can not be avoided except for using the indenter with a particular shape. We newly established an
in situ indentation technique, so-called “modified optical indentation microscopy (OIM)” which enables minimizing both the refraction and the total reflection at the indenter surface.
14) In modified OIM, the gap between the indenter and the specimen surface is filled with an immersion liquid with a refractive index close to that of the indenter to decrease the difference of these refractive indices.
In this study, in situ observations of the deformation behavior in various materials were conducted using modified OIM. By the use of various observable indentation parameters obtained by those tests, the deformation behavior was discussed based on the Hertz theory for the elastic contact of solids. In modified OIM in this study, the hemispherical indenters (Brinell indentation) were employed because of its symmetrical indenter shape.
2. Experimental Procedures
2.1 Modified optical indentation microscopy
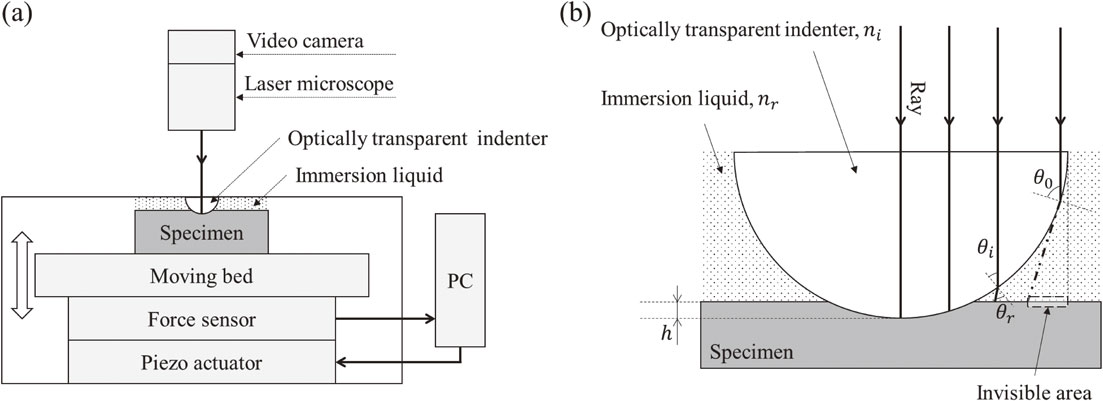
Schematics of (a) the modified OIM setup and (b) the ray paths during testing are shown in Fig. 2. The detail of the optical model of modified OIM is described in the previous study.14) During in situ indentation using the optically transparent indenter, incident rays may undergo the refraction and the total reflection at the surface of the optically transparent indenter. According to Snell’s law, the relationships among the incident angle θi, the refracted angle θr, the critical angle θ0, the refractive index of the optically transparent indenter ni, and that of immersion liquid nr are expressed as:
| \begin{equation}
\sin\theta_{i} = \frac{n_{r}}{n_{i}} \times \sin\theta_{r},
\end{equation}
| (1) |
| \begin{equation}
\sin\theta_{0} = \frac{n_{r}}{n_{i}}.
\end{equation}
| (2) |
Based on
eqs. (1) and
(2), it is suitable for the
in situ indentation technique using the optically transparent indenter that refractive index ratio
nr/
ni is close to unity because that leads less difference between θ
i and θ
r, and θ
0 close to 90°. For these reasons, sapphire (
ni = 1.77, Vickers hardness: 2000 HV
15,16)) and silica glass (
ni = 1.46, Vickers hardness: 1200 HV
17,18)) were selected as the materials for the optically transparent indenter. The detail discussion why they were used in modified OIM is written in our previous study.
14) Moreover, silicone oil (
nr = 1.51) and kerosene (
nr = 1.43) were selected as the immersion liquid. The immersion liquid was kept in the gap between the indenter and the specimen surface by surface tension during modified OIM.
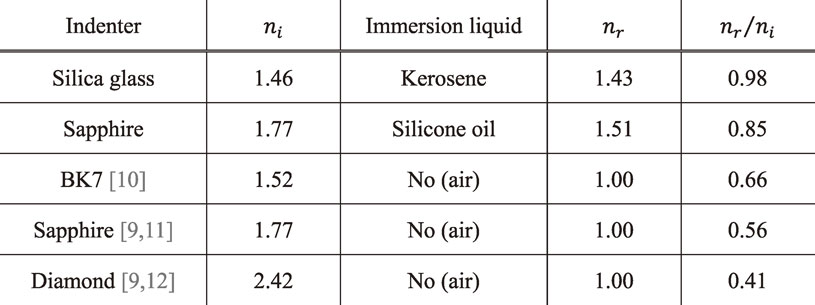
Table 1 lists the combinations of the optically transparent indenter and immersion liquid in this study and the previous studies.
9–12) The refractive index ratios
nr/
ni in this study are closer to unity than that in previous studies (
nr/
ni = 0.66, 0.56 and 0.41). Therefore, the specimen surface around the contact area during indentation can be observed by modified OIM.
2.2 Materials and test conditions
2.2.1 Polycrystalline pure Mg
In this study, polycrystalline pure Mg was selected as a sample because various plastic deformation mechanisms such as slip deformation and twinning occur in this sample. Using high-purity Mg (99.97%), polycrystalline pure Mg ingots were prepared in a high-purity graphite crucible by induction melting under an Ar atmosphere, followed by casting in an iron mold. Pure Mg specimens with a thickness of 4 mm were mechanically polished using emery papers and colloidal silica (particle size: 0.04 µm), and etched using C2H5OH–4% HCl. Pure Mg specimens were sealed in glass tubes filled with Ar gas and annealed at 773 K for 2 h, followed by quenching. In modified OIM for pure Mg at room temperature, sapphire-silicone oil (nr/ni = 0.85, an indenter radius R = 500 µm) was selected as the indenter-immersion liquid combination. The penetration rate of the indenter was 1 µm/s and the maximum applied load was 9.8 N. Slip trace analyses were conducted based on optical microscopy and field emission scanning electron microscopy (FE-SEM; JEOL JSM 6500F) equipped with electron backscatter diffraction (EBSD) analysis of the specimen surface after modified OIM.
2.2.2 TiNi superelastic alloy
TiNi superelastic alloys were also selected as a sample in this study. 47.6 at%Ti–52.4 at%Ni alloy ingots were prepared from high-purity raw materials (99.99% Ti, 99.99% Ni) by arc-melting with a non-consumable tungsten electrode on a water-cooled copper hearth under an Ar atmosphere. The alloying content was confirmed by fluorescent X-ray analysis (JEOL JSX-3220Z). TiNi alloy specimens with a thickness of 4 mm were mechanically polished using emery papers and alumina slurry (particle size: 0.1 µm). TiNi alloy specimens were sealed in glass tubes filled with Ar gas and annealed at 673 K for 1 h, followed by quenching. In modified OIM for TiNi alloy at room temperature, silica glass-kerosene (nr/ni = 0.98, R = 500 µm) was selected as the indenter-immersion liquid combination. The penetration rate of the indenter was 1 µm/s and the maximum applied load was 49 N. To confirm the superelasticity of this alloy, compression tests using specimens with dimensions of 4 × 4 × 8 mm3 were also conducted at room temperature with a strain rate of $\dot{\varepsilon } = 2.0 \times 10^{ - 4}$ s−1.
3. Results and Discussion
3.1 Polycrystalline pure Mg
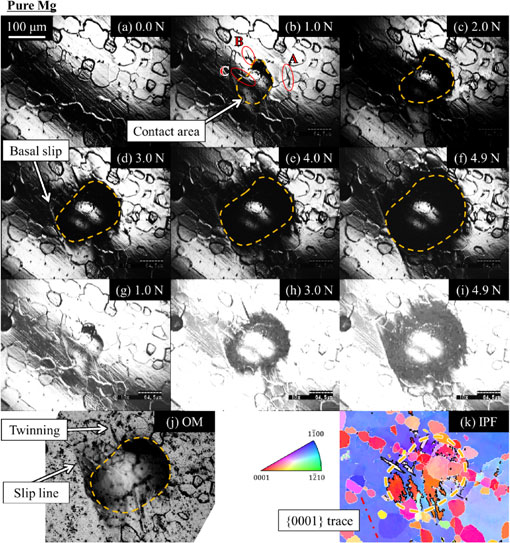
Figure 3 shows (a–f) in situ images, (g–i) in situ images after image processing using software (ImageJ ver. 1.45l), (j) an optical micrograph, and (k) EBSD results after testing on the polycrystalline pure Mg specimen. Image processing was conducted to clarify the edge of the contact area. In the inverse pole figure (Fig. 3(k)), the thick black boundaries indicate matrix/$\{ 10\bar{1}2\} $ twin boundaries. The increase of the contact area during the loading process was observed. As shown in Fig. 3, the shape of the contact area and the indent was distorted, although indenter was hemispherical. This is attributed to the plastic anisotropy of pure Mg.13,14,19–21) Moreover, it is observed that slip lines and mechanical twins were introduced during the loading process. The optical micrograph after testing also showed the occurrence of above plastic deformation mechanisms. By the EBSD analyses, it is confirmed that the occurred slip deformation mechanism was basal slip and the occurred twinning mechanism was $\{ 10\bar{1}2\} $ twin. Most of twins were introduced at the edge of the contact area, however, $\{ 10\bar{1}2\} $ twinning was also observed at the grain boundary far from the contact area (twin A in Fig. 3(b)). It is expected that this is attributed to the elastic stress field around the contact area generated by indenting. To discuss this phenomenon more detail, analyses of the deformation behavior using various numerical methods such as crystal plasticity finite element method should be carried out in future works.

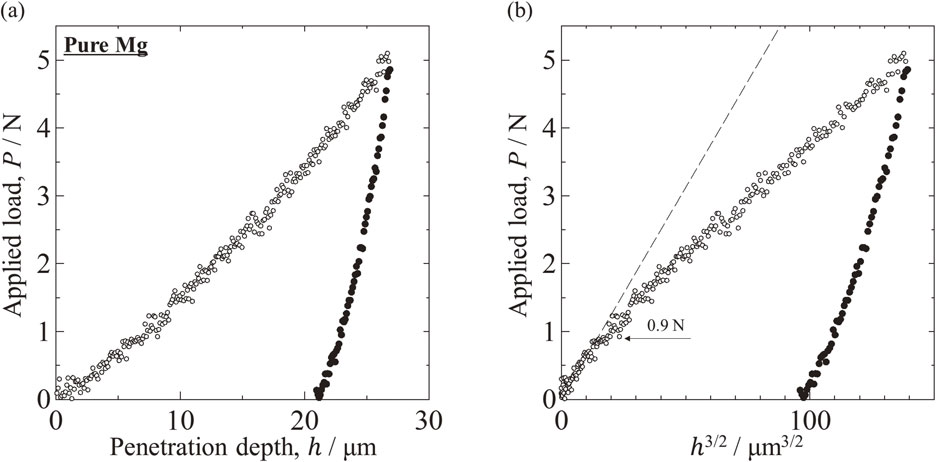
The load (P)-displacement (h) curve (P–h curve) obtained by modified OIM using the polycrystalline pure Mg specimen is shown in Fig. 4(a). According to the Hertz theory, in the elastic contact between the spherical indenter and the flat surface, the relationship between P and h can be described by:22)
| \begin{equation}
P = \frac{4}{3}R^{1/2}E^{*}h^{3/2},
\end{equation}
| (3) |
where
E* is the effective Young’s modulus of the indenter and the specimen system. According to
eq. (3),
P ∝
h3/2 if the plastic deformation does not occur. As shown in the
P–
h3/2 curve shown in
Fig. 4(b),
P is proportional to
h3/2 if
P is less than approximately 0.9 N. Consequently, it is expected that the plastic deformation occurred at approximately
P = 0.9 N. This result is consistent with the
in situ observations in which
$\{ 10\bar{1}2\} $ twins appear at the edge of the contact area with the applied load of 1.0 N (
Fig. 3(b)).
From the above results, it is found that modified OIM enables the in situ observations of the distorted contact area and the occurrence of various plastic deformation mechanisms. The analysis result of the P–h3/2 curve based on the Hertz theory is consistent with the in situ images, and thus it is concluded that the plastic deformation behavior during indentation can be clarified by this technique. It is expected that combining in situ observations and numerical analyses such as finite element method contributes to further understanding of the deformation behavior during indentation.
3.2 TiNi superelastic alloy
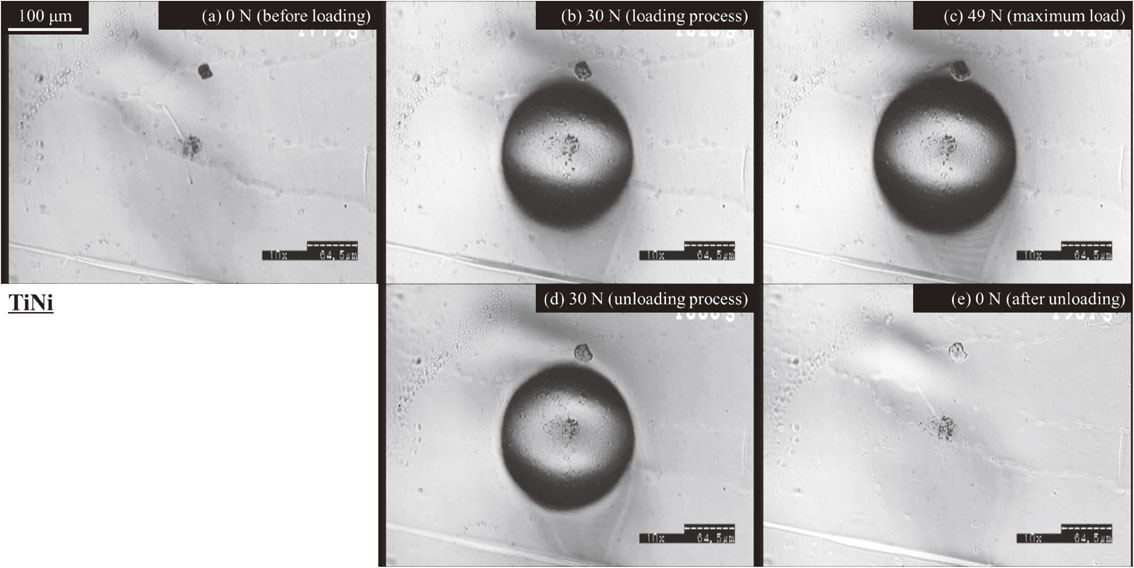
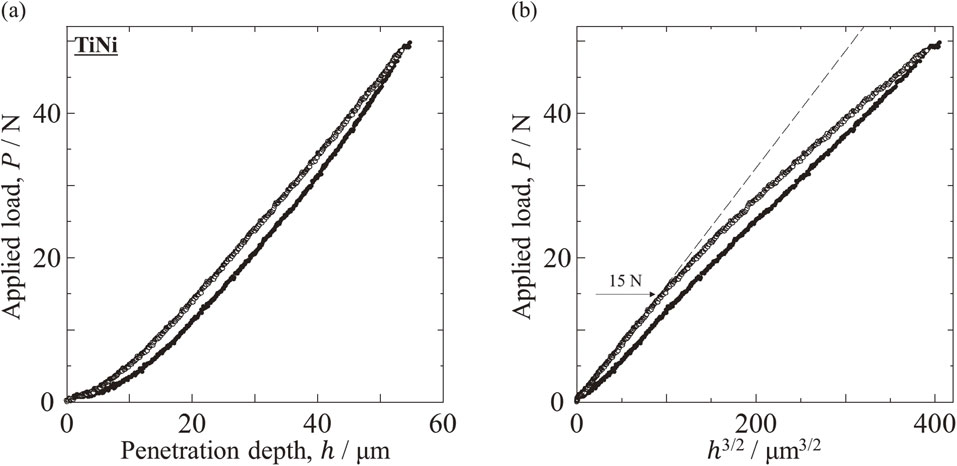
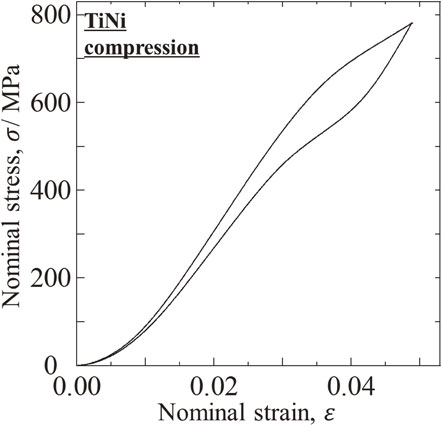
Figure 5 shows the nominal stress-strain curve obtained by the compression test. The nominal strain was calculated from the initial dimension of specimens and the cross-head displacement. As shown in this figure, the superelasticity of this TiNi alloy at room temperature was confirmed. Figure 6 shows in situ images during (a–c) the loading and (d–e) the unloading process of the TiNi superelastic alloy specimen. Both the increase of the contact area during the loading process and the decrease of that during the unloading process were observed. These results correspond to the superelastic behavior of this alloy. The contact area (the indent area) of the superelastic alloys can not be estimated by the conventional ex situ indentation technique because the contact area disappears during the unloading process. In contrast, the relationship between the in situ contact area and the applied load P during indentation using superelastic alloys can be determined without any ambiguous assumptions by modified OIM. Figure 7 shows (a) the P–h curve and (b) the P–h3/2 curve of the TiNi alloy. As shown in Fig. 7, the P–h curve demonstrates superelasticity with a hysteresis loop. This is the typical curve obtained by indentation using the hemispherical indenter of superelastic alloys,23) and consistent with the in situ images shown in Fig. 6. From the P–h3/2 curve, it is confirmed that P is proportional to h3/2 if P is less than approximately 15 N. Consequently, it is expected that the superelastic deformation occurred at approximately P = 15 N (eq. (3)).
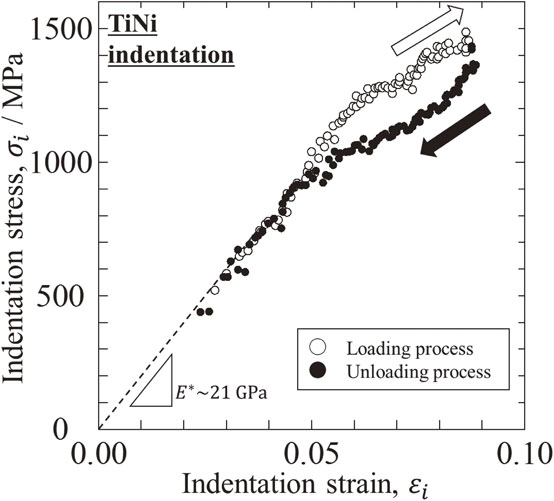
The in situ contact area can be evaluated by modified OIM. Because the shape of the contact area of the TiNi alloy is almost circular, the in situ contact radius can be calculated using the in situ contact area. Thus, the relationship between the applied load P, the contact radius r can be determined. Indentation stress σi and indentation strain εi during spherical indentation are expressed as:22,24)
| \begin{equation}
\sigma_{i} = \frac{P}{\pi r^{2}},
\end{equation}
| (4) |
| \begin{equation}
\varepsilon_{i} = \frac{4}{3\pi}\frac{r}{R}.
\end{equation}
| (5) |
The indentation stress-strain curve evaluated from the observable indentation parameters is shown in
Fig. 8. The indentation stress-strain curve shows the obvious hysteresis loop during the loading and unloading processes. The effective Young’s modulus is estimated as
E* = 21 GPa from this curve. By the use of the Young’s modulus and the Poisson’s ratio of the indenter (silica glass) and the TiNi alloy (
Ei = 76.4 GPa, υ
i = 0.17,
ETiNi and υ
TiNi = 0.30
18,25)), the effective Young’s modulus
E* is expressed as:
22,24)
| \begin{equation}
\frac{1}{E^{*}} = \frac{1 - \upsilon_{\text{TiNi}}^{2}}{E_{\text{TiNi}}} + \frac{1 - \upsilon_{i}^{2}}{E_{i}}.
\end{equation}
| (6) |
Accordion to
eq. (6),
ETiNi is evaluated as 26.1 GPa. Because
Ei is approximately 3 times higher than
ETiNi, it is considered that the influence of the elastic deformation of the indenter was negligibly small. The yield stresses (0.2% flow stresses) estimated using stress-strain curves of the indentation test (
Fig. 8) and the compression test (
Fig. 5) were 1206 MPa and 648 MPa, respectively. Sakai
et al. pointed out that the yield stress estimated from the indentation tests depends on the radius of the spherical indenter, and is generally higher than that estimated from the compression tests.
26) As mentioned above, the superelastic deformation occurred at approximately
P = 15 N. According to
eq. (4), the applied load
P of 15 N in this test is corresponding to the indentation stress σ
i of 1145 MPa, and this σ
i is consistent with the yield stresses estimated from the indentation test.
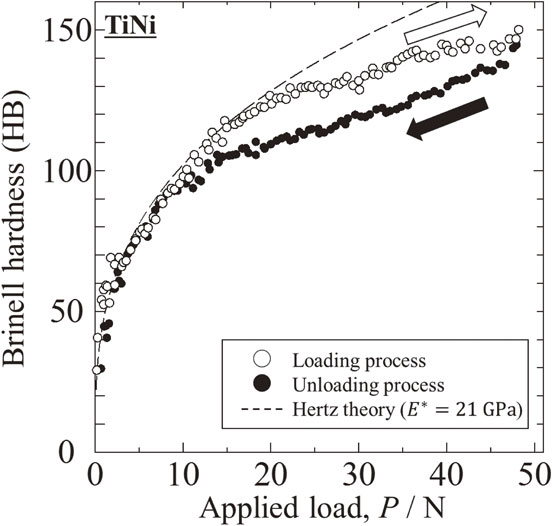
Figure 9 shows the relationship between Brinell hardness HB and the applied load
P. Note that the contact radii
r which were used to evaluate Brinell hardness were determined from
in situ images, therefore, they were contributed to both the superelastic and the elastic deformation. The dashed line is calculated using the contact radii
r estimated based on the Hertz theory (
E* = 21 GPa) which is expressed as:
9)
| \begin{equation}
2r = \left(\frac{6R}{E^{*}}\right)^{1/3}P^{1/3}.
\end{equation}
| (7) |
Brinell hardness during the loading process is obviously different from that during the unloading process because of the superelastic behavior. Moreover, it is recognized that the experimental results during the loading process fall below the Hertz theory indicated by the dashed line at the applied load of approximately
P = 15 N. Consequently, it is expected that the superelastic deformation occurred at approximately
P = 15 N. This result is consistent with the result of the
P–
h3/2 curve shown in
Fig. 7(b).
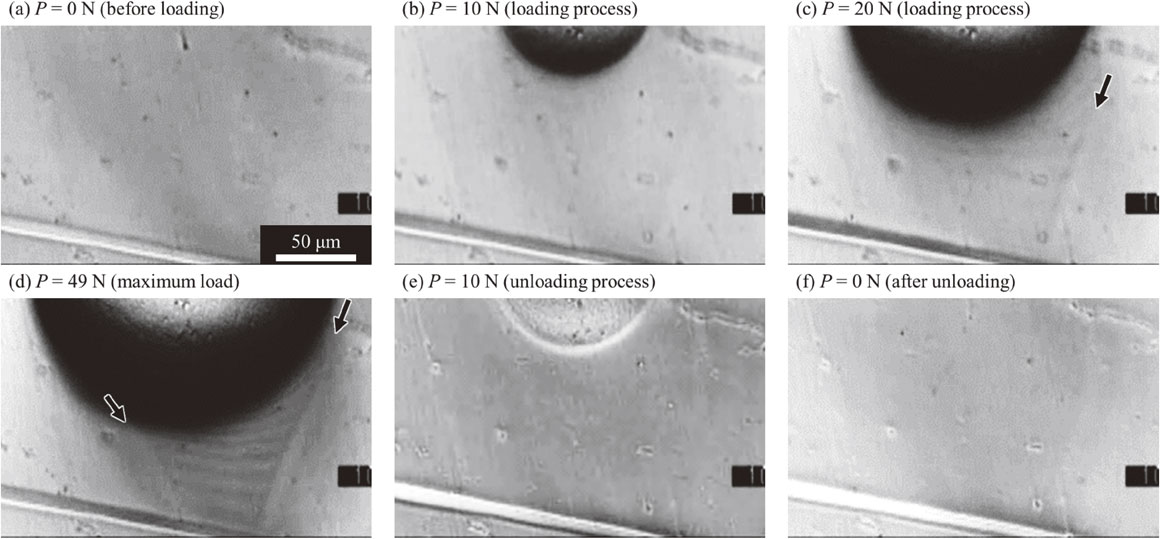
The deformation behavior during indentation of the TiNi alloy will be discussed in terms of the in situ images and various observable indentation parameters obtained from modified OIM. The magnified in situ images of the TiNi alloy specimen with various applied loads P during the loading and unloading process are shown in Fig. 10. The specimen surface was flat before loading (P = 0 N, Fig. 10(a)) and during the initial stage of loading process (P = 10 N, Fig. 10(b)). By contrast, it is recognized that the surface relief, which is indicated by the black arrows in the figures, appeared during the latter stage of loading (P = 20 N, Fig. 10(c)), and that expanded with increasing the applied load (P = 49 N, Fig. 10(d)). The surface relief disappeared during the unloading process (P = 10 N, Fig. 10(e)). The applied load which the surface relief appeared is consistent with superelastic deformation region in the P–h3/2 curve (Fig. 7(b)) and HB-P curve (Fig. 9). For these reasons, it is concluded that this surface relief was caused by the shear strain introduced due to the stress-induced martensitic transformation.
From the above results, it is concluded that modified OIM enables the in situ observations of the increase and the decrease of the contact area, resulting in the determination of Brinell hardness of the superelastic alloys. Moreover, the surface relief attributed to the stress-induced martensitic transformation was observed. The indentation stress-strain curve which is obtained using various observable indentation parameters demonstrated the obvious superelastic behavior with a hysteresis loop. The results of the in situ observations were consistent with the analysis results based on the Hertz theory. Therefore, it is expected that this technique contributes to the characterization and understanding the deformation behavior of the superelastic alloys.
4. Conclusions
The in situ observations of the deformation behavior in polycrystalline pure Mg and the TiNi superelastic alloy during indentation using the hemispherical indenter were conducted using modified OIM.
-
(1)
The occurrence of various plastic deformation mechanisms such as slip deformation and twinning, and the increase of the anisotropic contact area during indentation can be observed by modified OIM using the polycrystalline pure Mg. Therefore, it is concluded that the relationship between the above observations and the indentation parameters can be clarified by this technique.
-
(2)
The increase and the decrease of the contact area which is corresponding to superelasticity during indentation can be observed by modified OIM using the TiNi alloy. Moreover, the indentation stress-strain curve demonstrated the obvious superelastic behavior with a hysteresis loop. The stress-induced martensitic transformation during indentation was observed, and this result was consistent with the analysis results based on the Hertz theory.
Acknowledgments
This work was partially supported by the Amada Foundation.
REFERENCES
- 1) S. Yoshida, M. Kato, A. Yokota, S. Sasaki, A. Yamada, J. Matsuoka, N. Soga and C.R. Kurkjian: J. Mater. Res. 30 (2015) 2291–2299.
- 2) M. Sakai and Y. Nakano: J. Mater. Res. 17 (2002) 2161–2173.
- 3) R.F. Cook and G.M. Pharr: J. Am. Ceram. Soc. 73 (1990) 787–817.
- 4) D.J. Morris and R.F. Cook: J. Am. Ceram. Soc. 87 (2004) 1494–1501.
- 5) G. Laplanche, J. Pfetzing-Micklich and G. Eggeler: Acta Mater. 78 (2014) 144–160.
- 6) J.K. Deuschle, G. Buerki, H.M. Deuschle, S. Enders, J. Michler and E. Arzt: Acta Mater. 56 (2008) 4390–4401.
- 7) J. Michler, R. Rabe, J.L. Bucaille, B. Moser, P. Schwaller and J.M. Breguet: Wear 259 (2005) 18–26.
- 8) M. Sakai, N. Hakiri and T. Miyajima: J. Mater. Res. 21 (2006) 2298–2303.
- 9) T. Miyajima and M. Sakai: Philos. Mag. 86 (2006) 5729–5737.
- 10) C. Feng and B.S. Kang: Exp. Mech. 46 (2006) 91–103.
- 11) C. Feng and B.S. Kang: Exp. Mech. 48 (2008) 9–15.
- 12) I.I. Maslenikov, V.N. Reshetov, A.S. Useinov and M.A. Doronin: Instrum. Exp. Tech. 61 (2018) 719–724.
- 13) T. Mineta, S. Miura, K. Oka and T. Miyajima: J. Japan Inst. Met. Mater. 81 (2017) 196–205.
- 14) T. Mineta, S. Miura, K. Oka and T. Miyajima: Mater. Trans. 59 (2018) 602–611.
- 15) S. Kobayashi, S. Masui and S. Miura: J. Soc. Mater. Sci., Japan 51 (2002) 780–787.
- 16) P.J. Burnett and T.F. Page: J. Mater. Sci. 19 (1984) 3524–3545.
- 17) K. Oda and T. Yoshio: J. Ceram. Soc. Jpn. 97 (1989) 1493–1497.
- 18) T. Adachi and S. Sakka: J. Mater. Sci. 25 (1990) 4732–4737.
- 19) T. Mineta and S. Miura: MRS Proc. 1741 (2015) 47–52.
- 20) T. Mineta, S. Miura, T. Mukai, M. Ueda and T. Mohri: J. Japan Inst. Met. Mater. 77 (2013) 466–472.
- 21) T. Mineta and H. Sato: Mater. Sci. Eng. A 735 (2018) 418–422.
- 22) S.R. Kalidindi and S. Pathak: Acta Mater. 56 (2008) 3523–3532.
- 23) W. Yan, Q. Sun, X.Q. Feng and L. Qian: Int. J. Solids Struct. 44 (2007) 1–17.
- 24) B.R. Donohue, A. Ambrus and S.R. Kalidindi: Acta Mater. 60 (2012) 3943–3952.
- 25) T. Namazu, A. Hashizume and S. Inoue: Sens. Actuators A Phys. 139 (2007) 178–186.
- 26) M. Sakai and Y. Nakano: J. Mater. Res. 19 (2004) 228–236.