Abstract
The rate-controlling process of compound growth in the Cu-clad Al (CA) wire was metallographically examined in the temperature range of 483–543 K (210–270°C). CA wires were prepared by a wire drawing technique, and then isothermally annealed for various times up to 3.456 Ms (960 h) in this temperature range. During isothermal annealing, the α2, γ1, δ, η2 and θ phases form as layers at the original Cu/Al interface in the CA wire. However, at 483–513 K (210–240°C), the α2, γ1, δ and η2 phases could not be differentiated from one another in a metallographical manner. The layer of the θ phase is designated layer 1, and that of the α2, γ1, δ and η2 phases is called layer 2. The mean thickness of each layer increases in proportion to a power function of the annealing time. Such a relationship is called a power relationship. The exponent of the power relationship takes values between 0.22 and 0.36 for layer 1 and those between 0.39 and 0.50 for layer 2. The exponent smaller than 0.5 indicates that boundary diffusion as well as volume diffusion contributes to the layer growth. However, the contribution of boundary diffusion is more remarkable for layer 1 than for layer 2. The activation enthalpy for the proportionality coefficient of the power relationship was estimated to be 43 and 73 kJ/mol for layers 1 and 2, respectively. The former value is smaller than the latter value. This is attributed to the contribution of boundary diffusion being greater for layer 1 than for layer 2.
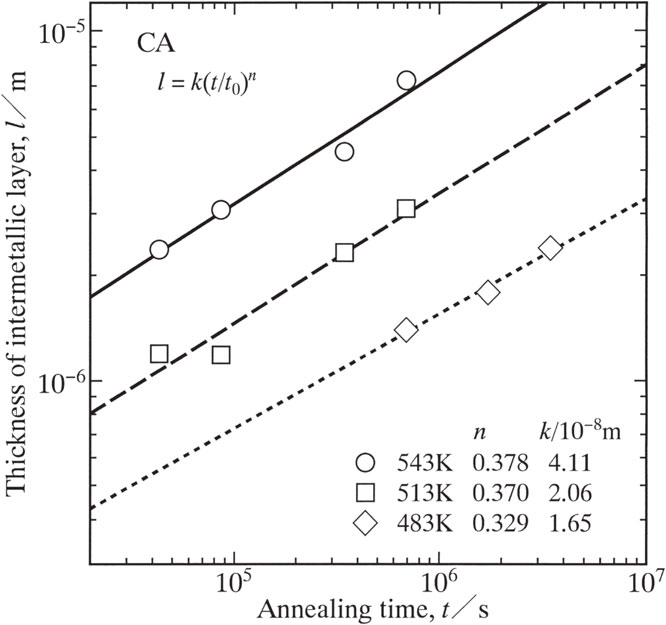
Fig. 3 The total thickness
l of the intermetallic layer versus the annealing time
t shown as open rhombuses, squares and circles for
T = 483, 513 and 543 K (210, 240 and 270°C), respectively. The values of
k and
n in eq. (2) were estimated by the least-squares method.
Fullsize Image

