MATERIALS TRANSACTIONS
Online ISSN : 1347-5320
Print ISSN : 1345-9678
ISSN-L : 1345-9678
Volume 61, Issue 1
Displaying 1-31 of 31 articles from this issue
Review
  • Hidetoshi Somekawa
    Article type: Review
    2020 Volume 61 Issue 1 Pages 1-13
    Published: January 01, 2020
    Released on J-STAGE: December 25, 2019
    Advance online publication: September 30, 2019
    JOURNAL FREE ACCESS FULL-TEXT HTML

    The development of magnesium alloys, which exhibit high strength and high ductility (fracture toughness), is critical for ensuring the safety and reliability in structural applications. It is well-known that grain refinement and/or alloying are impressive strategies to attain such properties in metallic materials. In the former case, grain boundaries of magnesium and its alloys have unique characteristics, e.g., sites for non-basal dislocation activity and occurrence of partial grain boundary sliding. As a result, strength as well as ductility (fracture toughness) tend to increase and improve with grain refinement. In the latter case, 29 types of solid solution elements, which have a maximum solubility of more than 0.1 at%, can dissolve in magnesium. Several elements are generally added to magnesium simultaneously to achieve good mechanical properties via a synergistic effect. In industrial fields, ternary magnesium alloys such as Mg–Al–Zn and Mg–Zn–Zr alloys, which have fine-grained structures, have been widely used; however, there is no still clear and systematic understanding of the impact of various alloying elements on properties for magnesium. In this paper, we review recent studies on the effect of solid solution alloying elements on ductility (fracture toughness), with focusing on polycrystalline binary magnesium alloys. With regard to the toughness, the crack-propagation behavior and/or fracture behavior are quite sensitive to the alloying element, regardless of grain size. Twin boundaries in particular are recognized as harmful defects, because they act as crack-propagation sites. Nevertheless, changing the electric bonding behavior through alloying has the potential to increase the toughness. As for the ductility, the alloying elements also dramatically affect the room-temperature plastic deformation. In addition to the activation of the non-basal dislocation slip, grain boundary sliding also plays a notable role in enhancing the elongation-to-failure in tension.


    This Paper was Originally Published in Japanese in J. Japan Inst. Met. Mater. 83 (2019) 65–75.

  • Hussein Zein, Yaser A. Al-Shataif
    Article type: Review
    2020 Volume 61 Issue 1 Pages 14-26
    Published: January 01, 2020
    Released on J-STAGE: December 25, 2019
    JOURNAL FREE ACCESS FULL-TEXT HTML

    This review is provided with a detailed overview of common reinforcement and inspection techniques for producing reinforced composite materials. This study focuses on the state of the art for how used carbon nanotubes (CNTs) as a reinforced material to obtain micro-composite and nano-composite materials. On the other hand, up to now, the major problem is to get a uniform dispersion of the CNTs in the wanted reinforced composite material. So, this review paper emphasizes on several techniques which are utilized for improving the dispersion of CNTs in a metallic powder, such as copper (Cu), aluminum (Al), and magnesium (Mg) as matrix composites. Furthermore, this review presents two different experimental techniques (destructive testing and non-destructive testing) with the purpose of detection of CNTs dispersion in the reinforced composite material. As a result, this review is a helpful tool for all scientists for deciding which technique is more suitable for their research composite materials.

Special Issue on New Aspects of Martensitic Transformations II
  • Mitsuhiro Matsuda, Ryo Matsuoka, Masatoshi Mitsuhara, Minoru Nishida
    Article type: Regular Article
    Subject area: Special Issue on New Aspects of Martensitic Transformations II
    2020 Volume 61 Issue 1 Pages 27-32
    Published: January 01, 2020
    Released on J-STAGE: December 25, 2019
    Advance online publication: September 24, 2019
    JOURNAL FREE ACCESS FULL-TEXT HTML

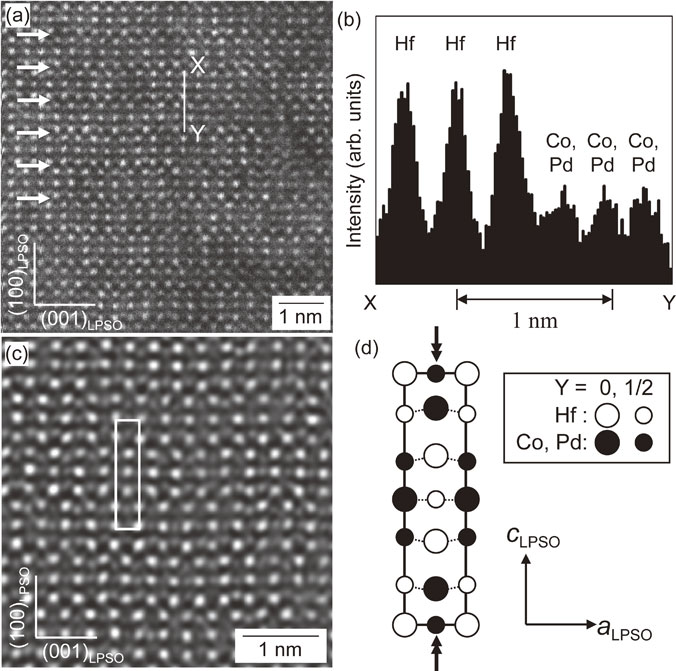
    Microstructural characterization of martensite with long period stacking order (LPSO) structure in a Hf–Co–Pd alloy was investigated by transmission electron microscopy (TEM) and high-angle annular dark-field scanning transmission electron microscopy (HAADF-STEM). LPSO structure with six stacking sequences; 6O (orthorhombic) (Space group: Immm), were newly discovered. Based on the electron diffraction experiments, the lattice parameters of LPSO phase were estimated to be a = 0.33 nm, b = 0.45 nm and c = 1.53 nm. The formation mechanism of martensite with LPSO structure and the crystallographic orientation relationship between parent B2 phase and 6O martensite are also discussed.

    Fig. 5 (a) A HAADF-STEM image taken along the [010]LPSO direction of an LPSO structure in a Hf–30.0 at% Co–20.0 at% Pd alloy. (b) Image intensity profile taken along the white-line X-Y in (a). (c) Fourier filter-processed HAADF-STEM image of LPSO structures. (d) Schematic illustration of the atomic arrangements in the white-framed areas in (c). Fullsize Image
  • Takashi Fukuda
    Article type: Regular Article
    Subject area: Special Issue on New Aspects of Martensitic Transformations II
    2020 Volume 61 Issue 1 Pages 33-36
    Published: January 01, 2020
    Released on J-STAGE: December 25, 2019
    Advance online publication: September 24, 2019
    JOURNAL FREE ACCESS FULL-TEXT HTML

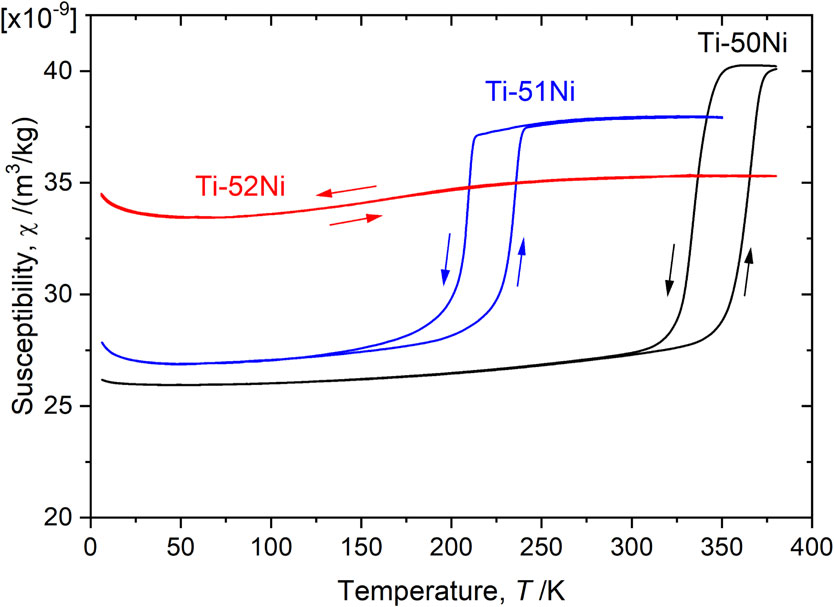
    The main phases (B2, R, B19, B19′ and Ti3Ni4) appearing in Ti–Ni-based shape memory alloys are band paramagnetism with magnetic susceptibility in the order of 10−8 m3/kg. All martensitic transformations in the cooling process (B2 → B19′, B2 → R, B2 → B19, R → B19′ and B19 → B19′) are associated with the decrease in magnetic susceptibility. This implies that all martensitic transformations in Ti–Ni-based shape memory alloys are associated with decrease in electronic density of states at Fermi energy. The change in magnetic susceptibility from the B2-phase is largest for the B2-B19′ transformation and smallest for the B2-R transformation.

    Fig. 1 Temperature dependence of magnetic susceptibility of solution treated Ti–50Ni, Ti–51Ni and Ti–52Ni alloys. Ti–50Ni and Ti–51Ni exhibit the B2 → B19′ transformation, while Ti–52Ni does not exhibit martensitic transformation. Fullsize Image
  • Hiroshi Akamine, Yohei Soejima, Tadaaki Nakamura, Farjami Sahar, Takas ...
    Article type: Regular Article
    Subject area: Special Issue on New Aspects of Martensitic Transformations II
    2020 Volume 61 Issue 1 Pages 37-41
    Published: January 01, 2020
    Released on J-STAGE: December 25, 2019
    Advance online publication: September 30, 2019
    JOURNAL FREE ACCESS FULL-TEXT HTML

    The time dependence nature of B2 (ordered cubic) to R (trigonal) and R to B19′ (monoclinic) martensitic transformations in an aged Ni-rich Ti–Ni alloy was investigated by electrical resistivity measurements. Both B2 to R and R to B19′ transformations exhibit time dependence nature in the aged alloy containing coherent lenticular Ti3Ni4 precipitates with an average diameter of about 110 nm. However, the successive B2-R-B19′ isothermal transformation is not detected by electrical resistivity measurements. The isothermal R-B19′ transformation is visualized by in situ scanning electron microscopy (SEM) observations.

  • Junya Inoue, Shuhei Komine, Ryo Misaki, Kenji Sekido
    Article type: Regular Article
    Subject area: Special Issue on New Aspects of Martensitic Transformations II
    2020 Volume 61 Issue 1 Pages 42-48
    Published: January 01, 2020
    Released on J-STAGE: December 25, 2019
    Advance online publication: October 04, 2019
    JOURNAL FREE ACCESS FULL-TEXT HTML

    Digital holographic microscope (DHM) system was designed to extend an existing reflected light microscope. The developed DHM system was applied for the observations of plastic deformation of an upper bainite and martensitic transformation of a low-carbon steel to clarify its potential for analyzing surface reliefs observed during these processes. It was demonstrated that the height measurement accuracy is almost equivalent to that of AFM. The exceptional temporal and spatial resolutions provided by the developed DHM system was shown to have a potential to clarify the mechanism behind the formation of surface reliefs by plastic deformation and phase transformation.

    Fig. 3 Reconstruction process of real image from holographic pattern. (a) Intensity obtained by CMOS camera, (b) Fourier transformed pattern, (c) filtered object beam, (d) object amplitude, (e) object phase shift, (f) unwrapped phase shift. Fullsize Image
  • Mitsuharu Todai, Takashi Fukuda, Tomoyuki Kakeshita
    Article type: Regular Article
    Subject area: Special Issue on New Aspects of Martensitic Transformations II
    2020 Volume 61 Issue 1 Pages 49-54
    Published: January 01, 2020
    Released on J-STAGE: December 25, 2019
    JOURNAL FREE ACCESS FULL-TEXT HTML

    We have studied the R-B19′ martensitic transformation behavior of Ti–(50−x)Ni–xFe (at%) alloys. The R-B19′ transformation start temperature (Ms) decreases from 234 K to 102 K as x increases from 2.0 to 3.7 at%. This transformation is suppressed in the alloy with x = 4.0 (4.0Fe alloy), although the equilibrium temperature is estimated to be 104 K. The estimated free energy difference at Ms (driving force) for the R-B19′ transformation increases as Ms decreases from 45 J/mol (Ms = 234 K) to 48 J/mol (Ms = 102 K). If we extrapolate this relation linearly, Ms of the 4.0Fe alloy is expected to be ∼50 K. Nevertheless, the R-B19′ transformation is completely suppressed in the 4.0Fe alloy. Presumably, insufficient thermal activation energy is the main reason for the suppression of the R-B19′ transformation in the 4.0Fe alloy.

    Fig. 7 Temperature dependence of free energy difference between the R-phase and the B19′ phase of Ti–(50−x)Ni–xFe alloys. The Ms(B19′) temperature of each alloy is indicated by solid circles. Fullsize Image
  • Toshihiro Omori, Shingo Kawata, Ryosuke Kainuma
    Article type: Regular Article
    Subject area: Special Issue on New Aspects of Martensitic Transformations II
    2020 Volume 61 Issue 1 Pages 55-60
    Published: January 01, 2020
    Released on J-STAGE: December 25, 2019
    Advance online publication: October 21, 2019
    JOURNAL FREE ACCESS FULL-TEXT HTML

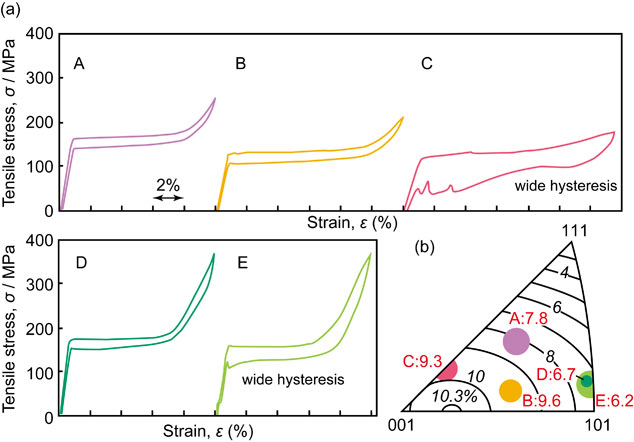
    Cu–Al–Mn single crystals with subgrains were prepared by cyclic heat treatment, and the orientation dependence of superelasticity was investigated using tensile tests, during which the microstructure of the martensite was observed in situ. The transformation strain result basically agrees with the calculation from the shape strain, but the value is lower than the calculation result and the stress hysteresis is abnormally wide in some samples. The stress-induced forward and reverse martensitic transformation takes place by a single variant in the sample with a normal hysteresis but by multiple variants in the sample with wide hysteresis. The wide hysteresis mainly results from an abnormally low stress for the reverse transformation, which is considered to be caused by competition between the variants. The results suggest that multi-variants can be induced when the loading direction is located on the sides of stereo-triangle, such as 〈001〉 to 〈101〉, 〈001〉 to 〈111〉, and 〈101〉 to 〈111〉, based on Schmid’s law.

  • Yuki Wada, Nobuo Nakada, Susumu Onaka
    Article type: Regular Article
    Subject area: Special Issue on New Aspects of Martensitic Transformations II
    2020 Volume 61 Issue 1 Pages 61-67
    Published: January 01, 2020
    Released on J-STAGE: December 25, 2019
    JOURNAL FREE ACCESS FULL-TEXT HTML

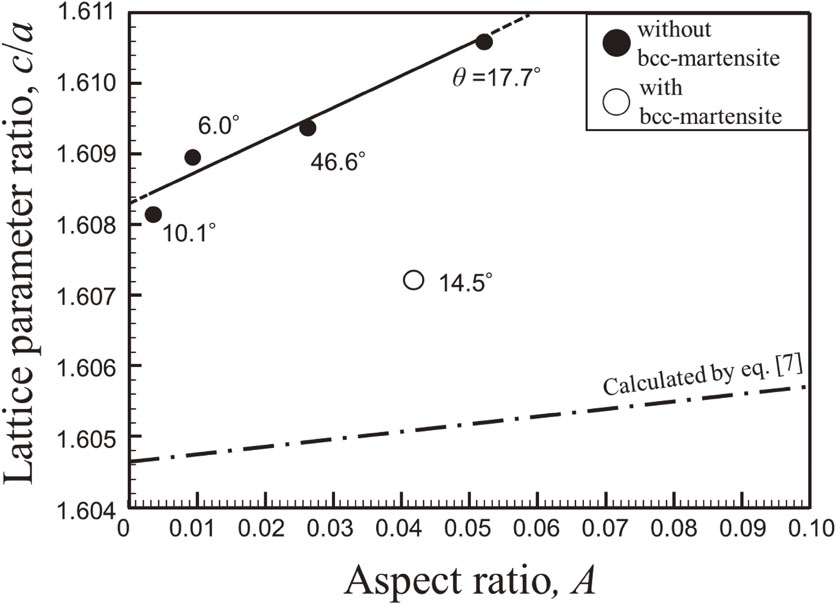
    Internal stress generated by athermal martensitic transformation from fcc (face-centered cubic) to hcp (hexagonal close-packed) was investigated in 18Cr–8Ni metastable austenitic stainless steel. Lattice parameter ratio of hcp-martensite, c/a, formed by subzero treatment was evaluated accurately by means of electron back scatter diffraction technique. The evaluation revealed that hcp-martensite surrounded by fcc-austenite matrix has obviously higher c/a compared with the reference value in the case when hcp-martensite exists in a single body, and the c/a is continuously increased with increasing the aspect ratio of the plate-shaped hcp-martensite. However, additional formation of martensite with bcc (body centered cubic) reduced the c/a of hcp-martensite suddenly. From the point of view of micromechanics, it can be concluded that internal stress is dynamically increased by the thickening of plate martensite on fcc-hcp martensitic transformation, and the subsequent hcp-bcc martensitic transformation is stimulated to accommodate the internal stress.

    Fig. 8 Change in c/a as a function of aspect ratio A in hcp-martensite. Fullsize Image
  • Hirobumi Tobe, Yuichi Matsuki, Shinsuke Takeuchi, Eiichi Sato
    Article type: Express Rapid Publication
    Subject area: Special Issue on New Aspects of Martensitic Transformations Ⅱ
    2020 Volume 61 Issue 1 Pages 68-71
    Published: January 01, 2020
    Released on J-STAGE: December 25, 2019
    Advance online publication: November 15, 2019
    JOURNAL FREE ACCESS FULL-TEXT HTML

    A novel deployable rocket nozzle utilizing superelasticity was proposed in this study. Ti–4.5Al–3V–2Fe–2Mo alloy (SP-700) sheets were heat-treated to have appropriate α/β ratio so that the sheet shows superelasticity at room temperature. A miniature nozzle model was fabricated through thinning, cutting, and welding processes of the sheets. Folding-deployment tests of the model were conducted in addition to finite element analyses of its folding behavior. The feasibility of the new concept of superelastically-deployable sheet structure was successfully verified.

Regular Article
Materials Physics
  • Ahmad Ehsan Mohd Tamidi, Yasushi Sasajima, Akihiro Iwase
    Article type: Regular Article
    2020 Volume 61 Issue 1 Pages 72-77
    Published: January 01, 2020
    Released on J-STAGE: December 25, 2019
    Advance online publication: November 22, 2019
    JOURNAL FREE ACCESS FULL-TEXT HTML

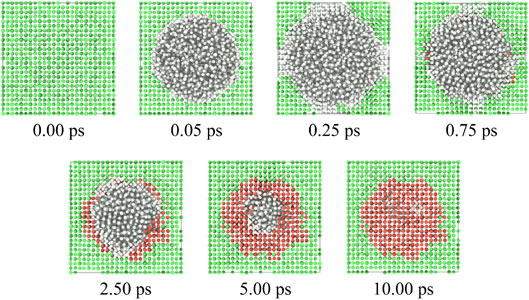
    The structural changes of irradiated Ni3Al were simulated by a molecular dynamics (MD) method. The irradiation event was modeled as the energy deposition of thermal energy produced by a high-energy ion beam, i.e. effective stopping power gSe. The L12 structure was taken as the initial structure and the effects of the irradiation event on the atomic structure were investigated. The relative degree of order, defined as the ratio of the calculated diffraction peaks of the L12 structure before and after the irradiation, and the number of site-exchanged atoms were calculated and found to show good correlation with gSe. The strength of the specimen was estimated from potential energy and it was decreased after the irradiation. Results of the uniaxial extension test done in the MD simulation suggest that the off-site atoms and site-exchanged atoms are the major cause of the reduction of specimen strength.

    Fig. 5 Time changes of ordered L12 lattice structure in Ni3Al after being irradiated with gSe = 2.0 keV/nm. Green spheres are atoms in the ordered L12 lattice structure and red spheres are recovered atoms from the disordered structure. Both green and red atoms are on fcc sites, while grey atoms are in the amorphous structure. Fullsize Image
  • Yoyo Hinuma, Takashi Kamachi, Nobutsugu Hamamoto
    Article type: Regular Article
    2020 Volume 61 Issue 1 Pages 78-87
    Published: January 01, 2020
    Released on J-STAGE: December 25, 2019
    Advance online publication: November 22, 2019
    JOURNAL FREE ACCESS FULL-TEXT HTML

    Modelling of nonpolar surfaces is indispensable for first principles calculations to understand key surface properties, such as the surface energy and band edge positions including the ionization potential and electron affinity. An algorithm to generate nonpolar slab-and-vacuum models that require surface modification to attain stoichiometry was developed and outlined in this paper. Removal of half of the atoms in the outermost layers in a stripe pattern made possible auto-generation of many important nonpolar and stoichiometric slab-and-vacuum models including all spinel and perovskite aristotype surfaces. In addition, a computational procedure that assists the generation of step models was proposed that facilitates investigation of step edges that are often active reaction sites.

    Fig. 2 Examples of generated ZnAl2O4 surface slabs. Red, blue, and grey balls indicate Zn, Al, and O, respectively. The surface orientation is (a–c) (111), (d) (100), (e) (110), and (f) (210), respectively. Fullsize Image
  • Hogyoung Kim, Hee Ju Yun, Seok Choi, Byung Joon Choi
    Article type: Regular Article
    2020 Volume 61 Issue 1 Pages 88-93
    Published: January 01, 2020
    Released on J-STAGE: December 25, 2019
    Advance online publication: November 15, 2019
    JOURNAL FREE ACCESS FULL-TEXT HTML

    The current transport mechanism of AlGaN/GaN Schottky diodes prepared by atomic layer deposition (ALD) was explored using current–voltage (IV) and capacitance–voltage (CV) measurements. The Schottky barrier height decreased and the ideality factor increased with increasing the temperature. Poole-Frenkel mechanism was found to rule the forward current conduction, involving the dislocation-related trap states in AlGaN layer. The activation energy of traps was estimated to be about 0.6 eV under high reverse bias, related with trap-assisted tunneling. Frequency dispersion in the CV data was not significant. CV hysteresis measurements with the sequential scans with increasing the maximum voltage in accumulation showed the increase in the flatband voltage shift, which was associated with the charge trapping occurring in the interfacial oxide layer near the AlGaN/GaN interface. This work suggests that the suppression of Ga–O formation during the initial ALD process is a critical factor to improve the device performance.

    Fig. 6 (a) Schematic diagram of the conduction band offset in the AlGaN/GaN structure with the PF emission barrier at forward bias and (b) schematic band diagram at reverse bias. Fullsize Image
  • Mitsuhiro Asato, Chang Liu, Nobuhisa Fujima, Toshiharu Hoshino, Tetsuo ...
    Article type: Regular Article
    2020 Volume 61 Issue 1 Pages 94-103
    Published: January 01, 2020
    Released on J-STAGE: December 25, 2019
    JOURNAL FREE ACCESS FULL-TEXT HTML

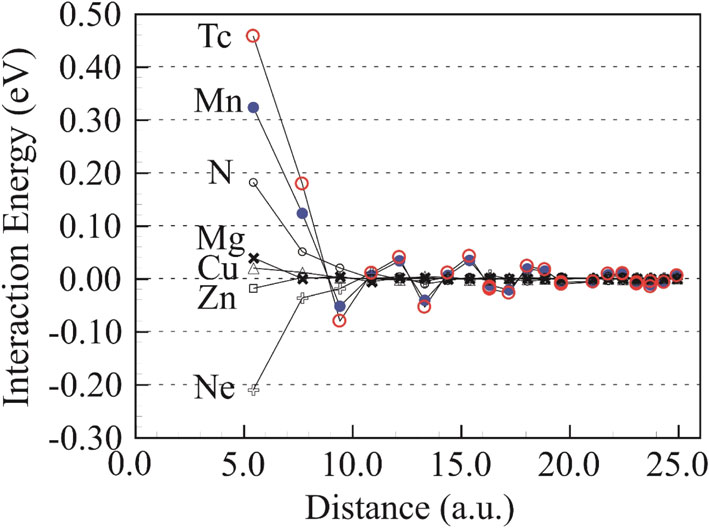
    We presented systematical ab-initio calculations for the n-body (n = 1∼4) interaction energies (IEs) in Al-rich AlX (X = H∼Sn) alloys, by using the full-potential Korringa-Kohn-Rostoker Green’s function (FPKKR) method, and clarified the fundamental features and the thermal electronic contribution due to the Fermi Dirac (FD) distribution for these IEs. We show the calculated results for the IEs: (1) the 2-body IEs of the X = 3d and 4d impurities are strongly repulsive at the 1st-nearest neighbor (nn) and show the oscillating behavior with the interatomic distance; (2) the 1st-nn 2-body IEs of the X = Ne, Ar, and Kr (inert gas elements) impurities are strongly attractive; (3) the 1st-nn 2-body IEs around X = N (2sp element) are repulsive and relatively high; (4) the thermal electronic contribution due to the FD distribution is considerably high for the X = d impurities, while very low for the X = sp impurities; (5) the n-body (n = 1∼4) IEs of the X = 3d and 4d impurities in Al and the thermal electronic contribution for these n-body IEs may be in general lower and lower with the increase in n. It is also discussed that the fundamental features (attraction or repulsion) of the calculated 2-body IEs may be understood by considering the strength differences among the X–X, Al–X, and Al–Al interactions.

    Fig. 7 Distance dependence up to the 20th-nn, for X–X (X = N, Ne, Mg, Mn, Cu, Zn, and Tc) IEs in Al. There are two equivalent sites for the 9th-, 13th-, 16th-, 17th-, and 18th-nn pairs. The k-point set in the irreducible BZ, being equivalent to the 100 × 100 × 100 k-point set in the standard BZ of the Al-host, is used for the k-space integration. The TFD and lattice parameter are fixed at 800 K and 7.7 a.u., respectively. The IEs of Mn–Mn (3d-3d) and Tc–Tc (4d-4d) interaction are oscillating and long-ranged by the strong sp-d interaction of Al–Mn and Al–Tc, respectively. See the text for details. Fullsize Image
Microstructure of Materials
  • Masahiro Araki, Kenji Matsuda
    Article type: Regular Article
    2020 Volume 61 Issue 1 Pages 104-110
    Published: January 01, 2020
    Released on J-STAGE: December 25, 2019
    Advance online publication: November 15, 2019
    JOURNAL FREE ACCESS FULL-TEXT HTML

    This study investigated the influence of the solute concentration and iron on the recrystallization texture formation of an A6063 alloy extruded with the preferred orientation, a commercially available cast A6063 alloy, an alloy containing no Fe, an alloy containing varying amounts of Mg and Si, and the extruded material. The obtained extruded material, the material structure in the extrusion chamber, and the crystal orientation were evaluated using scanning electron microscopy combined with electron backscattering pattern (SEM-EBSP). In the cross-section of the texture of the extruded material, the main orientation was cube; while the main orientation on the surface was crystal grains with a TD // 〈111〉 relationship, such as the Brass orientation and the S orientation. In the alloy that did not contain Fe, the accumulation of cube-oriented grains increased with increasing amounts of Mg and Si. Furthermore, in the surface texture, the accumulation in the direction of TD // 〈111〉 become weak with increasing amounts of Mg and Si. In the alloy containing Fe, the size of the recrystallized grains decreased after extrusion; here, a decrease in the cube-oriented grains and an increase in the brass-like-oriented grains were observed. The structure in the extrusion chamber confirmed that the cube orientation, which is the main orientation after extrusion, barely existed in the chamber, and is formed in front of the extrusion-bearing inlet. It was thereby inferred that the texture of the extruded material is formed during processing and recrystallization from the extrusion-bearing inlet to the bearing portion. During the recrystallization texture formation of the extruded material, Fe forms an Al–Fe–Si compound in the material to suppress recrystallization grain growth. Consequently, expansion of the cube-oriented recrystallized grains that preferentially grow during extrusion is suppressed, and the proportion of these grains is reduced. This suggests that Mg and Si are solid-solved in the Al matrix to reduce the stacking fault energy and to increase the strain accumulation energy during extrusion processing. This in turn accelerates the formation and expansion of cube-oriented grains.

Mechanics of Materials
  • Zili Liu, Chenfei Song, Jiawei Li, Xinbin Hou, Li Wang, Yongzhen Zhang
    Article type: Regular Article
    2020 Volume 61 Issue 1 Pages 111-118
    Published: January 01, 2020
    Released on J-STAGE: December 25, 2019
    Advance online publication: November 11, 2019
    JOURNAL FREE ACCESS FULL-TEXT HTML

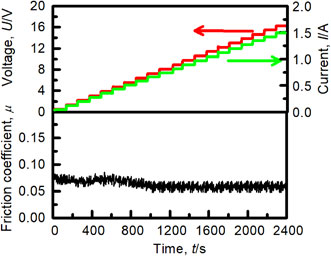
    To investigate the detriment of oil lubrication on the tribo/electric contact, this paper has completed a series of experiments, with single-point disk-disk rollers lubricated Poly Alpha Olefin 4 (PAO 4) drips. The breakdown behaviors were monitored and the material damages were observed by Optical Metallograph Microscope (OMM), Scanning Electron Microscope (SEM), Energy Dispersive Spectrometer (EDS) and White Light Interference Profilometer (WLIP). With the increase of voltage, the equivalent resistance of the contact pairs decreased rapidly at first and then towarded stability at finally. The voltage at the zero point of the derivative of the equivalent resistance was proposed as the breakdown voltage. Both the breakdown voltage and the final resistance increased with the rotation speed, which should be attributed to the thicker oil film at higher speed. Electric discharge erosion and the plastic flow of grains could be formed when the applied voltage exceeded the breakdown voltage. It was speculated that the transformation from the capacitive contact to ohmic contact during breaking should account to the conductive behaviors and the electric damages. The results could help to understand the failure of tribo/electric contact under oil-lubricated or oil-contaminated conditions such as shaft current damage in bearing.

    Fig. 2 Synchronous data of friction coefficient, current and voltage during voltage rising. Fullsize Image
  • Jiaxing Gu, Shanglei Yang, Qi Xiong, Chenfeng Duan
    Article type: Regular Article
    2020 Volume 61 Issue 1 Pages 119-126
    Published: January 01, 2020
    Released on J-STAGE: December 25, 2019
    JOURNAL FREE ACCESS FULL-TEXT HTML

    Al–Zn–Mg alloy is widely used as lightweight material. Laser-arc hybrid welding is considered to be a suitable joining process for aluminum alloy. In this paper, 3-mm-thick 7075 aluminum alloy was welded by laser-arc hybrid welding method. The microstructure of the welded joint was analyzed. Microhardness measurement and tensile test were conducted. The fatigue test of the welded joint and base metal was carried out. And the feature of fatigue crack initiation and propagation were discussed.

    Fig. 6 S–N curve of the welded joint. Fullsize Image
  • So Yoshikawa, Daisuke Matsunaka
    Article type: Regular Article
    2020 Volume 61 Issue 1 Pages 127-135
    Published: January 01, 2020
    Released on J-STAGE: December 25, 2019
    JOURNAL FREE ACCESS FULL-TEXT HTML

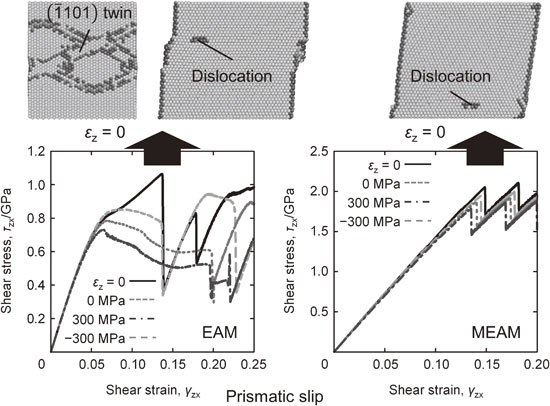
    In order to investigate influences of non-glide stress on slips in magnesium (Mg), we carried out molecular dynamics (MD) simulations of shear deformations for slips with ⟨a⟩ Burgers vector under several normal stress conditions. In the present study, we adopted two kinds of interatomic potentials, embedded atom method (EAM) and modified embedded atom method (MEAM) potentials, which have different activities of deformation modes. For basal slip, extended dislocations were generated and then glided on the basal planes, irrespective of the applied normal stress conditions as well as the adopted interatomic potentials. On the other hand, in simulations for first-pyramidal slip, distinct gliding of a dislocation was not observed, and alternatively the shear deformation was mediated by [1101] twinning. The deformation behaviors observed in simulations for prismatic slip depended on the applied normal stress as well as the interatomic potential. These results imply that not only resolved shear stress for each deformation mode but also non-glide stress components affect the deformation behavior of Mg.

Materials Chemistry
  • Koji Sasaki, Kazushi Hayashi, Mikako Takeda, Shohei Nakakubo, Yohei Ya ...
    Article type: Regular Article
    2020 Volume 61 Issue 1 Pages 136-141
    Published: January 01, 2020
    Released on J-STAGE: December 25, 2019
    Advance online publication: November 22, 2019
    JOURNAL FREE ACCESS FULL-TEXT HTML
    Comparison of thermal stress FEM calculations and experimental stress values of FeO formed at 900°C. The FEM model from 700 to 600°C was two layer model comprising FeO/steel plate and from 500°C to room temperature was three layer model comprising Fe3O4/FeO/steel plate. The arrow indicated that the stress was discontinuously changed due to change of the scale structure. The dominant thermal stress was generated between 700 and 600°C as well as between 500°C and RT.
    Comparison of thermal stress FEM calculations and experimental stress values of FeO formed at 900°C. The FEM model from 700 to 600°C was two layer model comprising FeO/steel plate and from 500°C to room temperature was three layer model comprising Fe3O4/FeO/steel plate. The arrow indicated that the stress was discontinuously changed due to change of the scale structure. The dominant thermal stress was generated between 700 and 600°C as well as between 500°C and RT. Fullsize Image
  • Yuki Imatani, Satoshi Oue, Akinobu Kobayashi, Takehiro Takahashi, Yasu ...
    Article type: Regular Article
    2020 Volume 61 Issue 1 Pages 142-149
    Published: January 01, 2020
    Released on J-STAGE: December 25, 2019
    JOURNAL FREE ACCESS FULL-TEXT HTML

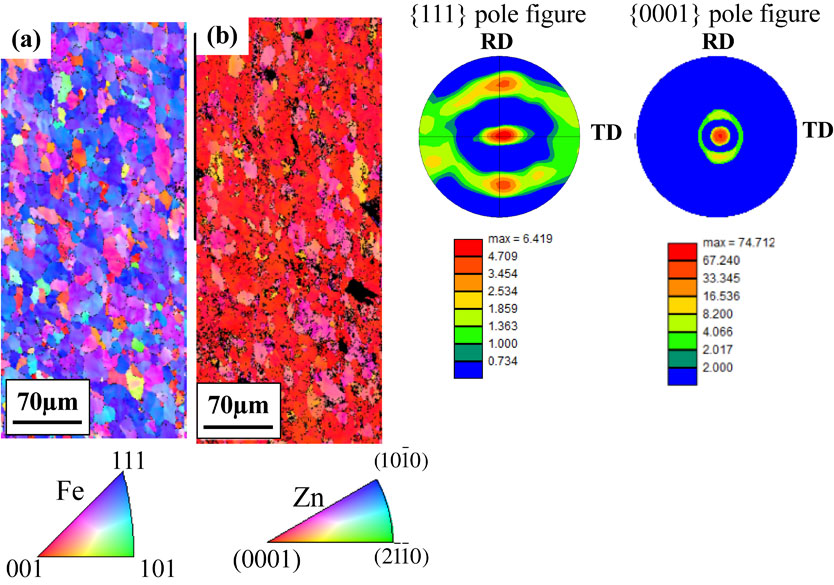
    This study investigates the effect of surface texture on the crystal orientation relation between Fe and Zn on steel sheets. The Zn was deposited onto Al-killed and IF steel sheets in an agitated sulfate solution at 313 K (under deposition conditions of 1500 A·m−2 and 1.48 × 10⁴ C·m−2). Chemically polishing the steel simplifies the epitaxial deposition of Zn by decreasing the strain on the steel surface. For Zn deposited on polished Al-killed steel, the Burgers’ orientation relation {110}Fe//{0001}Zn was observed. In this case, the {111}Fe orientation was increased while the {0001}Zn orientation was reduced. In contrast, when Zn was deposited on IF steel, the preferred relation was {111}Fe//{0001}Zn. Because IF steel has a larger crystal-grain size than Al-killed steel, the epitaxial growth of Zn is easier on IF steel than on Al-killed steel. Meanwhile, the {111}Fe orientation was more prominent on IF steel than on Al-killed steel. Thus, the orientation relationship {111}Fe//{0001}Zn is probably driven by the enhanced {111}Fe orientation. The strain, crystal orientation, and grain size of the steel influenced the orientation relation between the deposited Zn and steel, and hence the crystal orientation of the deposited Zn.


    This Paper was Originally Published in Japanese in J. Japan Inst. Met. Mater. 83 (2019) 363–371.

    Fig. 7 Crystal orientation mapping images and {110} and {0001} pole figures of (a) IF steel after chemical polishing for 10 s and (b) Zn deposited on the IF steel. Fullsize Image
  • Dong Ju Shin, Sung-Ho Joo, Dongseok Lee, Jung Shin Kang, Min-Seuk Kim, ...
    Article type: Regular Article
    2020 Volume 61 Issue 1 Pages 150-155
    Published: January 01, 2020
    Released on J-STAGE: December 25, 2019
    Advance online publication: November 22, 2019
    JOURNAL FREE ACCESS FULL-TEXT HTML

    Leaching and hydrolysis of Ti from washed Na2TiO3 were studied. Synthetic rutile was mixed with NaOH at a weight ratio of 1:1.13 and salt-roasted at 773 K for 4 hours to synthesize Na2TiO3. This was washed with distilled water to obtain a leached sample. Acid leaching was carried out at 303, 323, 333, 343, 353, 363, and 373 K for 4 hours using 5 M hydrochloric acid. From 303 to 343 K, the leaching efficiency of Ti increased with an increase in time, with 96% Ti leached at 343 K. From 353 to 373 K, Ti was preferentially leached with time and precipitated by hydrolysis, and the leaching efficiency decreased. The leaching and hydrolysis of Ti were investigated using reaction equations and thermodynamic data corresponding to each leaching temperature. The kinetics of the leaching reaction were studied using kinetic equation for the chemical-reaction-controlled step, applying a shrinking core model of the heterogeneous reaction. The activation energies, derived from the Arrhenius plot, was 38.9 kJ/mol for the chemical-reaction-controlled plot, indicating that the chemical reaction was the rate-determining step. The hydrolysis reaction was dominant at temperatures above 353 K, and the residue after the reaction consisted mostly of TiO2.

    Fig. 2 Leaching efficiency of Ti by temperature. Fullsize Image
Materials Processing
  • Masahito Katoh, Takuya Aihara
    Article type: Regular Article
    2020 Volume 61 Issue 1 Pages 156-161
    Published: January 01, 2020
    Released on J-STAGE: December 25, 2019
    Advance online publication: November 11, 2019
    JOURNAL FREE ACCESS FULL-TEXT HTML

    We experimentally investigated the effect of the mass of a drop hammer in impact punching with polyvinyl alcohol (PVA) gel as the working medium. There is an optimal mass of the drop hammer. For constant initial energy, if the mass of the drop hammer is small, the impulse (change in momentum) becomes small, and punching cannot be accomplished. On the other hand, if the mass of the drop hammer is large, the speed of the pressurizing ram will be small for the same kinetic energy, the flow pressure of the PVA gel will not be sufficiently raised, and again, punching cannot be accomplished.


    This Paper was Originally Published in Japanese in J. JSTP 60 (2019) 27–32. Equations (1) and (2) are newly assigned numbers, and accordingly the equations numbers are postponed from then.

  • Takahiro Ohta
    Article type: Regular Article
    2020 Volume 61 Issue 1 Pages 162-168
    Published: January 01, 2020
    Released on J-STAGE: December 25, 2019
    JOURNAL FREE ACCESS FULL-TEXT HTML

    In this study, a new peen forming technique by means of vibration peening using a rectangular solid pin is developed. It is possible to produce a smaller x-direction (short side of the pin) curvature radius Rx than the z-direction (long side of the pin) curvature radius Rz. Vibration peening, which projects the pin into the specimen using the reciprocating motion of the electric hammer, is applied. In the experiment, Rz/Rx increases as the pin-tip radius r decreases. The motion of the pin is analyzed by the dynamic explicit finite-element method (FEM). The pin reciprocates between the hammer and the specimen and collides with the specimen 17 times in 0.2 s. The number of collisions agrees with the experimental result of 10 to 18 times in 0.2 s. The plastic strain distributions are determined using the maximum velocity of the pin. Peen forming is analyzed by the following method. In Step 1, the initial velocity is set for multiple pins, and plastic strain distributions generated by collisions are analyzed by the dynamic explicit FEM. In Step 2, plastic strain distributions analyzed in Step 1 are input to the specimen to analyze the deformation by the static implicit FEM. The analysis results indicating the increase in Rz/Rx with decrease in r agree with the experimental results.


    This Paper was Originally Published in Japanese in J. JSTP 60 (2019) 33–38. Figures 5, 6, 9 and 10 were slightly changed.

  • Nobuya Sasaguri, Ryota Takao, Kaoru Yamamoto, Yuzo Yokomizo, Yasuhiro ...
    Article type: Regular Article
    2020 Volume 61 Issue 1 Pages 169-175
    Published: January 01, 2020
    Released on J-STAGE: December 25, 2019
    Advance online publication: November 22, 2019
    JOURNAL FREE ACCESS FULL-TEXT HTML

    The influence of alloying elements on continuous cooling transformation (CCT) behavior was investigated for 16 mass% chromium cast irons containing 0.9 to 4 mass% Mo, V and Nb separately using a transformation measurement apparatus with subzero cooling function. On CCT curves, pearlite and martensite transformations appeared irrespective of the type of alloying element. When Mo was added by more than 1 mass%, bainite transformation was observed in addition to the two transformations above. Regardless of the type of alloying elements, pearlite transformation delayed when the amount of each alloying element was increased. It was found that Mo addition was most effective for delaying pearlite transformation in these alloying elements. MS and Mf temperatures increased slightly by increasing V and Nb contents. Both temperatures decreased with the addition of Mo up to 2 mass% and increased with the addition of Mo over 2 mass%. Regardless of the type and amount of alloying elements added, pearlite transformation delayed, and MS and Mf temperatures decreased with increasing austenitizing temperature.


    This Paper was Originally Published in Japanese in J. JFS 90 (2018) 373–380. Figures 2–4, 12 and 15 were slightly changed.

  • Masato Shirai, Hiroshi Yamada
    Article type: Regular Article
    2020 Volume 61 Issue 1 Pages 176-180
    Published: January 01, 2020
    Released on J-STAGE: December 25, 2019
    Advance online publication: November 22, 2019
    JOURNAL FREE ACCESS FULL-TEXT HTML

    Except in the case of martensitic transformation during quenching and age-hardening, the mechanical properties (tensile strength and hardness) of many metallic materials are often determined by its chemical composition. If mechanical properties can be predicted from the chemical composition of molten metal before casting, it can contribute to the stabilization of quality and the reduction of the testing process of tensile strength and hardness. In the case of gray cast iron, mechanical properties are often discussed with five main elements (C, Si, Mn, P and S). Multiple regression shows low performance in terms of correlation coefficient. Therefore, trace elements other than the five main elements should be considered since the influence of trace elements on mechanical properties is mostly nonlinear, making it difficult to analyze by multiple regression. Given that deep neural network (DNN) can take nonlinear cases into consideration, we investigated whether mechanical properties can be predicted from chemical compositions including trace elements, and obtained the following findings. For comparison, we also analyzed mechanical properties by multilayer perceptron (MLP) and multiple regression (MR). As a result, the prediction accuracy of DNN, MLP and MR improved by the consideration of not only the five main elements but also 18 other elements including trace elements. Prediction error of tensile strength analyzed by DNN was less than half of MR. Increasing the number of layers and the number of nodes in DNN improved the prediction accuracy of mechanical properties, demonstrating the effectiveness of DNN.


    This Paper was Originally Published in Japanese in J. JFS 91 (2019) 253–257.

  • Han Yan, Congcong Zhu, Zhen Wu, Wenli Gao
    Article type: Regular Article
    2020 Volume 61 Issue 1 Pages 181-187
    Published: January 01, 2020
    Released on J-STAGE: December 25, 2019
    JOURNAL FREE ACCESS FULL-TEXT HTML

    The effect of antimony (Sb) additions (0, 0.2 mass%) and cooling rates (0.56°C·s−1, 2.03°C·s−1, 7.42°C·s−1) on the Al–Si eutectic of hypoeutectic Al–Si alloys were investigated. The results show that Sb combines with Mg to form a compound Mg3Sb2 which poisoned the nucleation particle AlP, resulting in the nucleation undercooling of the eutectic silicon increased. In unmodified alloy, the sensitivity of eutectic temperatures to cooling rate decreases with the increase of cooling rate. The reason is that the growth rate of eutectic silicon increases and the latent heat of crystallization is released in large quantities. After adding 0.2%Sb, there was a good linear relationship between eutectic temperatures and cooling rates. Due to the inhibition of silicon growth by Sb and Mg3Sb2 particles, the growth of the eutectic silicon was slower and the latent heat of crystallization was released slowly. Hence, Sb increased the sensitivity between 2.03°C·s−1 and 7.42°C·s−1. In unmodified alloy, the eutectic nucleated on the primary dendrites and interdendritic liquid, after adding 0.2%Sb, the eutectic only nucleated independently in the interdendritic regions.

    Fig. 7 EBSD images of (a)(c)(e) Al–7Si–0.6Mg alloy, (b)(d)(f) Al–7Si–0.6Mg–0.2Sb alloy at different cooling rates ((a)(b) correspond to 0.56°C·s−1, (c)(d) correspond to 2.03°C·s−1 and (e)(f) correspond to7.42°C·s−1). Fullsize Image
Engineering Materials and Their Applications
  • Takeshi Kizaki, Minho O, Masanori Kajihara
    Article type: Regular Article
    2020 Volume 61 Issue 1 Pages 188-194
    Published: January 01, 2020
    Released on J-STAGE: December 25, 2019
    Advance online publication: November 11, 2019
    JOURNAL FREE ACCESS FULL-TEXT HTML

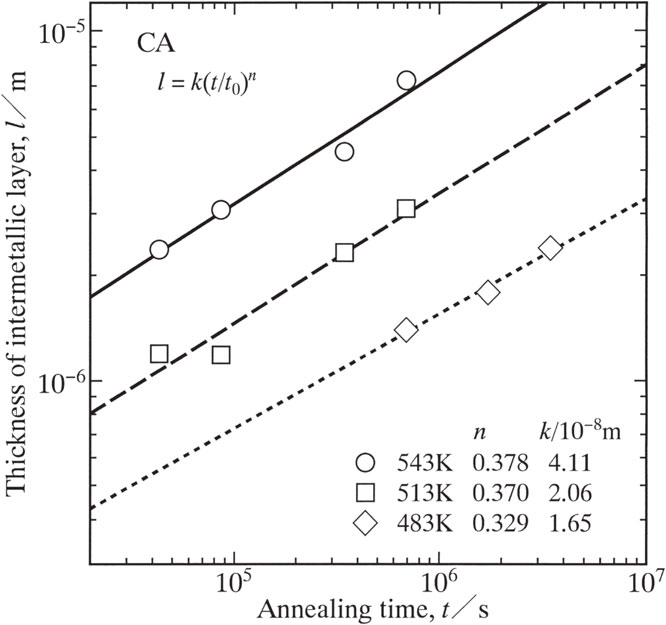
    The rate-controlling process of compound growth in the Cu-clad Al (CA) wire was metallographically examined in the temperature range of 483–543 K (210–270°C). CA wires were prepared by a wire drawing technique, and then isothermally annealed for various times up to 3.456 Ms (960 h) in this temperature range. During isothermal annealing, the α2, γ1, δ, η2 and θ phases form as layers at the original Cu/Al interface in the CA wire. However, at 483–513 K (210–240°C), the α2, γ1, δ and η2 phases could not be differentiated from one another in a metallographical manner. The layer of the θ phase is designated layer 1, and that of the α2, γ1, δ and η2 phases is called layer 2. The mean thickness of each layer increases in proportion to a power function of the annealing time. Such a relationship is called a power relationship. The exponent of the power relationship takes values between 0.22 and 0.36 for layer 1 and those between 0.39 and 0.50 for layer 2. The exponent smaller than 0.5 indicates that boundary diffusion as well as volume diffusion contributes to the layer growth. However, the contribution of boundary diffusion is more remarkable for layer 1 than for layer 2. The activation enthalpy for the proportionality coefficient of the power relationship was estimated to be 43 and 73 kJ/mol for layers 1 and 2, respectively. The former value is smaller than the latter value. This is attributed to the contribution of boundary diffusion being greater for layer 1 than for layer 2.

    Fig. 3 The total thickness l of the intermetallic layer versus the annealing time t shown as open rhombuses, squares and circles for T = 483, 513 and 543 K (210, 240 and 270°C), respectively. The values of k and n in eq. (2) were estimated by the least-squares method. Fullsize Image
  • Daeyoon Baek, Kyu-Hwan Shim, Sung-Nam Lee, Woong-Ki Hong, Chel-Jong Ch ...
    Article type: Regular Article
    2020 Volume 61 Issue 1 Pages 195-199
    Published: January 01, 2020
    Released on J-STAGE: December 25, 2019
    Advance online publication: November 11, 2019
    JOURNAL FREE ACCESS FULL-TEXT HTML

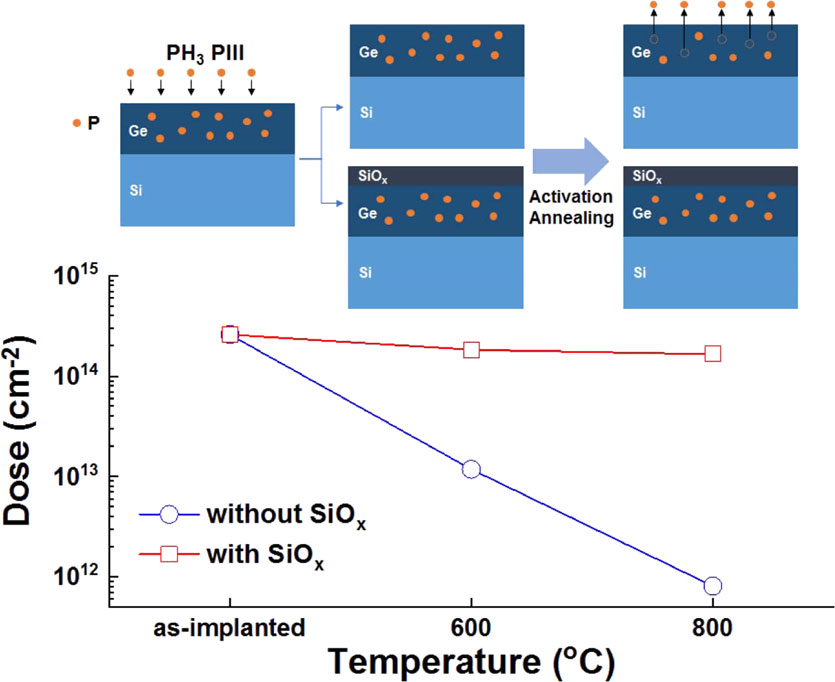
    The PH3 plasma immersion ion implantation (PIII) process was used to introduce phosphorus (P) atoms in a germanium (Ge) film epitaxially grown on a silicon (Si) (100) substrate. A SiOx capping layer was formed on the implanted Ge epilayer, followed by activation annealing at 500–800°C under flowing N2 atmosphere. The out-diffusion behavior of the implanted P atoms in the SiOx-capped Ge epilayer was investigated as a function of activation annealing temperature and was compared with the out-diffusion behavior of an uncapped Ge epilayer. The PIII process introduced damage near the Ge surface with the formation of a thin amorphous Ge layer whose thickness was comparable to the projected range calculated from simulation. Irrespective of the SiOx capping layer, the sheet resistance decreased with increasing annealing temperature, which could be attributed in part to the recovery of the implantation damage and to dopant activation. The SiOx capping layer was effective in suppressing the out-diffusion of implanted P atoms into the Ge epilayer, resulting in insignificant dopant loss during activation annealing. This allows that the SiOx-capped samples showed lower sheet resistance than the uncapped ones over the whole temperature range. The increase in annealing temperature resulted in reducing the number of implantation-induced defects and misfit dislocation of the Ge epilayer grown on Si, leading to improved structural properties. Furthermore, annealing at 800°C facilitated softening and reflow of the implanted Ge epilayer, which could be responsible for the remarkable improvement of surface roughening caused by the PIII process.

  • Isao Nakatsugawa, Yasumasa Chino
    Article type: Regular Article
    2020 Volume 61 Issue 1 Pages 200-205
    Published: January 01, 2020
    Released on J-STAGE: December 25, 2019
    JOURNAL FREE ACCESS FULL-TEXT HTML

    The discharge behavior of Mg-air battery consisting of AZ31 Mg alloy anode and a graphite-based air cathode was investigated under constant discharge current densities of up to 40 mA cm−2. Discharge with higher current density increased the power density, which reached its maximum value of 25 mW cm−2 at 30 mA cm−2. Further discharge caused the cell voltage to drop and fluctuate. Electrochemical impedance spectra of the Mg anode revealed specific trajectories according to the discharge current. A new electrical equivalent circuit modeling the dissolution at the Mg anode was proposed. After checking its validity, the dependence of the circuit elements on the discharge current was analyzed. A discharge product in the form of hydrotalcite was preferentially formed under high current discharge, which was gradually transformed to Mg(OH)2 and Al2O3. Higher discharge current promoted uniform dissolution of the Mg anode and improved the anodic efficiency. The removal of Al–Mn intermetallic particles was considered as the cause, which was verified by SEM/EDS analysis. Considering the anode kinetics and the performance of the air cathode, the optimal operation condition of 30 mA cm−2 discharge was proposed for the present Mg-air battery configuration.

    Nyquist diagram of Mg-air battery with 10 mA cm−2 discharge, showing two inductive loops in the lower frequencies. Fullsize Image
  • Takeshi Kizaki, Minho O, Masanori Kajihara
    Article type: Regular Article
    2020 Volume 61 Issue 1 Pages 206-212
    Published: January 01, 2020
    Released on J-STAGE: December 25, 2019
    Advance online publication: November 29, 2019
    JOURNAL FREE ACCESS FULL-TEXT HTML

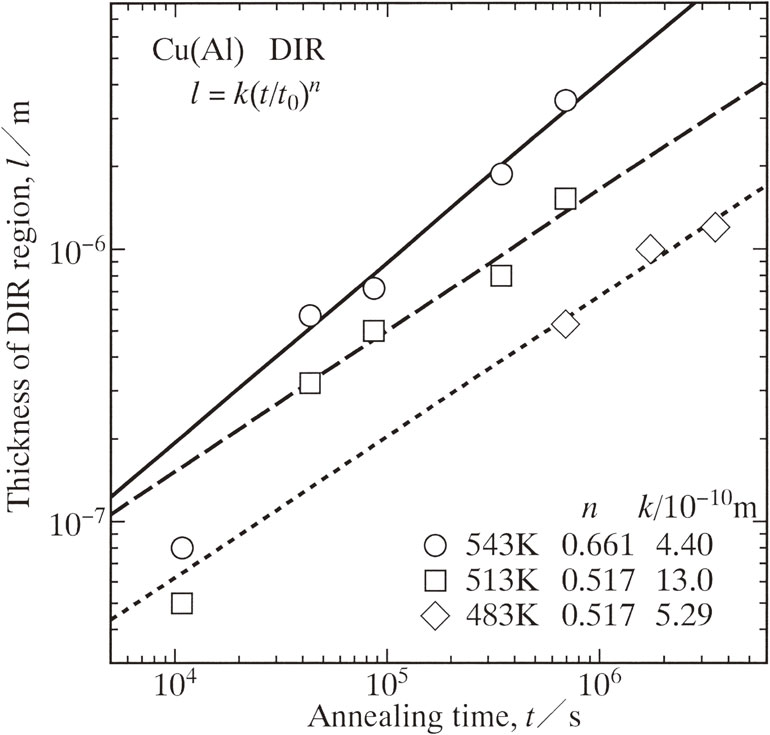
    Diffusion induced recrystallization (DIR) occurs in Cu of Cu-clad Al (CA) wire during heating at temperatures around 200°C. The kinetics of DIR in the CA wire was experimentally observed in the temperature range of 210–270°C. In this temperature range, CA wires were isothermally annealed for various periods of 3 h to 960 h. Owing to annealing, layers of the α2, γ1, δ, η2 and θ phases form at the original Cu/Al interface, and the DIR region alloyed with Al is produced in the Cu phase from the Cu/α2 interface. The thickness l of the DIR region monotonically increases with increasing annealing time t. The DIR region grows faster at higher annealing temperatures. The new extended-model proposed in a previous study was used to analyze theoretically the experimental result. According to the analysis, l is proportional to t in the early stages but to a power function of t in the late stages. This means that the DIR growth is governed by the interface reaction at the moving boundary in the early stages but by the boundary diffusion across the DIR region in the late stages. Although the shortest annealing time of 3 h at 240–270°C is located in the early stages, most of the annealing times belong to the intermediate stages. Consequently, under the present experimental conditions, both the interface reaction and the boundary diffusion mainly contribute to the rate controlling process of DIR. On the other hand, the interface reaction is the rate controlling process for the shortest annealing time.

    Fig. 3 The mean thickness l of the DIR region versus the annealing time t shown as open rhombuses, squares and circles for T = 483, 513 and 543 K (210, 240 and 270°C), respectively. Fullsize Image
  • Shojiro Ochiai, Hiroshi Okuda
    Article type: Regular Article
    2020 Volume 61 Issue 1 Pages 213-220
    Published: January 01, 2020
    Released on J-STAGE: December 25, 2019
    Advance online publication: November 29, 2019
    JOURNAL FREE ACCESS FULL-TEXT HTML

    The relation of distribution of crack size to that of critical current under small voltage probe spacing in RE(Y, Sm, Dy, Gd, ….)Ba2Cu3O7−δ layer-coated superconducting tape with stress-induced cracks was studied with a Monte-Carlo simulation method in combination with a model of current shunting at cracks. First, it was shown that the experimentally observed feature that the critical current decreases with increase in distribution width of crack size and voltage probe spacing was reproduced by the present simulation. Then it was revealed that (i) the largest crack among all cracks in the region between the voltage probes plays a dominant role in determination of critical current, and, (ii) when the size of the largest crack is fixed, the large difference in crack size among all cracks acts to raise the critical current value and to reduce the n-value, and, in this phenomenon, the reduction of n-value with increasing difference in crack size is more dominant than the increase of critical current. Finally, it was shown that the distribution of critical current can be described using the Gumbel’s extreme value distribution function as a first approximation under small voltage probe spacing where the influence of the difference in crack size on critical current is relatively small.

    The distribution of critical current of the superconducting tape with cracks of different sizes in the superconducting layer under small voltage probe spacing was described satisfactorily with the approach proposed in this work. Fullsize Image
feedback
Top