Mechanics of Materials
Effect of Rotation Speed on Electric Damage of Copper Tribo/Electric Rolling Pairs under Lubricated Single-Point Contact
2020 Volume 61 Issue 1 Pages 111-118

Details
2020 Volume 61 Issue 1 Pages 111-118
To investigate the detriment of oil lubrication on the tribo/electric contact, this paper has completed a series of experiments, with single-point disk-disk rollers lubricated Poly Alpha Olefin 4 (PAO 4) drips. The breakdown behaviors were monitored and the material damages were observed by Optical Metallograph Microscope (OMM), Scanning Electron Microscope (SEM), Energy Dispersive Spectrometer (EDS) and White Light Interference Profilometer (WLIP). With the increase of voltage, the equivalent resistance of the contact pairs decreased rapidly at first and then towarded stability at finally. The voltage at the zero point of the derivative of the equivalent resistance was proposed as the breakdown voltage. Both the breakdown voltage and the final resistance increased with the rotation speed, which should be attributed to the thicker oil film at higher speed. Electric discharge erosion and the plastic flow of grains could be formed when the applied voltage exceeded the breakdown voltage. It was speculated that the transformation from the capacitive contact to ohmic contact during breaking should account to the conductive behaviors and the electric damages. The results could help to understand the failure of tribo/electric contact under oil-lubricated or oil-contaminated conditions such as shaft current damage in bearing.

Fig. 2 Synchronous data of friction coefficient, current and voltage during voltage rising.
As functional friction pairs, tribo/electric pairs provide the combinate functions of wear and conduction between moving components.1) Recently, novel rolling tribo/electric contact has become a rising concern in research and application due to its excellent performances such as long life, low electrical resistance, low torque, etc.2,3) To keep a reliable electrical contact, most of the tribo/electric pairs were required to work in dry frictional condition without oil or grease lubricants. However, some tribo/electric pairs were compelled to run in lubricated situations. For example, shaft current could flow through the motor bearings when the potential between the rotor and the stator was high enough. Here, the raceways, oil film and rolling elements in bearing formed a rolling electric circuit.4) Shaft current often leads to bearing failure after a short operation time.
Many efforts have been made on the shaft current and the related electric damages. Li discussed the formation mechanism and influence of bearing current in wind power generation based on the Finite Element Method.5) Park provided a shaft voltage mitigation method according to the changes of parasitic capacitance by using equivalent circuit model.6) Kalaiselvi reported that discharge of the shaft current in small-/medium-power motors was completely eliminated by using a hybrid pulsewidth-modulation method.7) Stack developed an experimental method to initiate and progress a bearing fault by controlling the applied shaft current.8) The experiments mentioned above focused on the damage analysis and electrical protection after bearing failure, however, the safe electrical conditions for bearing running has not been proposed. The early warning of the shaft current state should be beneficial for the safety running of bearing. Therefore, it is essential to develop a rapid and effective method for estimating the electrical safety before the final failure of rolling contact.
The above researches were usually practiced on real bearings, and the results of shaft current behaviors and material damages were the comprehensive feedback of multi-points contact of several rolling elements in bearing. It was very difficult to know the accurate information on the individual contact area. As the basic unit for the multi-points contact of bearing, the single-point contact could greatly reduce the difficulty of research. For example, the wheel/rail in electrified railway is also a rolling electric contact, which acts as the power return system. Hardwick et al. examined the effects of water and grease on the single-point rolling wear under single-point contact, but they neglected the effect of current and related electric damage.9) The frictional and electrical characteristics of single-point rolling pairs was investigated in our previous work, but the effect of lubrication has not been considered up to now.10,11) When the lubricated film participated in the contact surface, the tribological performance should be improved but the ohmic contact between metal surfaces could be broken. Compared to the dry frictional pairs, lubricated tribo/electric pairs should show some new characteristics on both tribology and conduction because of the changes of tribo/electric states. It is important to be clear about what would happen when the oil involved in the rolling tribo/electric contact.
In this paper, the lubricated single-point tribo/electric contact was obtained by dropping base oil PAO 4 on the Cu/Cu disk rollers. The real-time data of friction coefficient and current were obtained synchronously by an electric-rolling tribometer. The conductive behaviors of the lubricated tribo/electric contact were tested by applying stepping voltages under different rotation speed. A breakdown criterion of the rolling pairs was proposed according to the derivative of the equivalent resistance versus applied voltage. The electric damage mechanism of rolling surface was discussed by the analysis results of OMM, SEM, EDS and WLIP. The results may be beneficial for a deeper understanding for the failure of rolling tribo/electric contact under lubrication condition, especially for the bearing damage induced by shaft current.
Rolling tribo/electric contact was obtained on a homemade electric-rolling tribometer (FTM-CF100, Nanjing Bio-Inspired Technology Co. Ltd, China), whose panorama was shown in Fig. 1(a). The main operational parameters of FTM-CF100 were listed in Table 1. The disk roller samples were fixed on the apexes of the axes supported by insulated bearings (Fig. 1(b)). The rotation speed v of the axes was controlled by two independent motors so that purely rolling (Roll slip ratio was zero) could be obtained by adjusting the angular velocity. On the other axes ends, mercury rings were installed in apexes so that the direct current could be applied to the axes and samples. The axis B mounted on a ball screw could be moved by a loading system so that a contact load could be applied when the samples contacted. A torque sensor was mounted at the end of the motor for measuring torque and then the friction force was calculated according to the radius of the sample. The zero shift of the torque was checked before each test.

The experimental details. (a) The panorama of FTM-CF100 tribometer; (b) Sketch map of FTM-CF100 tribometer; (c) Cu/Cu rolling tribo/electric contact pairs; (d) Sketch map of PAO 4 lubrication.

In previous work, pure copper was selected as sample material to imitate the tribo/electric contact between moving components such as pitch control servos of wind power systems, current collectors of radar, and wheel-rail current return systems.10,11) In order to guarantee the research consistent, pure copper frictional pairs were still utilized in our experiment as before.10) The radius of Cu tested sample was 40 mm and the radius of its outer edge was 100 mm. The counter sample was a cylinder with a bottom radius of 60 mm (Fig. 1(c)). The thickness of the two rolling samples was 20 mm. To obtain a lubricated contact, PAO 4 (Beijing Sunright Trade Co. Ltd, China) was dripped into the contact area with a rate of 2 drips per second (Fig. 1(d)). The basic properties of PAO 4 were listed in Table 2.12,13) The minimum oil film thickness hmin could be caculated by Hamrock-Dowson’s theory, and the lubrication state could be identified by the thickness to roughness ratio.12,14)
2.2 Rolling tribo/electric testsAccording to the contact mechanics, the critical contact pressure for the yield of copper was estimated as 393 MPa since the yield strength was 244 MPa.15,16) To avoid the initial yield of copper sample, elastic contact should be formed between the samples. Therefore, the contact load F was set to 40 N during rolling, the contact pressure was calculated as 240 MPa and the contact area was 0.25 mm2.15,17) According to lubrication theory,14) the thickness of oil film was mainly decided by the rotation speed. To obtain different oil thickness, the tested sample rotated at 30∼480 round per minute and the rotation speed v was 0.13∼2.01 m·s−1. This low speed range could cover the typical generation condition of shaft current,18,19) and consequently caused the shaft current more easily.18) The rotation ratio between tested sample and counter sample was 3:2, and therefore pure rolling without slip could be obtained. To monitor the conductive behaviors, direct voltages ranged from 0∼16 V were applied on the frictional pairs. Specially, the voltage increased 0.8 V each time, and each voltage remained steady for 120 seconds (Fig. 2). The contact force F, friction coefficient μ, current I, applied voltage U and equivalent resistance R could be obtained synchronously during the rolling. For instance, Fig. 2 displayed the synchronous data of friction coefficient, current, applied voltage under stepping voltages.

Synchronous data of friction coefficient, current and voltage during voltage rising.
The experiments at each rolling conditions were repeated 5 times, and the error bands were marked in the related figures and tables.
2.3 Surface characterizationTo find out the relationship between electric damage and conduction status, worn samples under different applied voltage were selected as microscopic samples. These samples were obtained at voltages of 0 V, 3 V, 5.5 V, 14 V after rolling for 10 hours with a speed of 0.50 m·s−1. Samples rolled with 1.00 m·s−1 and 1.51 m·s−1 at 5.5 V were used as comparisons. The selected samples were cut by wire-electrode cutting and then were ultrasonically cleaned for 30 minutes in acetone and anhydrous ethanol respectively. The morphologies on the rolling surfaces were investigated by SEM (JSM-5610LV, Japan) and the components were analyzed by EDS (EDAX, Octane SDD Series, USA). Metallographic structure beneath the rolling surface was observed by OMM (DMi 8C, Leica, Germany) from side view. The surface roughness (root mean square, Sq) was measured by WLIP (NanoFocus µsurf expert, Germany). During the surface scanning, the area size was set as 600 µm × 600 µm and each sample was scanned 3 times.
The tribological and electric performance were tested synchronously during rolling. As shown in Fig. 3, the friction coefficient basically maintained at the level of 0.05 with the increase of voltage. Under this experimental condition and time range (2400 s), the applied voltage has not caused detectable deterioration of friction coefficient yet. The average friction coefficient under different rotation speed was 0.051 (standard deviation was 0.006).

The average friction coefficient under different rotation speed. The standard deviation of the measured value at each speed was plotted as the error bar.
The equivalent resistance R was utilized to characterize the electric contact state. Figure 4(a) showed one of the repeated results on the variation of the resistance during the voltage increasing. For example at the rotation speed of 2.01 m·s−1, the measured resistance was 13.75 Ω (standard deviation was 0.15 Ω) at 0.8 V and decreased to 11.32 Ω (standard deviation was 0.19 Ω) rapidly at 6.0 V, then turned to be steady to 11.01 Ω (standard deviation was 0.23 Ω) at higher voltage. The resistance at other rotation speeds has a similar tendency to that at 2.01 m·s−1. This meant that the conductive contact of lubricated Cu rollers could be affected by applied voltage. It was noticed that the resistance increased with the rotation speed under a same voltage. Finally, the stabilized resistance increased from 10.75 Ω to 11.01 Ω when the rotation speed increased from 0.13 m·s−1 to 2.01 m·s−1. The average stabilized resistance and its standard deviation at each speed was listed in Table 3. As a comparison, the equivalent resistance versus voltage during dry rolling at 0.50 m·s−1 was plotted in Fig. 4(b). With the increasing of voltage, the equivalent resistance varied around 10.55 Ω (standard deviation was 0.22 Ω). But for the lubricated rolling at 0.50 m·s−1, the equivalent resistance decreased from 12.46 Ω (standard deviation was 0.42 Ω) and turned to be steady to 10.82 Ω (standard deviation was 0.29 Ω), which was higher than that of dry contact. The contrast results in Fig. 4(b) indicated that the oil lubrication of electrical contacts was detrimental to the conduction.

The curves of equivalent resistance versus voltage. (a) Lubricated rolling with different rotation speed; (b) Comparison of lubricated rolling and dry rolling. The standard deviation of the measured values at each voltage was plotted as the error bar.

Both industry application and fundamental research indicated that when the voltage applied on bearing exceeded a certain breakdown voltage, the lubricating film would lose its insulating properties and the electric damage would form.20) Therefore, the breakdown voltage was an essential condition for the safety operation of lubricated rolling tribo/electric frictional pairs. An oil film after completely breakdown should act as a membrane resistance in the conductive circuit, thus the equivalent resistance of frictional pairs could remain stable with a rising voltage. A breakdown criterion was proposed according to the derivative of the equivalent resistance versus applied voltage. For example at 2.01 m·s−1 in Fig. 5, the derivative of the equivalent resistance was less than zero and shows an increasing trend when the voltage was lower than 9.8 V. The negative derivative reflected the decreasing of resistance in Fig. 4. At the voltage higher than 9.8 V, the derivative maintained basically at zero, indicating the constant resistance after breakdown. With the method in Fig. 5, the breakdown voltages UB under different speed could be estimated and shown in Fig. 6 and Table 3. With the increase of speed from 0.13 m·s−1 to 2.01 m·s−1, the breakdown voltage raised from 4.2 V to 9.8 V.
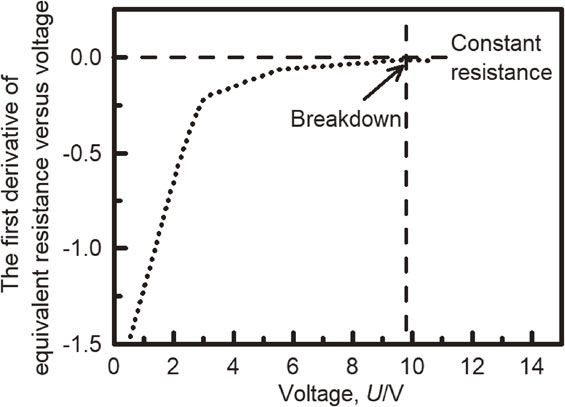
The derivative of the equivalent resistance versus voltage at 2.01 m·s−1.

Breakdown voltage under different rotation speed. The standard deviation of the measured values at each speed was plotted as the error bar.
To reveal the relationship between breakdown and electric damage, the topography of the rolling surface under different breakdown states was observed by metallurgical microscope firstly. The breakdown voltage was 5.5 V, 6.7 V and 7.8 V at 0.50 m·s−1, 1.00 m·s−1 and 1.51 m·s−1 respectively. After mechanical rolling for 10 h at 0.50 m·s−1, only a few machining traces were observed in Fig. 7(a). When the applied voltage was 3 V (unbreakdown), no visible damage was observed on the surface (Fig. 7(b)). When the applied voltage was 5.5 V (breakdown), a dark pit was found on the surface (Fig. 7(c)). When the voltage increased to 14 V (breakdown), large area pit has formed on the surface (Fig. 7(d)). In Figs. 7(e) and 7(f), the applied voltage 5.5 V was lower than breakdown voltage of 1.51 m·s−1 and 1.00 m·s−1, the pit was much smaller than that shown in Fig. 7(c). The pits should be one of the appearances of electric damage because they were present mostly on the tribo/electric rolling surface after breakdown.

OMM top-view of rolling tribo/electric frictional pairs under different voltages and rotation speeds. The breakdown voltage was 5.5 V, 6.7 V and 7.8 V at 0.50 m·s−1, 1.00 m·s−1 and 1.51 m·s−1 respectively.
In side-view, the deformation of the grains could be observed after tribo/electric rolling. Figure 8(a) showed the original grains of Cu roller. After mechanical rolling, the grains still maintained the original state basically (Fig. 8(b)). The comparison of Fig. 8(a) and Fig. 8(b) indicated that mechanical rolling at 0.50 m·s−1 could not result in the plastic deformation of the grains. After electric rolling with a voltage of 3 V (unbreakdown), no significant plastic deformation was found in the sub-surface (Fig. 8(c)). When the breakdown happened on the frictional pairs, plastic flows were found after rolling. The thickness of the flow layer was about 71.8 µm (standard deviation was 17.2 µm) under 5.5 V (Fig. 8(d)) and 168 µm (standard deviation was 26.9 µm) under 14 V (Fig. 8(e)). Since the contact load and rotating speed kept constant from Fig. 8(b) to Fig. 8(e), the mechanical effects could not induce the plastic deformation in Fig. 8(d) and Fig. 8(e) individually. In Figs. 8(f) and 8(g), the applied voltage (5.5 V) did not beyond the breakdown voltage (7.8 V and 6.7 V) at 1.51 m·s−1 and 1.00 m·s−1; no matter how the rotation speed increased, no plastic flow was found after rolling. Therefore, the plastic flow in Fig. 8(d) and Fig. 8(e) should be another appearance of electric damage after breakdown. These results demonstrated that breakdown was an critical reason for the electric damage of roller material.

OMM side-view of rolling tribo/electric frictional pairs under different rotation speeds and voltages. The breakdown voltage was 5.5 V, 6.7 V and 7.8 V at 0.50 m·s−1, 1.00 m·s−1 and 1.51 m·s−1 respectively. The red line represented the distorted grain boundary.
At the same time, SEM and EDS were carried out on the wear surface and the results were shown in Fig. 9 and Fig. 10. Some machining traces were found on the original surface (Fig. 9(a)), the surface roughness Sq (root mean square) was 1.255 µm and the atomic ratio of O:Cu was 0.0277 (Area 1 in Fig. 10(a)). After the mechanical rolling, the machining traces were pressed and deformed (Fig. 9(b)), the surface roughness was 1.074 µm. When a 3 V was applied during rolling, the wear surface was rolled flat and turned to be smooth (Fig. 9(c)), the surface roughness decreased to 0.627 µm. The atomic ratio of O:Cu was 0.0185 (Area 2 in Fig. 10(b)). This result was consistent with previous result during dry electric rolling in our previous work.10) The flatten of the wear surface was the consequence of combined effects of mechanical pressing and galvanothermy.10) When the voltage reached to 5.5 V, the wear surface became smoother and roughness was 0.602 µm. It was noted that an erosion pit was formed (Fig. 9(d)). The atomic ratio of O:Cu was 0.0248 on smooth area (Area 3 in Fig. 10(c)), and was 0.1283 on erosion pit (Area 4 in Fig. 10(d)). If the voltage increased to 14 V, porous zone could be observed on the surface, which should be related to the extremely high temperature of electric discharge.21) Therefore, compared to the mechanical rolling pairs, tribo/electric ones may withstand extra current heating and discharge erosion. After breakdown, erosion pits and melting would deteriorate the surface quality. Additionally, the surface discharge damages appeared at the same time with the subsurface plastic flow.

SEM images of rolling tribo/electric surface under different voltages at 0.50 m·s−1. The breakdown voltage was 5.5 V at 0.50 m·s−1.

EDS on selected area in Fig. 9.
According to the characterization in Figs. 7∼10, the electric damages on the lubricated rolling frictional pairs could be summarized as plastic flow in sub-layer and discharge erosion on the surface. The comparison of results in Figs. 7∼9 showed that breakdown was a necessary condition for these electric damages. However, such results also indicated that the breakdown was affected by two factors of rotation speed and applied voltage. Therefore, how to understand the variation of the breakdown behaviors at different speed was the key point to clarify the electric damage mechanism.
3.4 Discussion on electric damage mechanismAs was known that direct metal-metal contact in dry friction could be expressed as ohmic contact, while metal-oil film-metal contact in lubricated friction composed capacitive contact.22,23) According to Holm’s theory,24) tribo/electric contact happened on the rough surface (Fig. 11). After rolling, the surface roughness Sq (root mean square) was listed in Table 3. The rough asperities were surrounded by lubricant film, whose minimum thickness hmin could be estimated by Hamrock-Dowson model14) (Table 3). With the increase of the rotation speed from 0.13 m·s−1 to 2.01 m·s−1, the oil film thickness increased from 0.054 µm to 0.357 µm. The thickness to roughness ratio during the rolling (Table 3) increased from 0.101 to 0.612, indicating the boundary lubrication state. In this case, some prominent asperities might penetrate the oil film, forming micro ohmic contact r, while other oil-covered asperities formed capacitive contact c. The capacitive contact could block the DC current applied on the frictional pairs. The equivalent resistance R of the contact pairs was generated from the parallel connections of the micro ohmic contact r:
| \begin{equation} 1/R = 1/r_{1}+1/r_{2}+1/r_{3}+\ldots\ldots 1/r_{\text{n}} \end{equation} | (1) |
| \begin{align} 1/R &= 1/r_{1}+1/r_{2}+1/r_{3}+\ldots\ldots 1/r_{\text{n}}\\ &\quad +1/r_{\text{m1}}+1/r_{\text{m2}}+1/r_{\text{m3}}+\ldots\ldots 1/r_{\text{mk}} \end{align} | (2) |

Sketch map of rolling tribo/electric behaviors under lubrication condition.
Finally, the micro capacitances could be broken mostly when the applied voltage reached the breakdown value or higher. The threshold voltage for breakdown was decided by the oil film thickness.25) Therefore, it was observed that the breakdown voltage increased with the rotation speed (Fig. 6 and Table 3). After breakdown, the oil film formed membrane resistances between the rollers, which also depended on the oil film thickness (Fig. 4 and Table 3). Tischmacher reported the basic relationship between shaft current and rotation speed.18) The author suggested that the discharge of shaft current generated more easily at lower speeds because the lubricant film thickness decreased. The results on the single-point contact in this paper conformed to the previous results on real bearings very well.
Breakdown was a suddenly electric discharge between the insulating gaps, which would bring instant high temperature. The material in contact area should withstand the discharge heating and ohmic heating, so that the material deformed more easily because of the weakening of mechanical properties at high temperature.26,27) Under a lower voltage, the heating caused by partial local breakdown of micro capacitances might result in an easier flattening of the asperities on the contact surface (Fig. 9(c)). After the macro breakdown, the electric discharges should happen more frequently throughout the contact area. Based on the erosion pit and the porous structures on the highly discharged surface (Fig. 9(d) and Fig. 9(e)), it indicated that the temperature on the contact surface has already exceeded the melting point of Cu (1356.55 K).21,28) Inspired by the microstructures of welding area, it was speculated that the grains in the heat-affected-zone could be soften and then sheared by the friction force.29,30) Therefore, the plastic flow and discharge erosion could be observed simultaneously after breakdown (Fig. 8 and Fig. 9). The discharge temperatures should also exceeded the flash point temperature of PAO.31) The oil film could be destroyed and the metal in the discharged area should be exposed, consequently leading to oxidation (Fig. 10(d)).
In this paper, the typical failure induced by shaft current named “corrugation pattern”18) has not been observed probably because of the short testing periods. Besides, the dripping of oil could provide the fresh lubricant continuously. Therefore, the tribological failure has not yet been observed in macroscale (Fig. 3). However, the electric damages including discharge erosion and plastic flow have already formed on the contact surface when the applied voltage overstepped the breakdown value. It meant that whether the real-time voltage exceeding the breakdown criterion might provide an early warning signal for the safety of the lubricated tribo/electric contact pairs. According to the results in Fig. 2 and Fig. 5, it could propose a fast and convenient method to determine the breakdown voltage. Compared to the dry electric contact pairs, the lubricated pairs showed much lower friction coefficient and higher wear resistances.32) Nevertheless, the lubrication film would result in the deterioration of conductivity and the undesirable discharge erosion. The results may provide useful supporting for the safety operation and failure analysis of bearings and conductive rotating joints.
Rolling tribo/electric contact pairs with lubrication were realized by single-point disk-disk rollers with PAO 4 drips. The conductive behaviors and material damages was studied under various rotation speeds. The conclusions could be summered as:
This work was financially supported by National Natural Science Foundation of China (51775173, U1804252) and Project of National United Engineering Laboratory for Advanced Bearing Tribology (201809) and the State Key Laboratory of Alternate Electrical Power System with Renewable Energy Source (No. LAPS18010).
