Abstract
The discharge behavior of Mg-air battery consisting of AZ31 Mg alloy anode and a graphite-based air cathode was investigated under constant discharge current densities of up to 40 mA cm−2. Discharge with higher current density increased the power density, which reached its maximum value of 25 mW cm−2 at 30 mA cm−2. Further discharge caused the cell voltage to drop and fluctuate. Electrochemical impedance spectra of the Mg anode revealed specific trajectories according to the discharge current. A new electrical equivalent circuit modeling the dissolution at the Mg anode was proposed. After checking its validity, the dependence of the circuit elements on the discharge current was analyzed. A discharge product in the form of hydrotalcite was preferentially formed under high current discharge, which was gradually transformed to Mg(OH)2 and Al2O3. Higher discharge current promoted uniform dissolution of the Mg anode and improved the anodic efficiency. The removal of Al–Mn intermetallic particles was considered as the cause, which was verified by SEM/EDS analysis. Considering the anode kinetics and the performance of the air cathode, the optimal operation condition of 30 mA cm−2 discharge was proposed for the present Mg-air battery configuration.

1. Introduction
Magnesium (Mg) has a negative standard electrode potential of −2.37 V and a high Faradaic capacity of 2.205 Ah·g−1, which are attractive features for battery anodes. Magnesium primary batteries,1) sea water-activated Mg batteries2,3) have been developed and widely used. The research and development of Mg-ion secondary batteries is currently underway.4,5)
Mg-air batteries (MABs) equipped with air cathodes, have attracted attention as small-to-middle sized power supplies for emergency or outdoor purposes.6,7) While Mg anodes are stable in dry atmosphere by forming an oxide film, they are quickly activated in contact with a neutral aqueous electrolyte such as NaCl. As atmospheric oxygen acts as a reactant, MABs can generate electricity until the Mg anode is exhausted. This ensures long storage life, easy operation, and safe disposal of used MABs.
There are reviews8) and articles discussing the discharge performance of MAB anodes9–13) air cathodes,14,15) and the electrolyte.16) Studies of Mg anodes have been well conducted, since they are consumable and critical for ensuring cell voltage and anodic efficiency. Commercial Mg–Al alloys such as AZ31 (Mg–3%Al–1%Zn–0.3%Mn, % in mass) and AZ91 (Mg–9%Al–1%Zn–0.3%Mn) have been widely utilized for their low cost and good corrosion resistance.9,10) Special Mg alloys were developed for obtaining high discharge capacities.11–13) Most of MAB studies are conducted under moderate current around 10–20 mA cm−2 9–11) or using half-cell configurations12) to provide stable discharge conditions. Aside from the material aspects, the discharge performance is influenced by the operation conditions as discharge current densities,11,13) ambient temperature,13) and the full cell configurations that limit the electrolyte volume.11) Insoluble discharge products are gradually accumulated on the anode surface at the bottom of the cell. It would be useful if one can monitor how such conditions influence the discharge behavior of MAB. Electrochemical impedance spectroscopy (EIS) is widely used for analyzing electrochemical phenomena as corrosion, surface treatment and batteries.17) There seems to be few EIS studies to monitor the discharge performance of MAB, or Mg alloys in anodically polarized condition.18,19)
The present work investigated the effect of discharge current on a commercial MAB. The electrode potential and electrochemical impedance of AZ31 Mg anode were simultaneously monitored under the constant current discharge up to 40 mA cm−2. The impact of discharge current on the discharge products, surface roughness and the anodic efficiency of Mg electrode was also discussed.
2. Experimental Procedure
Rolled AZ31 Mg alloy plates (supplied by Osaka-Fuji Corp.) were cut to 25 mm × 50 mm × 1 mm and used as the Mg anode. The chemical composition is listed in Table 1.

Table 1 Chemical composition of Mg anode in mass percent.
The surface was polished with SiC abrasive paper up to 1000 grit and cleaned with ethanol and pure water. A commercial air cathode used for MAB (supplied by ARV Corp., MG201) was employed and cut to the same size as the Mg anode. Main composition was graphite, metal oxide catalyst, and binder.20) A test cell enclosure for MAB (supplied by EC frontier, model EC-1) was employed. The anode and cathode were facing each other across 10 mm distance, which was similar to MG201. The surface area was regulated as 3.14 cm2 by using a Viton ring. Saturated Ag/AgCl electrode was used as the reference electrode and placed between the above-mentioned electrodes. 10 mass% NaCl solution was used as the electrolyte by pouring into the cell.
The constant current discharge test was performed under current densities (id) of 5, 10, 20, 30, and 40 mA cm−2. The test period (t) was chosen such that the total discharge (q) was 324 C cm−2. The potential of the anode (Ea), cathode (Ec), and cell voltage (Vcell) were monitored. EIS of the anode was performed in galvanostatic mode using Solartron Analytical ModuLab XM ECS. The amplitude of current input was set to 1% of the discharging current, and the frequency response from 10 kHz to 1 Hz was acquired. The spectrum was analyzed with a curve fitting software (supplied by Scribner Associates, ZView ver. 3.5). The discharge test was carried out at room temperature and repeated at least three times to verify the reproducibility.
After the test, the discharge product was collected from the anode surface and analyzed by XRD using Rigaku Ultima III. The anode was further cleaned in 10 mass% boiling CrO3 solution to measure the weight loss. Anodic efficiency (η) was calculated by the following equation:
| \begin{equation}
\eta = i_{d}\cdot A\cdot t\cdot M/2F (W_{i} - W_{f})\times 100
\end{equation}
| (1) |
where
A the surface area (3.14 cm
2),
M the atomic mass of Mg (24.3 g mol
−1),
F Faraday constant (96485 C mol
−1),
Wi and
Wf the weights of the anode before and after the discharge test (mg), respectively.
The surface roughness of the anode after cleaning was measured by Mitsutoyo SJ-500. Linear scanning was conducted three times and the average value (Ra) was calculated. The surface was further characterized with SEM/EDS using JEOL JSM-IT500.
3. Results and Discussions
3.1 Electrode potentials and cell voltage
Figure 1 shows the time evolution of Ea, Ec, and Vcell for id at 10, 30, and 40 mA cm−2. At 10 mA cm−2, Ea and Ec reached their steady state values quickly and provided a constant Vcell of around 1.1 V. Vcell dropped at higher id due to the polarizations of the anode and cathode. In addition, a certain period was needed to attain the steady state values. At 40 mA cm−2, Vcell fluctuated intermittently. While the large fluctuations were mostly attributed to Ec, Ea contributed to some spike-like changes that appeared in Vcell. Figure 2 shows the Ea, Ec, and power density (p) at the end of discharge. The value p reached its maximum of 25 mW cm−2 at 30 mA cm−2, which corresponds to Vcell of 0.8 V.
3.2 Electrochemical impedance spectroscopy of Mg anode
Figure 3 shows typical Nyquist and Bode plots of the Mg anode at the end of discharge. The trajectory revealed both capacitive and inductive behaviors, depending on the frequency region. There are several EIS studies of pure Mg or Mg alloys corroding in NaCl solution.19,21–24) King et al.19) proposed an electrical equivalent circuit of pure Mg corroding in NaCl solution, shown in Fig. 4(a), that simulated the spectrum using two capacitive loops and one inductive loop. The circuit consists of series of resistances (Rs, R1, R2, R3), capacitances (C1, C2), and an inductance (L1), where Rs is the solution resistance. Curioni et al.21) adopted the same circuit and interpreted the physical meaning of each element. The validity of the circuit was experimentally confirmed with AZ31 alloy corroding in NaCl solution.22,23) The same circuit was applied to the present study, but no convincing results were obtained, especially for simulating inductive behaviors observed in the low-frequency region. Then, referring to King’s model, a circuit was newly devised by adding one R-L element (R4 and L2) in parallel, as shown in Fig. 4(b). Curve fitting was carried out using a simulation software and the result was superimposed in Fig. 3. To judge the validity of the proposed circuit, the residuals of the impedance ΔRe(ω) and ΔIm(ω)24) were calculated as;
| \begin{equation}
\varDelta \mathit{Re}(\omega_{\iota}) = (Z_{\textit{Re}}(\omega_{\iota})-\skew3\check{Z}_{\textit{Re}}(\omega_{\iota}))/|Z(\omega_{\iota})|
\end{equation}
| (2) |
and
| \begin{equation}
\varDelta \mathit{Im}(\omega_{\iota}) = (Z_{\textit{Im}}(\omega_{\iota})-\skew3\check{Z}_{\textit{Im}}(\omega_{\iota}))/|Z(\omega_{\iota})|
\end{equation}
| (3) |
Here,
ZRe(ω
ι) and
ZIm(ω
ι) are the real and imaginary parts of the measured impedance at the angular frequency ω
ι (= 2π
fi),
$\skew3\check{Z}_{Re}(\omega _{\iota })$ and
$\skew3\check{Z}_{Im}(\omega _{\iota })$ are the real and imaginary parts of the fitted impedance, and
fi is the
ith frequency (Hz). The cumulative error
XIm2 between the actual and modeled imaginary parts
24) is given as;
| \begin{equation}
X_{\textit{Im}}{}^{2} = \frac{1}{N}\sum\nolimits_{i = 1}^{N}\Delta \mathit{Im}(\omega_{i})^{2}
\end{equation}
| (4) |
where
N is the number of frequency points of the impedance spectrum.
Figure 5 shows the frequency dependence of the residuals obtained from the spectra of Fig. 3. The values were fit within ±3% throughout the frequency range, and exhibited good agreement with the proposed model.

The dependence of circuit elements on id are illustrated in Fig. 6. XIm2 was around 10−4 regardless of id, suggesting that the prediction based on the set of modeled elements resulted in a similar degree of fitting. Except C1 and R2, the parameters vary in proportion or inverse proportion with id. The value of C1 is around 30 µF cm−2, which corresponds to electrochemical double layer. In contrast, C2 increases with id, which could be attributed to the capacitive behavior of oxide/hydroxide film. The resistive elements of the equivalent circuit have a close relationship with the actual corrosion rate.17) Polarization resistance (Rp) can be evaluated from the zero-frequency impedance (f → 0) at −ZIm = 0. On the other hand, charge transfer resistance (Rt) is obtained from the impedance maximum. In both cases, the solution resistance Rs is subtracted. It is reported that the reciprocals of both parameters (Rp−1 and Rt−1), naming conductance, are in good correlation with the corrosion rate.19,21,23) In the proposed circuit of Fig. 4(b), the values are derived as
| \begin{equation}
R_{p}{}^{-1} = 1/(R_{1} + R_{2}) + 1/(R_{3} + R_{4})
\end{equation}
| (5) |
and
| \begin{equation}
R_{t}{}^{-1} = 1/(R_{1} + R_{2})
\end{equation}
| (6) |
Figure 7 exhibits the relationships of conductance values with id. They show good linearities up to 20 mA cm−2, but start to deviate with further increase in id. The origin of the deviation is related to the increase of R2 with id higher than 30 mA cm−2, which will be discussed in the later section.
Inductive behaviors are often observed in Mg corrosion. The relaxation of adsorbed species such as Mg(OH)ads+ or Mg(OH)2,25,26) the occurrence of pitting,27) or the increase/decrease in the area of anode sites21) are considered to be the origins of such behaviors. King et al.19) reported an enhancement in the inductive behavior when performing EIS on Mg above the free corrosion potential, which supports our results shown in Fig. 6(c). In addition, our analysis clearly indicates the presence of two inductive elements. Since such behavior has not been reported in corrosion studies, it would be a phenomenon specific to the anodic dissolution of Mg under high current densities.
3.3 Analysis of discharged product
During the discharge test, the cell enclosure was gradually filled with discharged product. Figure 8 shows the side view of the cell and the anode surface at the end of test. At 5 mA cm−2, a white product appeared above a gray product; the former appears as a crust with a few mm thickness, the latter deposited as sediment at the bottom of the cell. In case of 40 mA cm−2 discharge, only a white and flocculent precipitation was visible. The anode surface at 5 mA cm−2 discharge was covered by a gray product. The product layer was thin which was easily removed by running water. In case of 40 mA cm−2 discharge, a solid gray crust was observed. After removing the crust, a thick and dense gray product laid behind. XRD was used to characterize the product found at 40 mA cm−2, and the results were shown in Fig. 9. From peak analysis, Mg(OH)2, Al2O3, and Mg6Al2(OH)16CO3 4H2O (hydrotalcite) were identified. It is interesting to note that hydrotalcite was only found in the gray product. In the white product, instead, peaks relating to Al2O3 and Mg(OH)2 were detected. Furthermore, it was found that the color of the gray product changed to white if the cell was left in ambient atmosphere for 2–3 days after the discharge. Therefore, it was supposed that hydrotalcite was not chemically stable and gradually transformed to white Mg(OH)2 and Al2O3 in the electrolyte.

Table 2 shows the anodic efficiency η and the surface roughness Ra of the Mg anode after cleaning in CrO3 solution. The value of η below 100% suggests the self-discharge of Mg anode.13) The present result of η between 50 and 70% is within the range observed in previous studies.13) The value of η tends to increase with higher id. Similar trend was observed for Ra.
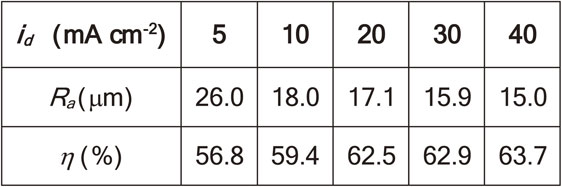
Table 2 Surface roughness and anodic efficiency for different discharge current.
Figure 10 shows the SEM images and element mapping analyses of Mg, Al, and Mn of the Mg anodes with different id. The dimpled surface caused by the anodic dissolution was less prominent at higher id. In the Mg mapping, color loss sections with the size of 10 µm or less were observed. Instead, Al and Mn signals were detected at these sections, suggesting the presence of Al–Mn intermetallic particles (IMPs) as Al4Mn or Al6Mn.28) It is seen that the number of large-sized IMPs were selectively reduced on the surface at higher id.
3.5 Effect of discharge current on the performance of Mg anode
The above studies indicate that id influences the discharge performance of MAB in various aspects. When id is low, Ea presents a constant value during discharge. As id increases, Ea shifts to more positive values and starts fluctuating. Srinivasan et al.18) reported the phenomenon of rapid change in current (1–5 mA cm−2) for anodically potential controlled AZ31 alloy in a simulated body fluid. They interpreted the change in terms of the breakdown and repair of the passive film formed on the surface. In our study, corrosive 10 mass% NaCl was chosen as the electrolyte, in which AZ31 corrodes actively even in open circuit condition. Rather, the fluctuation in Ea is associated with the accumulation of discharged products shown in Fig. 8. This phenomenon was also appeared in the increase in R2 in Fig. 6(a) which leads the deviations from the linearity of Rt−1 and Rp−1 in Fig. 7 at id higher than 30 mA cm−2. According to Curioni et al.,21) R2 accounts for the process of electron transfer. The increase of R2 regardless of higher id suggests the process of anode kinetics seems altered under the present MAB configuration.
The improvement of anodic efficiency and the smaller surface roughness with higher id are also noticeable. These phenomena seem to have a close relation with the disappearance of large-sized Al–Mn IMPs in Fig. 10(b). It is known that they are electrochemically noble with respect to the Mg matrix. As a result, they tend to act as micro-cathodes and accelerate the corrosion of the Mg matrix surrounding them, while remaining on the surface.28) Application of higher id shifts Ea in the noble direction so that the cathodic activity of IMPs was reduced. In addition, a concomitant flow of hydrogen gas which occurs as the result of self-discharge reaction of Mg anode, got more active and detached IMPs from the surface. As a result, smoother surface was observed at higher id. The removal of IMPs also suppresses the self-discharge reaction of Mg anode and improves the anodic efficiency. On the other hand, higher id generates the solid crust and dense discharge products on Mg anode that influence Ea and R2. The formation of discharge products with different crystal structure remains uncertain. Still, the flocculent nature of precipitations would interfere the removal of discharged products for continuous operation of MAB.15)
As shown in Fig. 2, the maximum power density was obtained at 30 mA cm−2. All these facts can lead to conclude that the optimum operation condition of the present MAB is discharging with id of 30 mA cm−2 or less.
3.6 Effect of discharge current on the performance of air cathode
As seen in Figs. 1 and 2, the increase in id also resulted in a negative impact on the air cathode. A close look at Fig. 1 revealed that the cathode exhibited a negative value at the start that gradually recovered to a more positive value. Discharge under higher id made this phenomenon more prominent. In addition, the voltage did not attain a constant value, but rather varied irregularly. It is likely that this behavior presents the limit of its discharge performance. Thus, a discharge current of 30 mA cm−2 or less is also preferable from a viewpoint of air cathode. Compared to alkaline Zn–MnO2 batteries, MABs are no good at high current discharge.8) This is attributed to the sluggish kinetics of oxygen reduction reaction in neutral NaCl solution. The development of an efficient oxygen catalyst is required to improve the performance of existing MAB.
4. Conclusion
The discharge behavior of MAB with AZ31 alloy anode and air cathode was investigated by constant discharge tests up to current densities of 40 mA cm−2 in 10 mass% NaCl solution. The results are summarized as follows:
-
(1)
Under 10 mA cm−2 discharge, the anode and cathode potentials quickly reached the constant value of 1.1 V. An increase in the discharge current induced polarization of both the electrodes and lowered the cell voltage, accompanied by some fluctuation. The power density reached its maximum value of 25 mW cm−2 at 30 mA cm−2, with the cell voltage being 0.8 V.
-
(2)
EIS spectra of the Mg anode revealed trajectories with two capacitive and two inductive loops. A new electrical equivalent circuit of the Mg anode dissolving in NaCl electrolyte was proposed. The features of each circuit element were analyzed. The reciprocal of the resistive element in the discharge kinetics showed good linearity with id up to 20 mA cm−2.
-
(3)
White- and gray-colored discharge products were gradually accumulated in the cell. The gray product was densely accumulated at higher discharge current. XRD analysis identified the gray product as Mg(OH)2 and Mg6Al2(OH)16CO3 4H2O, whereas the white product consisted of Mg(OH)2 and Al2O3.
-
(4)
Surface roughness and anode efficiency were improved by higher discharge currents. The SEM/EDS analysis revealed the removal of Al–Mn IMPs on the discharged electrode surface. It is likely that the application of higher discharge current diminished the micro-galvanic corrosion between Al–Mn IMPs and the Mg matrix.
-
(5)
Discharge below 30 mA cm−2 was found to provide the optimum performance of the Mg anode, which was also preferable for the stable operation of the paired air cathode.
REFERENCES
- 1) P.J. Spellman: Linden’s Handbook of Batteries, ed. by T.B. Reddy, (McGraw-Hills, New York, 2011) 10.1–10.13.
- 2) R.D. Lucero and A.P. Karpinski: Linden’s Handbook of Batteries, ed. by T.B. Reddy, (McGraw-Hills, New York, 2011) 34.1–34.7.
- 3) Q. Liu, Z. Yan, E. Wang, S. Wang and G. Sun: Int. J. Hydrogen Energ. 42 (2017) 23045–23053.
- 4) P. Saha, M.K. Datta, O.I. Velikokhatnyi, A. Manivannan, D. Alman and P.R. Kumta: Prog. Mater. Sci. 66 (2014) 1–86.
- 5) H.D. Yoo, I. Shterenberg, Y. Gofer, G. Gershinsky, N. Pour and D. Aurbach: Energy Environ. Sci. 6 (2013) 2265–2279.
- 6) A. Ito, H. Abe, M. Kubota, Y. Taira, H. Inazuka, K. Saita, T. Takahara and Y. Ono: FB Technical News 70 (2014) 23–27.
- 7) K. Yamazaki: Proc. 73rd Ann. Mg World Conference, (Intl. Mg Assoc., 2016) pp. 83–88.
- 8) T. Zhang, Z. Tao and J. Chen: Mater. Horiz. 1 (2014) 196–206.
- 9) G. Huang, Y. Zhao, Y. Wang, H. Zhang and F. Pan: Mater. Lett. 113 (2013) 46–49.
- 10) M. Yuasa, X. Huang, K. Suzuki, M. Mabuchi and Y. Chino: Mater. Trans. 55 (2014) 1202–1207.
- 11) M. Yuasa, X. Huang, K. Suzuki, M. Mabuchi and Y. Chino: J. Power Sources 297 (2015) 449–456.
- 12) N. Wang, R. Wang, C. Peng, B. Peng, Y. Feng and C. Hu: Electrochim. Acta 149 (2014) 193–205.
- 13) N. Wang, R. Wang, C. Peng, C. Hu, Y. Feng and B. Peng: Trans. Nonferrous Met. Soc. China 24 (2014) 2427–2439.
- 14) C. Shu, E. Wang, L. Jiang and G. Sun: Int. J. Hydrogen Energ. 38 (2013) 5885–5893.
- 15) Y. Milusheva, R.I. Boukoureshtlieva, S.M. Hristov and A.R. Kaisheva: Bulg. Chem. Commun. 43 (2011) 42–47.
- 16) M. Mayilvel Dinesh, K. Saminathan, M. Selvam, S.R. Srither, V. Rajendran and K.V.I.S. Kaler: J. Power Sources 276 (2015) 32–38.
- 17) M.E. Orazem and B. Tribollet: Electrochemical Impedance Spectroscopy, 2nd ed., (Wiley, Hoboken, 2017).
- 18) A. Srinivasan, K.S. Shin and N. Rajendran: RSC Advances 4 (2014) 27791–27795.
- 19) A.D. King, N. Birbilis and J.R. Scully: Electrochim. Acta 121 (2014) 394–406.
- 20) S. Natsume and Y. Ando: Japanese Patent, 2012.9.27.
- 21) M. Curioni, F. Scenini, T. Monetta and F. Bellucci: Electrochim. Acta 166 (2015) 372–384.
- 22) M.C. Delgado, F.R. García-Galvan, I. Llorente, P. Pérez, P. Adeva and S. Feliu, Jr.: Corros. Sci. 123 (2017) 182–196.
- 23) M. Ohara, I. Nakatsugawa, Y. Matsumoto, F. Kido, T. Matsumoto and S. Saikawa: Collected Abstracts of the 2018 Autumn Meeting of the Japan Institute of Light Metals, (2018) pp. 113–114.
- 24) M. Schönleber, D. Klotz and E. Ivers-Tiffée: Electrochim. Acta 131 (2014) 20–27.
- 25) G. Baril and N. Pébère: Corros. Sci. 43 (2001) 471–484.
- 26) G. Galicia, N. Pébère, B. Tribollet and V. Vivier: Corros. Sci. 51 (2009) 1789–1794.
- 27) Y. Song, D. Shan, R. Chen and E.-H. Han: Corros. Sci. 51 (2009) 1087–1094.
- 28) L.G. Bland, N. Birbilis and J.R. Scully: J. Electrochem. Soc. 163 (2016) C895–C906.


