Abstract
Internal stress generated by athermal martensitic transformation from fcc (face-centered cubic) to hcp (hexagonal close-packed) was investigated in 18Cr–8Ni metastable austenitic stainless steel. Lattice parameter ratio of hcp-martensite, c/a, formed by subzero treatment was evaluated accurately by means of electron back scatter diffraction technique. The evaluation revealed that hcp-martensite surrounded by fcc-austenite matrix has obviously higher c/a compared with the reference value in the case when hcp-martensite exists in a single body, and the c/a is continuously increased with increasing the aspect ratio of the plate-shaped hcp-martensite. However, additional formation of martensite with bcc (body centered cubic) reduced the c/a of hcp-martensite suddenly. From the point of view of micromechanics, it can be concluded that internal stress is dynamically increased by the thickening of plate martensite on fcc-hcp martensitic transformation, and the subsequent hcp-bcc martensitic transformation is stimulated to accommodate the internal stress.
1. Introduction
Martensitic transformation characterized by diffusionless and shear mechanism has been applied for many functional and structural materials, because it is able to give some good mechanical properties, e.g. superelasticity, shape memory effect, high strength and toughness. The martensitic transformation is classified into two types; thermoelastic and non-thermoelastic martensitic transformations, depending on a degree of transformation strain from parent to martensite phases, and generally martensitic transformation in steel is categorized as the later one. Transformation strain in non-thermoelastic martensitic transformation is so large that large driving force is needed to start martensitic transformation, resulting in a transformation hysteresis curve with wide temperature gap. Such large transformation strain can’t be stored as elastic strain in parent and martensite phases, and as a result, a lot of lattice defects, i.e. dislocations and twins, are introduced by lattice invariant shear. Since the high density of lattice defects has large influence on mechanical properties, the density and distribution of dislocations and twins are payed careful attention in non-thermoelastic martensitic transformation.1–3)
However, residual elastic strain should be also highly considered, because a significant amount of elastic strain may remain even in non-thermoelastic martensitic transformation accompanied with lattice invariant shear. Recently, Archie et al.4) employed focused ion beam (FIB) milling technique to investigate local residual strain which distributes in lath martensite of medium-carbon steel. They reported that a micrometer sized cylindrical pillar, which is fabricated within a couple of martensite blocks, anisotropically deforms during FIB milling to relax the residual strain originated from martensitic transformation. Furthermore, Hutchinson et al. proposed that gradual yielding of quenched martensite is attributed to heterogeneous microscale residual stresses and demonstrated that the presence of microscale residual stresses in martensite generated on martensitic transformation is the most importance factor controlling yielding behavior on loading by using the combination of in-situ synchrotron diffractometry and crystal plasticity finite element modelling.5,6) According to their studies, the residual internal stress may affect phase transformation behavior after martensitic transformation, such as precipitations of carbide and austenite, as well as its mechanical properties. Therefore, it is important to evaluate elastic strain developed via martensitic transformation accurately for further understanding on microstructure and mechanical properties of martensite in steels.7,8)
In the present study, we focused on the internal stress generated by the martensitic transformation from austenite with face-centered cubic crystal structure (fcc) to martensite with hexagonal close-packed crystal structure (hcp) in a metastable austenitic stainless steel. In particular, electron back scatter diffraction (EBSD) technique is applied to locally evaluate lattice parameter ratio of plate-shaped hcp-martensite formed in fcc-austenite matrix. And the variation of the lattice parameter ratio depending on aspect ratio of plate-shape and the subsequent formation of martensite with body-centered cubic structure (bcc) was discussed in terms of micromechanics.
2. Experiment Procedure
2.1 Material and heat treatment
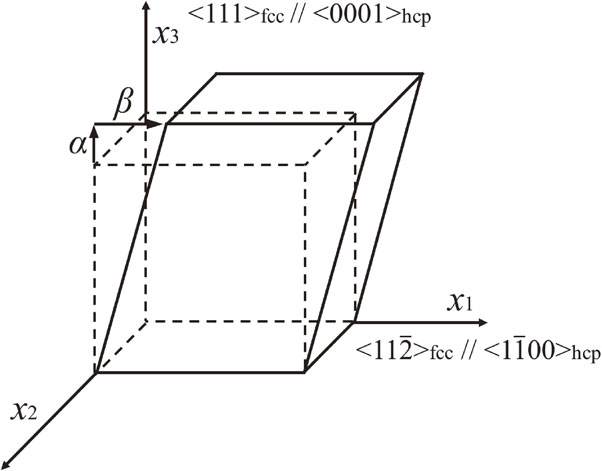
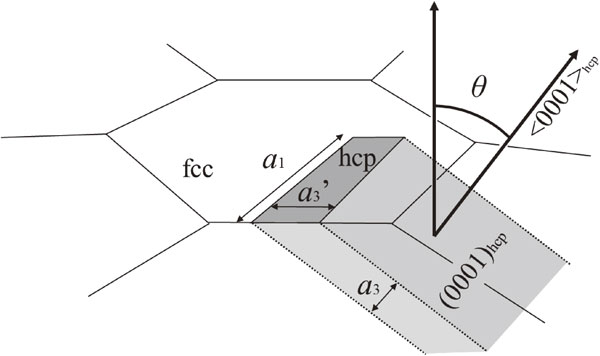
Type 304 metastable austenitic stainless steel (C: 0.051, Cr: 18.24, Ni: 8.13, Mn: 1.02, Si: 0.48, P: 0.033, N: 0.002, S: 0.002, mass%) was used in this study. A specimen with 20 × 10 × 10 mm3 cut from a hot-rolled steel sheet was subjected to solution treatment at 1273 K for 1.8 ks, followed by water-cooling. The solution-treated material was then subzero treated at 253, 213, and 173 K for 1.8 ks to partially form hcp-martensite (ε) and bcc-martensite (α′) in fcc-austenite (γ) matrix. A cross-sectional surface of the subzero-treated material was electrolytically polished after mechanical grinding and buff polishing to remove a damaged layer. Microstructure was observed by means of optical microscopy (OM) and scanning electron microscopy (SEM: JSM-7001F developed by JEOL Ltd.) equipped with an electron backscatter diffractometer (EBSD). Detected EBSD pattern was analyzed by OIM Data Collection ver. 7.1.0. and the analyzed data were then displayed as inverse pole figure (IPF) or phase maps by using OIM analysis ver. 7.3.0. (developed by TSL solutions). SEM is operated at 17 kV and EBSD pattern was obtained with a step size of 0.2 or 0.02 µm. The morphology of hcp-martensite was also evaluated from the results of crystal orientation analysis. Assuming that each hcp-martensitic has a plate-shape with diameter a1 and thickness a3, its aspect ratio A is given by a3/a1. As schematically shown in Fig. 1, in general, the board face of a plate corresponding to the fcc/hcp interface (0001)hcp // (111)fcc does not exist perpendicular to the observation surface, therefore the thickness a3′ of hcp-martensite measured on the observation surface is different from the actual a3. Therefore, we estimated a3 using the angle that ⟨0001⟩hcp makes with the normal direction of the observation surface.
A local lattice parameter ratio of hcp-martensite located in fcc-austenite matrix was measured by EBSD in order to evaluate its internal stress state.9) In EBSD orientation analysis, after the position and angle of individual bands of EBSD pattern are transformed in Hough space, an angle between any two bands was calculated in order to identify the crystal structure and orientation. Therefore, the result in EBSD analysis does not depend on individual lattice parameters but on lattice parameter ratio of a crystal. In the above orientation analysis, detected EBSD pattern is compared with a reference one theoretically predicted by specified crystal structure and lattice parameters in the Hough space. The deviation in angle between actual and reference bands is measured as Fit value, and consequently, the crystal orientation with the smallest Fit value is regarded as the most optimal orientation. Since the hcp-martensite is identified by individual two lattice parameters along a and c axes, a and c respectively, the lattice parameter ratio, c/a, can be evaluated by the EBSD technique. In this research, several thousand EBSD data points obtained in a ε plate were reanalyzed by changing c arbitrarily while keeping a = 0.2473 nm in OIM Data Collection to evaluate average Fit value. After the investigation of change in the value with respect to c/a, the c/a with the minimum Fit value was evaluated as the accurate c/a of the ε phase.
2.3 Analysis of elastic strain in plate martensite by micromechanics
As shown in Fig. 2, a rectangular object existing in x1-x2-x3 coordinate system is deformed by simple shear along x1 axis in x1-x2 plane and normal tension along x3 axis. When the magnitude of shear strain and nominal strain are β and α, respectively, the deformation gradient tensor Fij and the displacement gradient tensor ui,j are given by eqs. (1) and (2), respectively, with Kronecker delta δij.
| \begin{equation}
F_{ij} =
\begin{pmatrix}
1 & 0 & \beta\\
0 & 1 & 0\\
0 & 0 & 1 + \alpha
\end{pmatrix}
\end{equation}
| (1) |
| \begin{align}
u_{i,j} = F_{ij} - \delta_{ij} &=
\begin{pmatrix}
1 & 0 & \beta\\
0 & 1 & 0\\
0 & 0 & 1 + \alpha
\end{pmatrix}
-
\begin{pmatrix}
1 & 0 & 0\\
0 & 1 & 0\\
0 & 0 & 1
\end{pmatrix}
\\
&=
\begin{pmatrix}
0 & 0 & \beta\\
0 & 0 & 0\\
0 & 0 & \alpha
\end{pmatrix}
\end{align}
| (2) |
If the strain ε
ij* of the deformation is infinitesimal, it is
| \begin{align}
\varepsilon_{\text{ij}}^{*} &=
\begin{pmatrix}
0 & 0 & \varepsilon_{13}^{*}\\
0 & 0 & 0\\
\varepsilon_{13}^{*} & 0 & \varepsilon_{33}^{*}
\end{pmatrix}
= \frac{1}{2}(u_{i,j} + u_{j,i}) \\
&=
\begin{pmatrix}
0 & 0 & \beta/2\\
0 & 0 & 0\\
\beta/2 & 0 & \alpha
\end{pmatrix}
.
\end{align}
| (3) |
When an ellipsoidal single inclusion with uniform eigenstrains εij* of eq. (3) is within an isotropic infinite body, elastic strain in the inclusion eij can be expressed by the following equation, as reported by Eshelby.10)
| \begin{equation}
e_{ij} = S_{ijkl}\varepsilon_{kl}^{*} - \varepsilon_{ij}^{*}
\end{equation}
| (4) |
Here,
Sijkl is Eshelby’s tensor. Given that the ellipsoidal inclusion has plate-shape perpendicular to the
x3 axis, and its size along
x1,
x2, and
x3 axes are
a1,
a2, and
a3, respectively (
a1 =
a2 ≫
a3),
Sijkl related to the nonzero component of
$\varepsilon _{ij}^{*}$ in
eq. (3) can be expressed as follows using the aspect ratio of the plate-shaped inclusion (
a3/
a1 =
A ≪ 1).
| \begin{equation*}
S_{3333} = 1 - \dfrac{(1 - 2\nu)}{4(1 - \nu)}\pi A
\end{equation*}
|
| \begin{equation}
S_{1133} = S_{2233} = -\dfrac{(1 - 2\nu)}{8(1 - \nu)}\pi A
\end{equation}
| (5) |
| \begin{equation*}
S_{1313} = S_{1331} = \dfrac{1}{2}\left\{1 - \dfrac{\pi}{4}\dfrac{(2 - \nu)}{(1 - \nu)}A\right\}
\end{equation*}
|
Here, ν is Poisson’s ratio. By substituting
eqs. (3) and
(5) into
eq. (4) with ν = 1/3,
eij is roughly described as follows.
| \begin{equation}
e_{ij} =
\begin{pmatrix}
-\dfrac{1}{5}A\alpha & 0 & - 2A\beta\\
0 & -\dfrac{1}{5}A\alpha & 0\\
-2A\beta & 0 & -\dfrac{1}{2}A\alpha
\end{pmatrix}
\end{equation}
| (6) |
When the plate-shaped inclusion is hcp phase, and
$\langle 1\bar{1}00\rangle _{\text{hcp}}$ and ⟨0001⟩
hcp are parallel to
x1 and
x3 axes, respectively, the lattice parameter ratio of inclusion of hcp,
c/
a, can be obtained by the following equation using α and
A.
| \begin{equation}
\frac{c}{a} = \frac{c_{0}(1 + e_{33})}{a_{0}(1 + e_{11})} = \frac{c_{0}}{a_{0}}\cfrac{\biggl(1 - \cfrac{1}{2}A\alpha\biggr)}{\biggl(1 - \cfrac{1}{5}A\alpha\biggr)}
\end{equation}
| (7) |
Here,
a0 and
c0 indicate the standard lattice parameters, when the hcp-inclusion exists as a single body. In addition, it is assumed here that Shoji-Nishiyama orientation relationship ((111)
fcc // (0001)
hcp,
$\langle \bar{1}10\rangle _{\text{fcc}}\parallel \langle 11\bar{2}0\rangle _{\text{hcp}}$) is held on fcc-hcp martensitic transformation. Therefore, shear direction
x1 is parallel to
$\langle 11\bar{2}\rangle _{\text{fcc}}$ and
$\langle 1\bar{1}00\rangle _{\text{hcp}}$. From the above viewpoint, the internal stress state in hcp-martensite can be evaluated by measuring
c/
a.
3. Results and Discussion
3.1 fcc-hcp and hcp-bcc martensitic transformations by subzero treatment
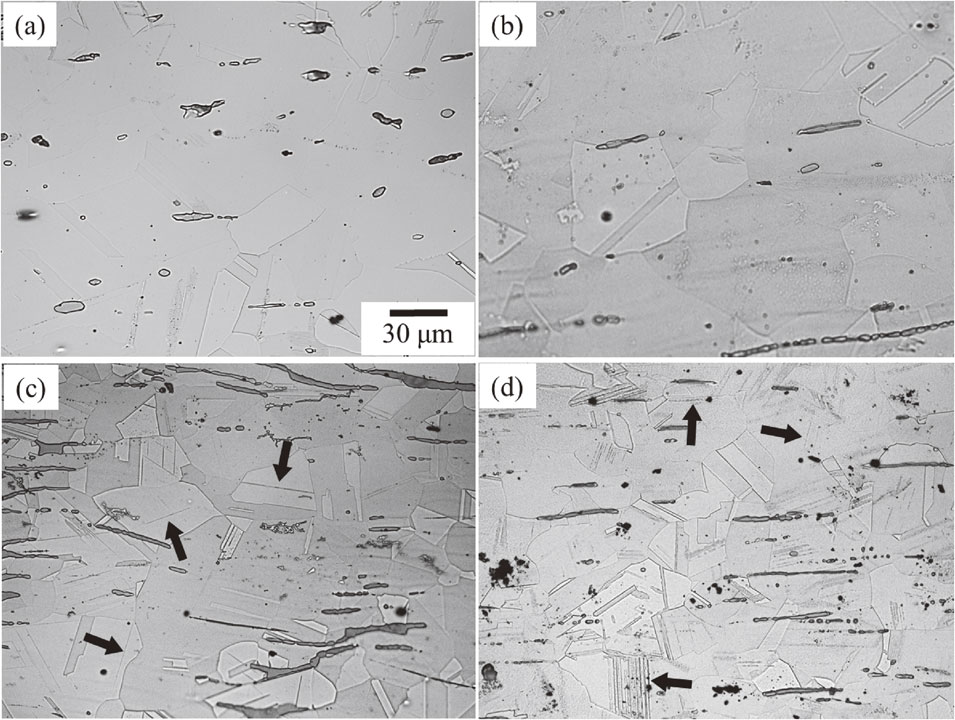
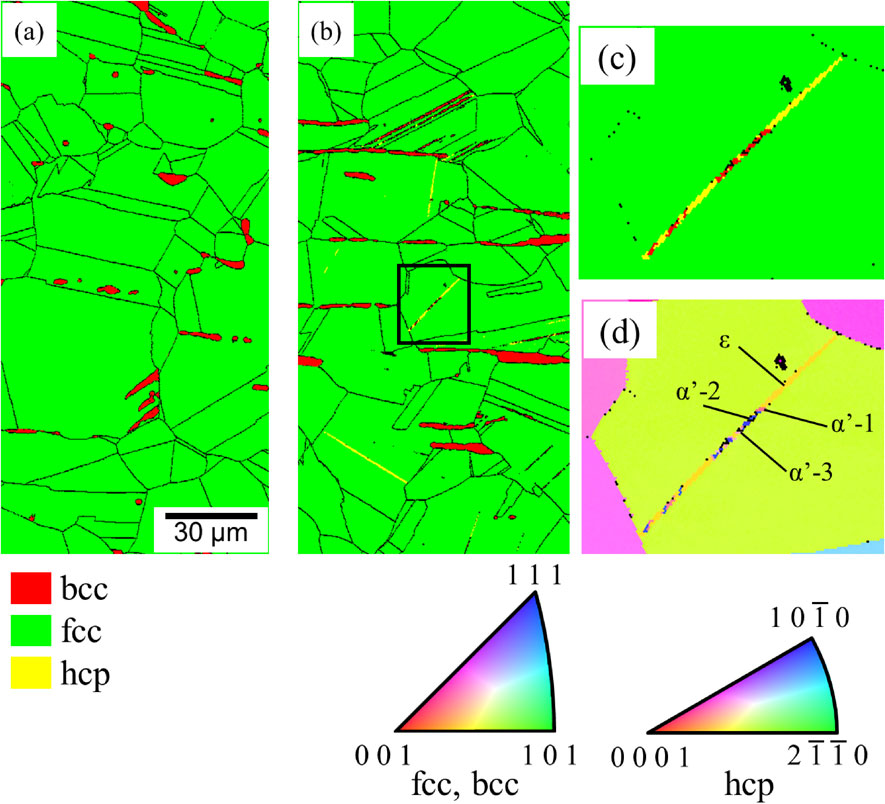
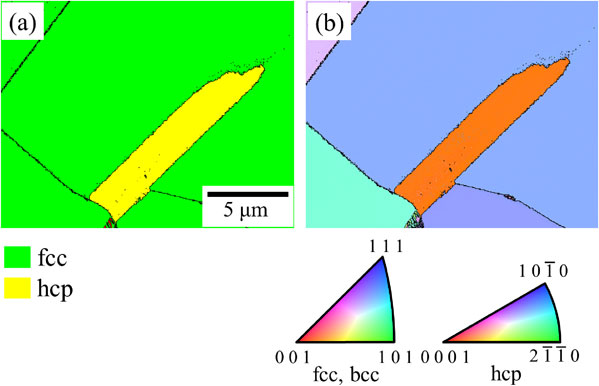
Optical micrographs of (a) solution-treated material and subzero-treated materials treated at (b) 253 K, (c) 213 K, and (d) 173 K are shown in Fig. 3. As shown in (a), the solution treated material had almost austenitic single phase with a small amount of elongated δ-ferrite, as mentioned later. The average austenite grain size considering annealing twin was measured to be 34 µm according to planimetric method of JIS standard (JIS G 0551). 253 K subzero-treated material also indicated austenitic single phase without any transformation products (b). In 213 K subzero-treated material (c), on the other hand, plate-like bands were often observed inside austenite grains as pointed by black arrows. Besides, the density of plate-like bands increased by lowering subzero treatment temperature as shown in (d). Figure 4(a) and (b) respectively indicates phase maps of solution-treated material and 213 K subzero-treated material. In these maps, fcc, hcp and bcc phases are colored in green, yellow and red, respectively, and high angle grain boundaries with misorientation higher than 15° are indicated by black lines. In both materials, the matrix phase is fcc-austenite, and it can be observed that blocky δ-ferrite grains elongate along the horizontal direction corresponding to the hot rolling direction. On the other hand, plate-like bands were formed in the subzero treated material, as confirmed by optical micrographs (Fig. 3(c), (b)). There are two types of microstructural features in the plate-like bands. One is formed by only hcp phase and the other is consisted of hcp and bcc phases. These observations show that subzero treatment induces athermal martensitic transformation. Furthermore, it is shown that martensitic transformation occurs in the order of fcc-hcp and hcp-bcc, as reported in the previous studies.11–13) And it became clear that the second hcp-bcc martensitic transformation can take place not only at the intersection of two plates of hcp-martensite but also in a single plate of hcp-martensite. The phase map (c) and IPF map (d) indicates the magnified image of the boxed segment in Fig. 4(b). Crystal orientation analysis was performed using the lattice parameters of each phase which are default values in the OIM Data Collection, and a highly reliable analysis data with higher CI (Confidence Index) value than 0.1 was used. The hcp- and bcc-martensite developed in the band-like shape, and it can be seen that some fine bcc-martensite grains are formed in a hcp-martensite plate. At this time, focusing on the crystal orientation of each phase, it can be seen that bcc-martensite has three different crystal orientations (α′-1, -2, -3), while hcp-martensite has a single orientation. Figure 5 indicates inverse pole figures showing crystal orientation relationships among fcc-austenite, hcp-martensite and bcc martensite. The close-packed plane and close-packed direction of each phase are represented by ● ((111)fcc, (0001)hcp, (011)bcc) and ■ (⟨011⟩fcc, $\langle 11\bar{2}0\rangle _{\text{hcp}}$, ⟨111⟩bcc), respectively. As indicated by the circles, it can be found that the three phases share the close-packed plane. In addition, the fcc-austenite and hcp-martensite are completely coincident in the three close-packed directions on the common close-packed plane. Furthermore, it is more interesting that a close-packed direction of three types of bcc-martensite corresponds to one of the close-packed directions of fcc-austenite and hcp-martensite, as indicated by squares. That is, the following orientation relationships are held in three phases.
| \begin{equation*}
(111)_{\gamma} \parallel (0001)_{\varepsilon} \parallel (101)_{\text{${\alpha'}$-1}} \parallel (101)_{\text{${\alpha'}$-2}} \parallel (101)_{\text{${\alpha'}$-3}}
\end{equation*}
|
| \begin{equation*}
\langle 1\bar{1}0\rangle_{\gamma} \parallel \langle 11\bar{2}0\rangle_{\varepsilon} \parallel \langle 11\bar{1}\rangle_{\text{${\alpha'}$-1}} \parallel \langle\bar{1}11\rangle_{\text{${\alpha'}$-2}} \parallel \langle 1\bar{1}1\rangle_{\text{${\alpha'}$-3}}
\end{equation*}
|
Shoji–Nishiyama orientation relationship was observed between fcc-austenite and hcp-martensite, and Burgers orientation relationship are also satisfied between hcp- and bcc-martensite. As a result, Kurdjumov-Sachs (K-S) orientation relationship is held between fcc-austenite and bcc-martensite. When bcc-martensite satisfies Burgers or K-S orientation relationship, six variants sharing the close-packed plane can be formed. However, the above analysis results revealed that only three variants of the six were preferentially nucleated, as similarly reported by Masumura
et al.14) These results suggest that hcp-bcc martensitic transformation is influenced by strong variant selection not only by crystallography but also by other factors, as discussed later.
3.2 Variation of local lattice parameter ratio in hcp-martensite
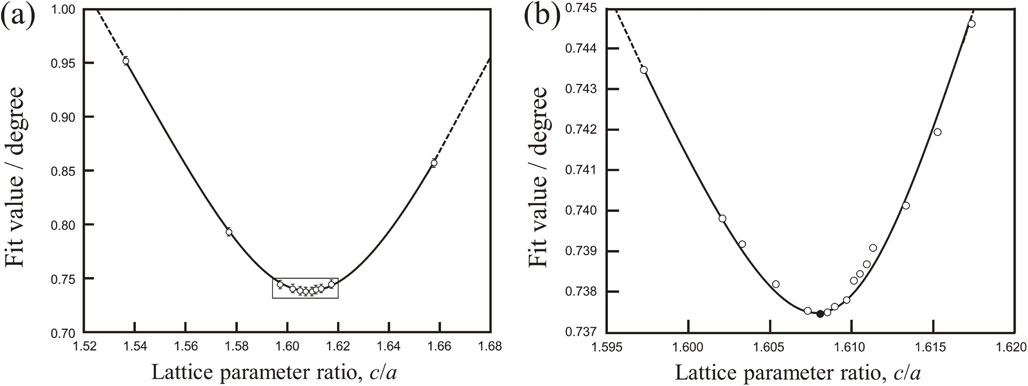
Figure 6(a) and (b) indicate the phase map and IPF map of the hcp-martensite plate formed alone in fcc-austenite matrix. It was confirmed that hcp-martensite is formed from an austenite grain boundary and extends in one direction toward the inside of the grain. The change in the average Fit value of the hcp-martensite plate as a function of c/a was displayed in Fig. 7. The area displayed by black frame in (a) was expanded in (b) with additional data. Since the number of EBSD data points (N) used for the analysis was over 4000, this evaluation reliability is thought to be high in terms of statistics. Therefore, standard error (SE) was calculated by the following equation with standard deviation (SD) of Fit value and then displayed in (a) as error bars.
| \begin{equation}
\mathit{SE} = \frac{\mathit{SD}}{\sqrt{N}}
\end{equation}
| (8) |
The average Fit value was changed continuously depending on
c/
a with very small standard error in (a), which demonstrates a high reliability in evaluation of
c/
a. Since the change of the average Fit value depending on
c/
a draws a convex curve downward,
c/
a = 1.608 with the minimum Fit value was determined as the lattice parameter ratio of the hcp-martensite, as pointed by solid circle in (b). There have been many studies to identify properties of hcp-Fe. In general, it is very difficult to obtain hcp-Fe experimentally, because it is stable phase under extremely high temperature and pressure. Boehler
et al. investigated the phase transformation of Fe and the crystal structure of hcp-Fe at various temperature and pressure conditions using diamond anvil cell experiments.
15) They reported that
c/
a of hcp-Fe decreases slightly with the increase of pressure
P [GPa] at room temperature, and the pressure dependence can be expressed by
eq. (9).
| \begin{equation}
\frac{c}{a} = 1.5963 + \frac{0.0131}{1 + \exp\biggl(\cfrac{P - 26}{47}\biggr)}
\end{equation}
| (9) |
Using the
eq. (9), the value of
c/
a at ambient temperature is estimated to be 1.6046 in atmospheric pressure. Although Mao
et al. reported that
c/
a of hcp-Fe is independent of pressure and equal at 1.603 ± 0.001, it is not much different from the Boehler’s estimation.
16) Therefore, these values are able to be judged as a reference
c/
a when hcp-Fe exists in a single body at ambient temperature. In this study, on the other hand,
c/
a of measured hcp-martensite plate had higher
c/
a. This fact strongly suggests that a plate hcp-martensite surrounded by austenite matrix is affected by internal stress.
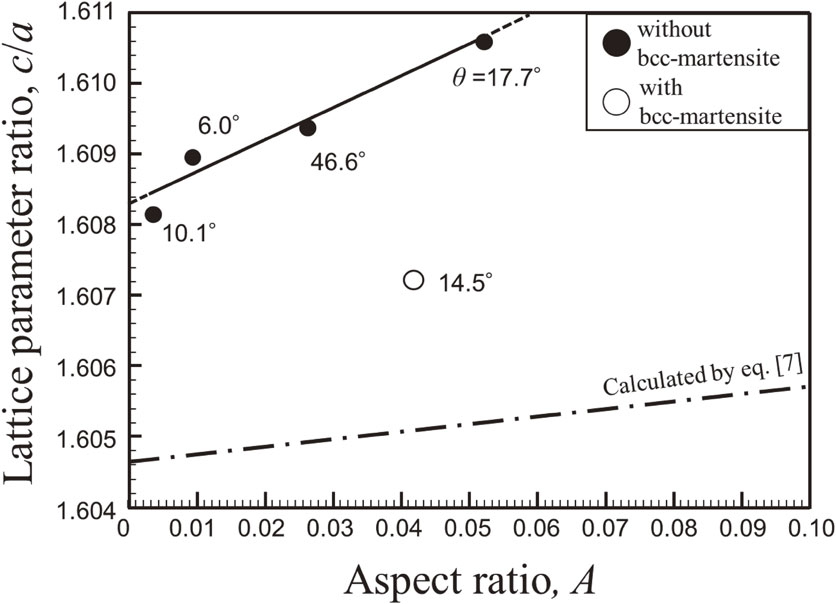
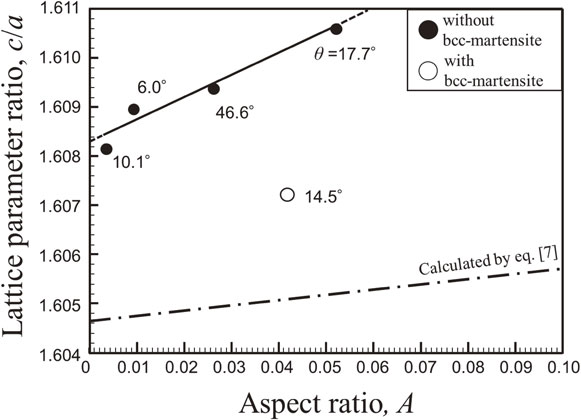
The similar analysis as Fig. 7 was carried out for some plates of hcp-martensite. Figure 8 summarized the variation of c/a with respect to the aspect ratio of plate hcp-martensite A. In this figure, each angle between ⟨0001⟩hcp and the surface normal direction θ is also shown (see Fig. 1). In addition, the theoretical variation of c/a depending on A given by eq. (7) is displayed by the dashed-dotted line. In this case, 1.605, which is the average value of the values reported by Boehler and Mao, was used as c0/a0. And also, we set α = −0.0174 based on the difference between the reference value and theoretical c/a = 1.633 which is predicted from the rigid sphere model. Focusing on the experimental results, we can see that the measured c/a increases lineally with the increase of A. This dependence of c/a on A is agree with the theoretical result estimated by micromechanics. The result clearly proves that the internal stress increases as the thickness of each hcp-martensite increases and grows. Here, we focus on the increase of elastic strain energy with the thickening of hcp-martensite plate. When the eigen strain and the elastic strain in an inclusion are given, the elastic strain energy E0 can be estimated by the following equation.
| \begin{equation}
E_{0} = -\frac{1}{2}\sigma_{ij}\varepsilon_{ij}^{*} = -\frac{1}{2}C_{ijkl}e_{kl}\varepsilon_{ij}^{*}
\end{equation}
| (10) |
Here,
Cijkl is elastic modulus. When the
eqs. (3) and
(6) are substituted into the
eq. (10),
E0 is described as follows.
| \begin{equation}
E_{0} = \mu A\left(2\beta^{2} + \frac{7}{5}\alpha^{2}\right)
\end{equation}
| (11) |
Here, we assumed that the matrix and inclusions are isotropic elastic bodies with the same elastic modulus of μ. The equation indicated that
E0 is given as a function of
A, and the elastic strain energy is zero if the martensite has completely thin plate shape with
A = 0. When hcp-martensite forms with thin plate shape, no elastic strain energy generates regardless of ε
33*, ε
13* and ε
23*, as pointed out by Kato
et al.17–19) In other words, it is concluded that the internal stress and elastic strain energy via fcc-hcp martensitic transformation must be generated by increasing the thickness of hcp-martensite plate.
On the other hand, E0 in eq. (11) is affected by β, in addition to A and α. This fact means that not only normal strain α but also shear strain β generate internal stress in the case of A ≠ 0. The shear mechanism of $\langle 11\bar{2}\rangle _{\text{fcc}}$ on (111)fcc by Shockley partial dislocation has been proposed for fcc-hcp martensitic transformation.13,20,21) If fcc-hcp martensitic transformation is caused by one kind of partial dislocation motion, β is calculated to be 0.35. However, fcc-hcp martensitic transformation is achieved by β = 0 when two other partial dislocations sharing (111)fcc act equivalently. In fact, Putaux et al. observed the edge of plate hcp-martensite in Fe–Mn austenitic alloy using high resolution electron microscopy and reported that the three kinds of Shockley partial dislocations act equivalently to make shear strain β zero.20)
In Fig. 8, it is found that there was a clear difference of the absolute value between the measured c/a and the theoretical one. Although the result is not clear so far, the effect of free surface should be mentioned in addition to the effect of alloying elements, such as Cr and Ni.22) The thickness a3 of plate hcp-martensite observed is approximately 100 to 650 nm. It is expected that the indexing of such thin phase is so difficult in EBSD analysis when it exists on the surface plane under edge-on condition. In fact, in pearlite, which is a fine lamellar eutectoid structure consisted of ferrite and cementite, it has been reported that analysis of cementite with lower crystallographic symmetry becomes difficult due to the overlapping with EBSD patter of ferrite when cementite lamellas are perpendicular to the observation surface.23) Actually, θ of each hcp-martensite plate was relatively small. Therefore, it can be understood that analysis of hcp-martensite can be performed by EBSD method unless (0001)hcp is close to parallel to the sample surface. From this viewpoint, hcp-martensite existing on the sample surface is thought to be less affected by the matrix, which causes an error in the absolute value of c/a.
3.3 Relaxation of internal stress by additional hcp-bcc martensitic transformation
The c/a of hcp-martensite with bcc-martensite grains (see Fig. 4(c)) was added as open circle in Fig. 8. This result clearly indicated lower c/a than the data of hcp-martensite without bcc-martensite indicated by the solid line. It strongly suggests that the elastic strain of hcp-martensite is relaxed by the formation of bcc-martensite. From this viewpoint, the elastic strain energy, which increases with the growth of hcp-martensite plate, acts as a driving force for hcp-bcc martensitic transformation in addition to the chemical driving force attributed to the difference in Gibbs energy between hcp and bcc. Therefore, it is thought that selected variants which can reduce total elastic strain energy more effectively are preferentially formed, leading to the variant selection shown in Fig. 4(c).
Figure 9 schematically illustrated the sequence of fcc-hcp and subsequent hcp-bcc martensitic transformations while taking internal stress into account. When hcp-martensite forms on super cooling under Ms temperature, it is expected that elastic strain energy is negligible due to its extremely thin plate-like structure (A ≅ 0) (a). However, elastic strain energy increases continuously with the growth of hcp-martensite plate (b). When this elastic strain energy exceeds a critical value, a preferential variant of bcc-martensite is stimulated to reduces the elastic strain energy (c). Therefore, the total elastic strain energy is reduced by the co-existence of hcp-martensite and bcc-martensite. It is well known that austenitic steels with low stacking fault energy, such as austenitic stainless steels and high Mn steels, hcp-martensite is preferentially formed in advance of bcc-martensite. From this study, it is thought that the preferential formation of hcp-martensite is reasonable mechanism to minimize the increase in elastic strain energy rather than the case of direct fcc-bcc martensitic transformation. In order to understand the mechanical properties of the final transformed structure, further studies are necessary such as the variant selection rule of bcc-martensite formed in hcp-martensite.

4. Conclusion
In order to investigate the internal stress generated via athermal martensitic transformation from fcc-austenite to hcp-martensite, lattice parameter ratio of plate-shaped hcp-martensite formed by subzero treatment was evaluated by using electron backscatter diffraction technique in 18 mass%Cr–8 mass%Ni metastable austenitic stainless steel. The obtained results are summarized as follows.
-
(1)
Plate-shaped hcp-martensite formed within fcc-austenite matrix has higher lattice parameter ratio compared with the reference value in the case when hcp-martensite exists in a single body. In addition, the lattice parameter ratio is increased with increasing the aspect ratio of hcp-martensite plate. Since this behavior is in agreement with the theoretical analysis based on micromechanics, it can be concluded that internal stress is dynamically increased by the growth of plate martensite.
-
(2)
The lattice parameter ratio of hcp-martensite is suddenly decreased by the subsequent formation of bcc-martensite with selected variants. This suggests that internal stress increased by the growth of hcp-martensite induces the formation of bcc-martensite accompanied with variant selection.
Acknowledgement
We would like to thank Dr. Takuro Masumura for providing the material.
REFERENCES
- 1) S. Morito, X. Huang, T. Furuhara, T. Maki and N. Hansen: Acta Mater. 54 (2006) 5323–5331.
- 2) S. Takaki, Y. Fujimura, K. Nakashima and T. Tsuchiyama: Mater. Sci. Forum 539–543 (2007) 228.
- 3) K. Nakashima, Y. Fujimura, H. Matsubayashi, T. Tsuchiyama and S. Takaki: Tetsu-to-Hagané 93 (2007) 459–465.
- 4) F. Archie, M.Z. Mughal, M. Sebastiani, E. Bemporad and S. Zaefferer: Acta Mater. 150 (2018) 327–338.
- 5) B. Hutchinson, D. Lindell and M. Barnett: ISIJ Int. 55 (2015) 1114–1122.
- 6) B. Hutchinson, P. Bate, D. Lindell, A. Malik, M. Barnett and P. Lynch: Acta Mater. 152 (2018) 239–247.
- 7) B. Hutchinson, J. Hagström, O. Karlsson, D. Lindell, M. Tornberg, F. Lindberg and M. Thuvander: Acta Mater. 59 (2011) 5845.
- 8) N. Nakada, N. Kusunoki, M. Kajihara and J. Hamada: Sci. Mater. 138 (2017) 105–108.
- 9) Y. Amemiya, N. Nakada, S. Morooka, M. Kosaka and M. Kato: Tetsu-to-Hagané 105 (2019) 314–323.
- 10) J.D. Eshelby: Proc. R. Soc. A 241 (1957) 376.
- 11) R. Lagneborgj: Acta Metall. 12 (1964) 823–843.
- 12) H. Schumann and H.J. von Fircks: Arch. Eisenhuttenwes. 40 (1969) 561–568.
- 13) Z. Nishiyama: Marutensaitohentai –Kihonhen–, (Maruzen, Tokyo, 1971) pp. 282–295.
- 14) T. Masumura, T. Tsuchiyama, S. Takaki, T. Koyano and K. Adachi: Scr. Mater. 154 (2018) 8–11.
- 15) R. Boehler, D. Santamaria-Perez, D. Errandonea and M. Mezouar: J. Phys. Conf. Ser. 121 (2008) 022018.
- 16) H.-K. Mao, W.A. Bassett and T. Takahashi: J. Appl. Phys. 38 (1967) 272–276.
- 17) M. Kato: Materia Japan 56 (2017) 331–337.
- 18) M. Kato, T. Fujii and S. Onaka: Mater. Sci. Eng. A 211 (1996) 95–103.
- 19) M. Kato and T. Fujii: Acta Metall. Mater. 42 (1994) 2929–2936.
- 20) J.L. Putaux and J.P. Chevalier: Acta Mater. 44 (1996) 1701–1716.
- 21) S. Takeuchi and T. Honma: J. Japan Inst. Metals 19 (1955) 652.
- 22) D.J. Dyson and B. Holmes: J. Iron Steel Inst. 208 (1970) 469–474.
- 23) N. Nakada, N. Koga, T. Tsuchiyama and S. Takaki: Scr. Mater. 61 (2009) 133–136.