Mechanics of Materials
Nonlinear Multiple Regression Model and Optimization of Process Parameters for Weld Bonding of DP780 High Strength Steel
2020 Volume 61 Issue 4 Pages 700-707

Details
2020 Volume 61 Issue 4 Pages 700-707
Based on the Box-Behnken Design (BBD) method, the experiment on weld bonding for DP780 high-strength steel was carried out. The failure load, nugget diameter and energy absorption value of the joints were viewed as the target quantities. The welding current, welding time, electrode pressure and interaction between the parameters were defined as the factors to influence the target quantities. The nonlinear multiple regression model of the weld-bonded joints for DP780 high strength steel was established. The experimental verification shows that the model has high saliency and high degree of fitting, which can effectively predict the failure load, nugget diameter and energy absorption value of the joints. With the increase of welding current and time, the failure load of the weld-bonded joints, the diameter of the nugget and energy absorption value increase, while they decrease with the increase of electrode pressure. The optimal process parameters are welding current 8 kA, welding time 150 ms, electrode pressure 0.3 MPa, which are obtained by the regression model, and the actual value of joint’s failure load under the shear test is 17669 N. The ultrasonic C-scan image is used to identify the gasification zone of the adhesive layer outside the weld nugget. When the welding time is small, the increase of the welding current will provide more heat input, which will lead to an increase in the burning area of the adhesive layer and reduce the static properties of the joints.
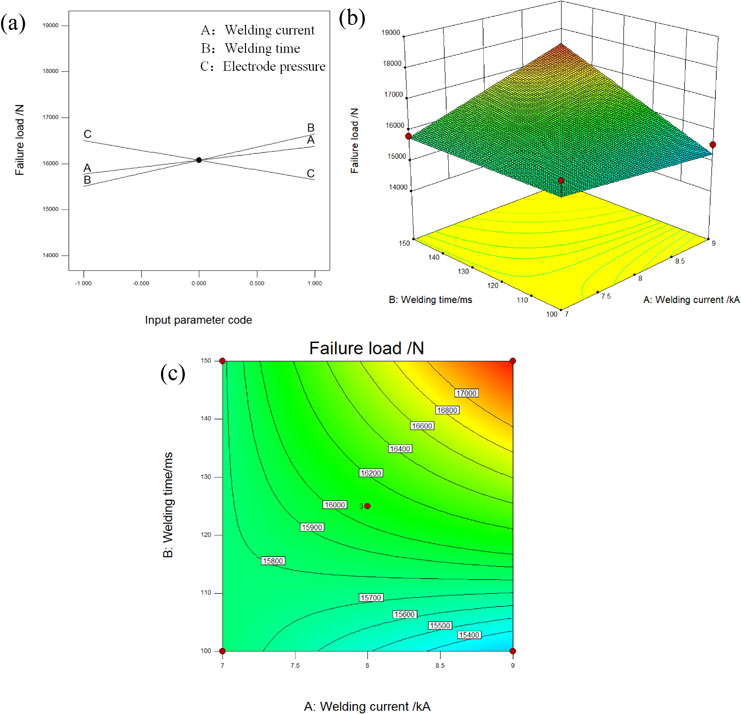
Fig. 3 (a) The influence of three-factor interaction on the failure load (b) Stereogram (c) Contour map.
High-strength steel has the characteristics of high tensile strength with good ductility and good forming performance, and it is one of the best materials which improve collision safety, achieve energy saving, and emission reduction to meet the requirements of lightweight body. Weld bonding is a combination of adhesive bonding and resistance spot welding (RSW); therefore, it not only reduces the stress concentration of the spot welding joint, but also increases the static and fatigue load performance of the joint. Therefore, weld bonding is one of the widespread techniques which is used in automobile and aircraft industries.1–3)
X.M. Qiu et al.4) conducted a resistance spot welding test on dissimilar plates to analyze the influence of welding time and welding current on joint failure load. X. Yuan et al.5) studied the mechanical properties of resistance spot welded joints of A5052 aluminum alloy and DP600 duplex steel dissimilar materials, and analyzed the variation law of welding current on joint failure load. Kaščák et al.6) analyzed the influence of welding current on the failure load of duplex steel. It was found that the current is within a certain interval. As a result, the failure load of the resistance spot welding joint increases with the increase of welding current. F.R. Chen et al.7) carried out orthogonal test with dissimilar steel plate, and analyzed the influence of preheating conditions on failure load and microstructure. Y.S. Zhang et al.8) investigated the process for weld bonding of double-phase steel. The results showed that the failure load of the weld-bonded joint increases with the increase of welding current, and the weld bonding window is smaller than spot welding. Muhammad et al.9) investigated an orthogonal test of the weld bonding parameters and the nugget diameter. The results showed that the welding current has the most significant effect on the nugget diameter. M.F. Khan et al.10) studied the weld bonding of 6061 aluminum alloy. The results showed that the failure load of the weld-bonded joint will decrease with the increase of electrode pressure when the welding time and welding current are constant. In the light of the literature reviewed, it can be thus concluded that these researchers mainly focus on the influence of single welding process parameters on the quality of welded joints.
The present study is focused on the influence of process parameters on the quality of DP780 high-strength steel weld-bonded joints. The experiments were carried out based on the Box-Behnken Design (BBD) analysis method. And then the regression model, correlating three target quantities (failure load, nugget diameter, and energy absorption value) and the welding process parameters of the weld-bonded joints, was established.
The weld bonding process test for DP780 high-strength steel was carried out. The geometry and dimension of the test specimen used in the present work are shown in Fig. 1. Specimen was welded by using an intermediate-frequency-inverter spot-welding machine, and a spherical electrode with a tip end diameter of 6 mm and a radius of curvature of 10 mm were used. The electrode material was chrome-plated copper. Before welding, the test piece was sanded with a sand paper, and it was wiped off the surface with an anhydrous ethanol, and then adhesion was coated on the test piece’s lap area. Finally, the test piece was placed in an incubator to cure the adhesive layer. The epoxy resin adhesive (DP460, 3M Inc., Sao Paulo, USA) was used in the weld bonding process.
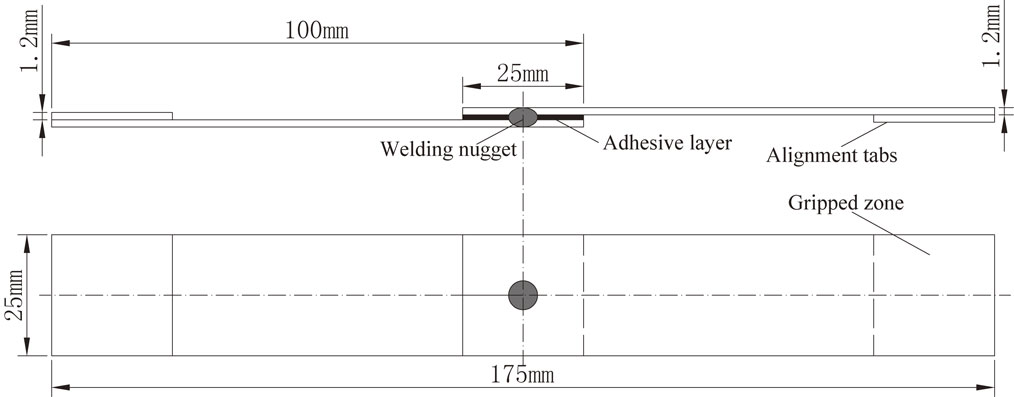
Geometry of the weld-bonded joints.
In this study, the ultrasonic water-immersion focusing method was used to measure the nugget diameter of weld-bonded joints. The internal characteristics and morphology of the nugget were observed with ultrasonic C-scan image, as shown in Fig. 2(a). The nugget diameter was measured based on the grayscale value distribution feature of the C-scan image, which was more accurate. The detailed steps were as follows:
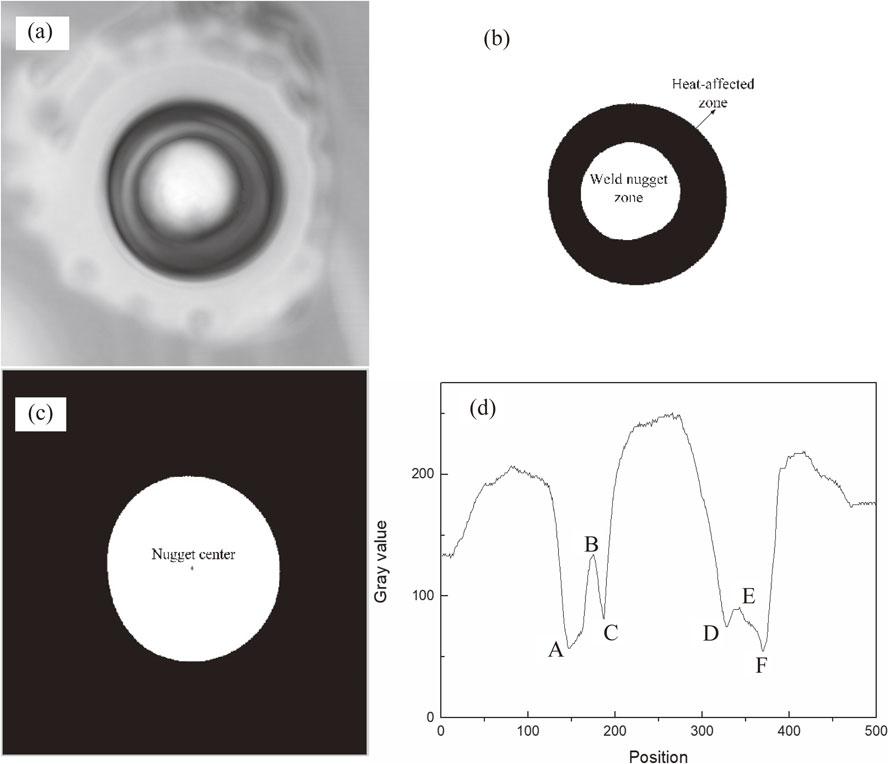
Weld-bonded joint: (a) Ultrasonic C-scan image; (b) Edge segmentation of ultrasonic C-scan image; (c) Nugget center; (d) Gray level of C-scan image.
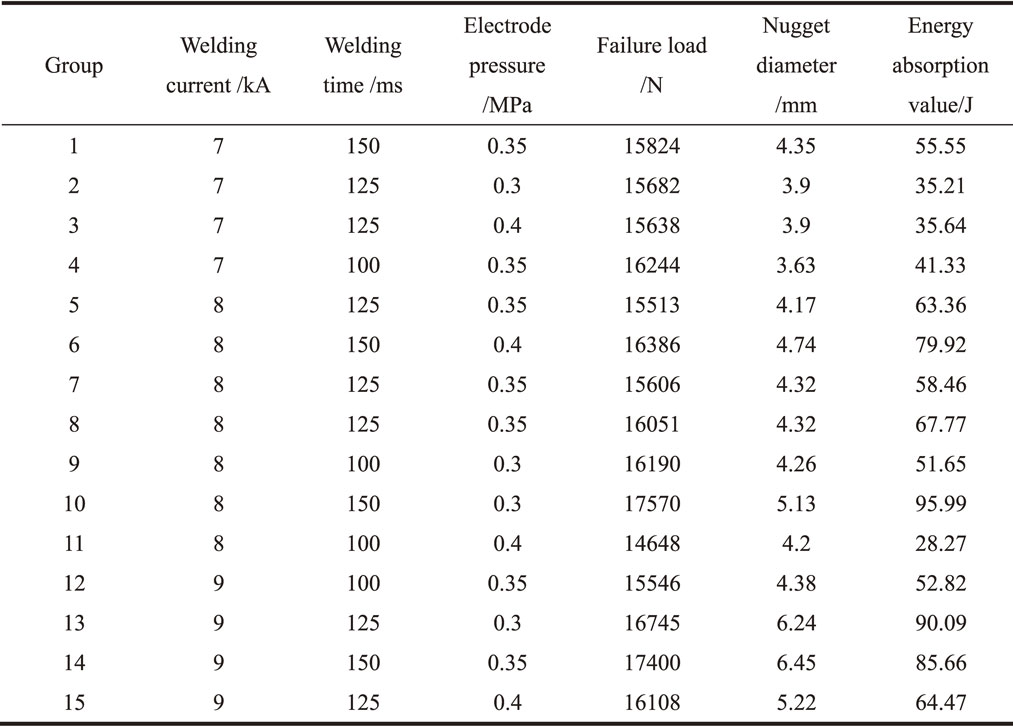
The failure load and the nugget diameter were the target quantities, and the regression model was established with the welding current, welding time and electrode pressure as the process parameters. The Box-Behnken Design (BBD) method was used to design the response surface test, and the failure load and the change of the nugget diameter under different welding process parameters were analyzed to optimize the welding process parameters. The test factors and horizontal design are shown in Table 1. In order to reduce the test error, the specimens were prepared under each set of parameters for tensile shear test, and the tensile rate was set to 5 mm/min.
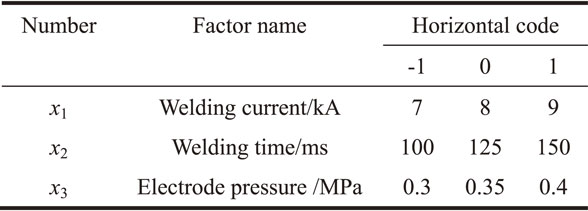
The process parameters of weld bonding: welding current, welding time and electrode pressure are represented by x1, x2 and x3 respectively. The failure load of the weld-bonded joints, diameter of the weld nugget, and the energy absorption value are represented by y1, y2 and y3 respectively. The design factors and test results are shown in Table 2.
The response surface method was used to establish the mathematical model of the welding process parameters, and the saliency of each factor in the mathematical model is tested. The fitting of the mathematical model at the experimental point is mainly tested, and the insignificant regression factors are eliminated. The least square method is used for fitting, and the response surface regression model of the failure load and nugget diameter of the weld-bonded joints is obtained as shown in eqs. (1), (2), and (3).
Failure load:
| \begin{align} y_{1} &= 36541.86 - 2541.13x_{1} - 159.16x_{2} \\ &\quad - 8517.5x_{3} + 22.74x_{1}x_{2} \end{align} | (1) |
Nugget diameter:
| \begin{align} y_{2}& = 29.95 - 5.84x_{1} - 0.087x_{2} - 3.68x_{3} \\ &\quad + 0.014x_{1}x_{2} + 0.31x_{1}{}^{2} \end{align} | (2) |
Energy absorption value:
| \begin{equation} y_{3} = 88.46 - 7.61x_{1} - 0.77x_{2} - 161.60x_{3} + 0.186x_{1}x_{2} \end{equation} | (3) |
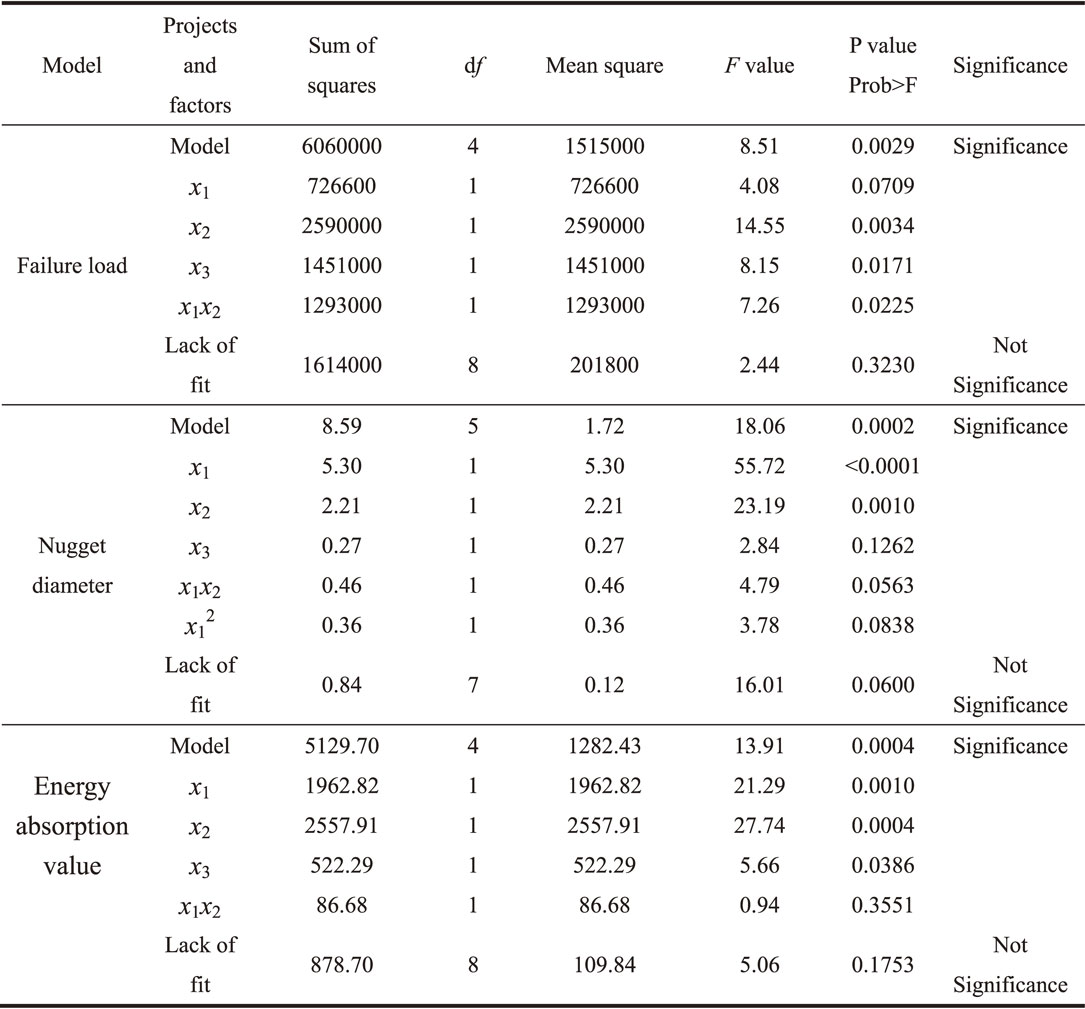
The variance table of the response surface model is analyzed to determine the magnitude of the significance value. If P value of the model term is less than 0.01, the factor is highly significant. If P value of the model term is greater than 0.01 and less than 0.05, the factor is significant. As shown in Table 3, the analysis of ANOVA results indicates that the reliability of the response surface model is high because the failure load of the weld-bonded joint and the regression equation of the nugget diameter are highly significant. From the analysis of variance table, the primary and secondary factors affecting the failure load of the joint are: welding time, electrode pressure and welding current. In addition, the interaction terms of welding time and welding current have a significant effect on joint failure load. Nevertheless, it is found that the welding current has the greatest effect on the nugget diameter, next comes welding time followed by the electrode pressure in the test.
Figures 3 shows the surface and contour plots of the joint failure load at welding current 7 to 9 kA, welding time 100 to 150 ms at an electrode pressure of 0.35 MPa. It is apparent that the failure load of weld-bonded joints increases with the welding current, welding time increasing. On the contrary, it decreases with the electrode pressure. However, it is not unlimited. Too high welding current, welding time and too low electrode pressure will cause a sharp increase in the heat input, so that the diameter of the nugget expands much faster than the plastic ring expands, and it will cause splash. The generation of splash will destroy the integrity of the nugget, and cause the joints stress to concentrate on the edge of the nugget, which will reduce the failure load of the weld-bonded joints. Therefore, the influence of various factors on the joint failure load should be considered comprehensively. The influence of welding current and welding time on joint failure load is shown in Fig. 3(c) at the electrode pressure 0.35 MPa. It is apparent that the average failure load of weld-bonded joints increases with the increase of welding current when the welding time is less than 110 ms. When the welding time is more than 110 ms, the average failure load of the weld-bonded joints increases with the increase of the welding current. The failure load of the joints increases sharply along the direction of the horizontal and vertical coordinates of 45°.
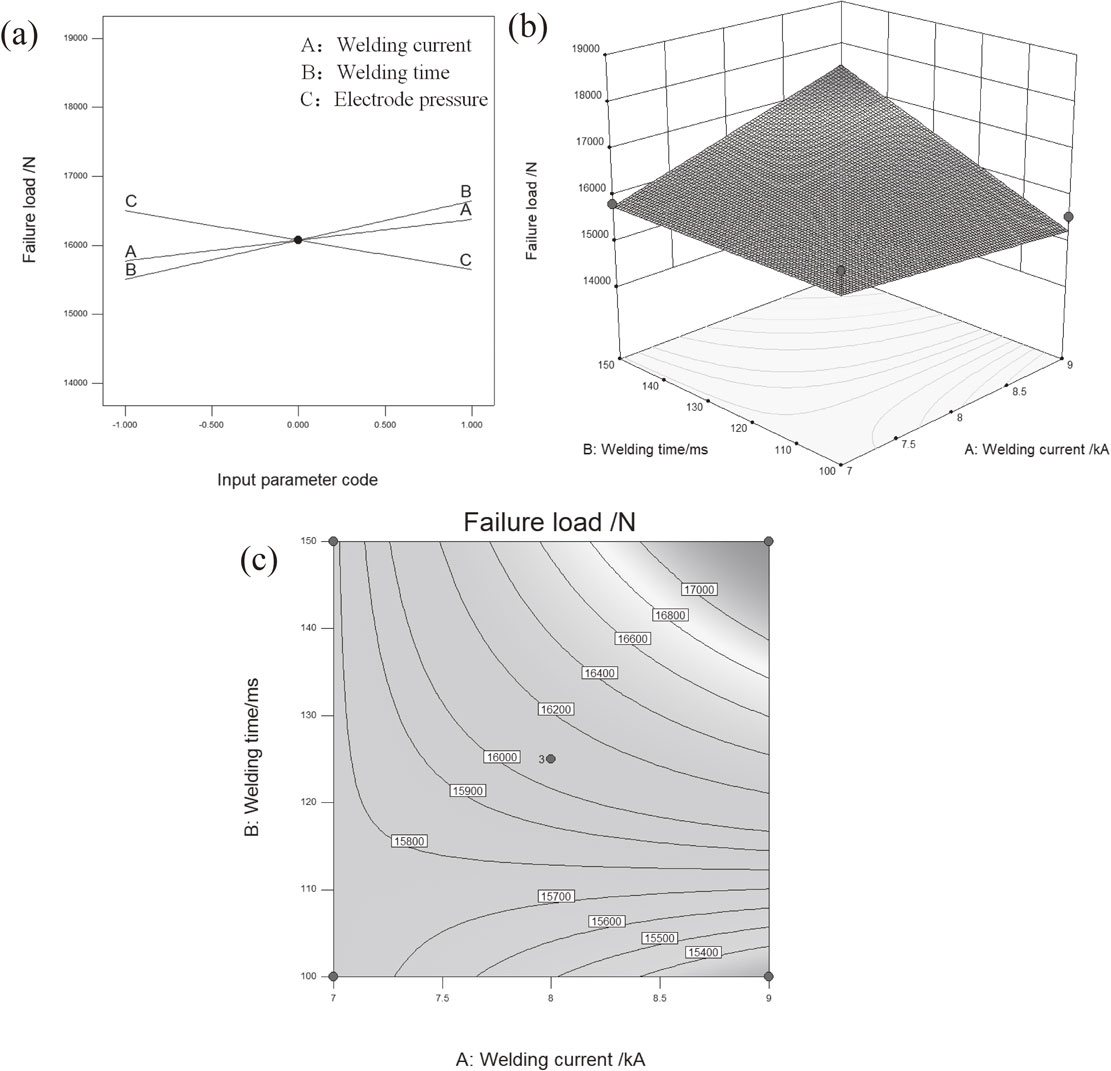
(a) The influence of three-factor interaction on the failure load (b) Stereogram (c) Contour map.
As shown in Fig. 4(a), it is clear that interaction of each welding process parameters has a significant effect on the diameter of the nugget. As illustrated, within the range of 7∼9 kA, the nugget diameter increases sharply with the increase of welding current. When the welding time and the welding current are constant, the smaller electrode pressure obtains a larger nugget diameter. However, as the pressure of the electrode increases, the diameter of the nugget decreases. This is because higher electrode pressure decreases the contact resistance and current density between the faying surfaces of steel sheets. Hence, it causes the decreasing of the welding heat input and a fast increase in the heat dissipation, which results in a smaller diameter of the weld nugget. Figure 4(b) shows that when the electrode pressure is constant, and the current is in the range of 7∼7.5 kA, it is not obvious that the tendency of the nugget diameter increases with the welding time. This is because that when the welding current is small, the heat input can not significantly increase with welding time. However, at high currents, the nugget diameter is more observably increasing with the welding time. This is because the increase of welding current and weld time leads to high heat input. Therefore, the nugget will expand from the center to the periphery, which causes an increase in the diameter of the nugget.
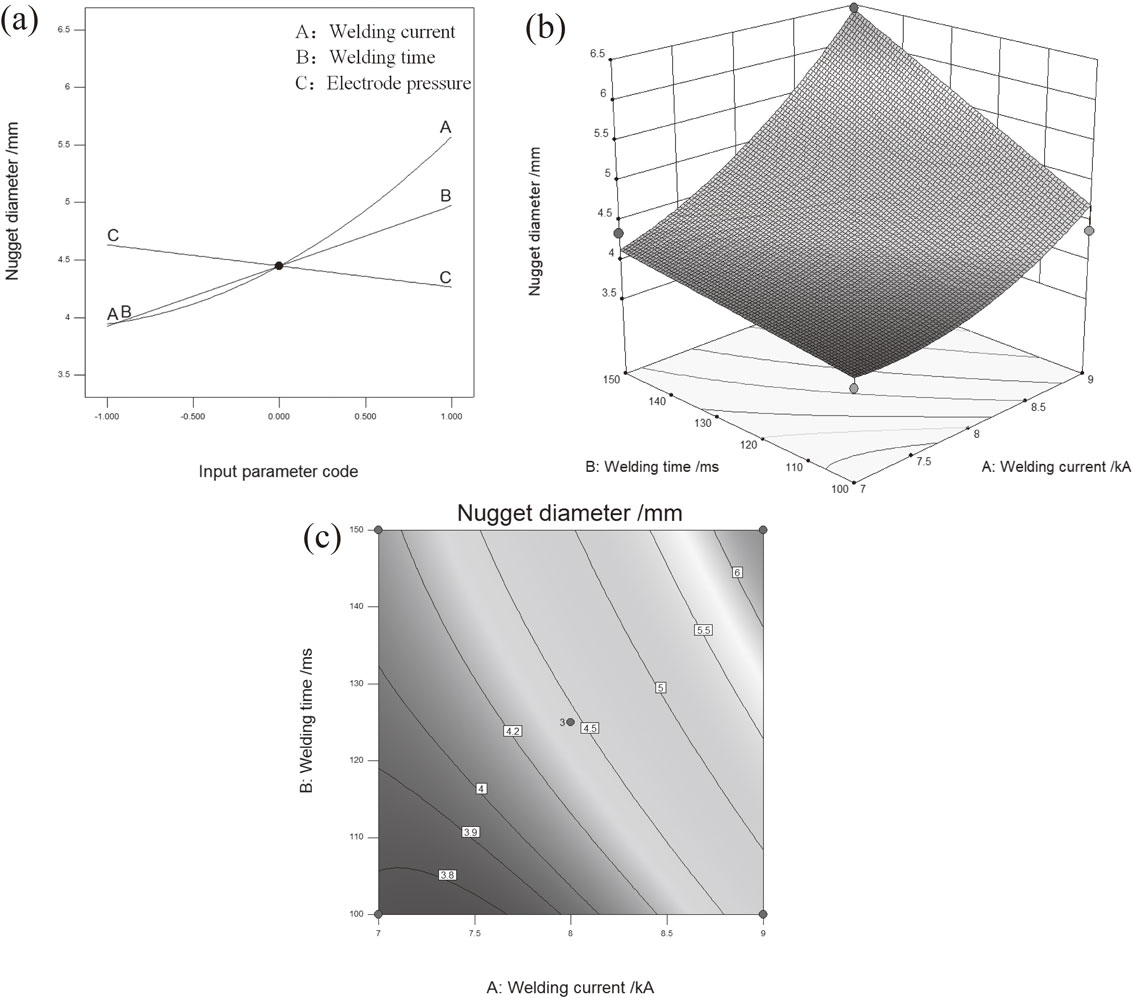
(a) Effect of three-factor interaction on nugget diameter (b) Stereogram (c) Contour map.
From Figs. 4(c), it is clear that when the welding time and welding current are small, changing the two process parameters has little effect on the diameter of the nugget; if the nugget diameter of the weld-bonded joints is small, and the requirements are not met. Simultaneously increasing the welding time and welding current along the contour line in the direction of 45° can rapidly increase the diameter of the nugget, but the high welding current and the welding time may cause splash, which can reduce the failure load of the weld-bonded joints. In order to ensure the quality of the weld-bonded joints, the welding current and the welding time should not be too high.
Figures 3(c) and 4(c) show contour plots of the response surface model. It is apparent that the welding time has significant effect on failure load of weld-bonded joint. When the welding time is less than 110 ms, the diameter of the nugget gradually increases with the increase of the welding current, but the failure load of the joints becomes smaller and smaller. However, if the welding time is more than 110 ms, both the diameter of the nugget and the failure load of the joint increase with the increase of welding current. In order to discern the above reasons, the ultrasonic C-scan image of the weld-bonded joints is compared and analyzed. As shown in Fig. 5, the C-scan image can observe the internal shape of the joint and can identify the over-burning and splashing. The weld nugget zone, fusion zone, heat-affected zone and adhesive layer burning zone of the joint are divided. The welding time of the two kinds of weld-bonded joints is less than 110 ms. Furthermore, the welding process parameters are: welding time 100 ms, electrode pressure 0.35 MPa, welding current 7 kA and welding time 100 ms, electrode pressure 0.35 MPa, welding current 9 kA in Figs. 5(a) and 5(b). When the welding time is less than 110 ms, the increase of the welding current will provide more heat input, which results in uneven distribution of the fusion zone and heat-affected zone of the weld-bonded joints. And more heat input can lead to high adhesive burning and the expansion of adhesive layer burning zone, as shown in Figs. 5(a) and 5(b). In addition, it has been observed in practice that an increase in current causes the sheet to warp, which affects the compactness of the adhesive, and consequently cause a decrease in the static properties of the joint.
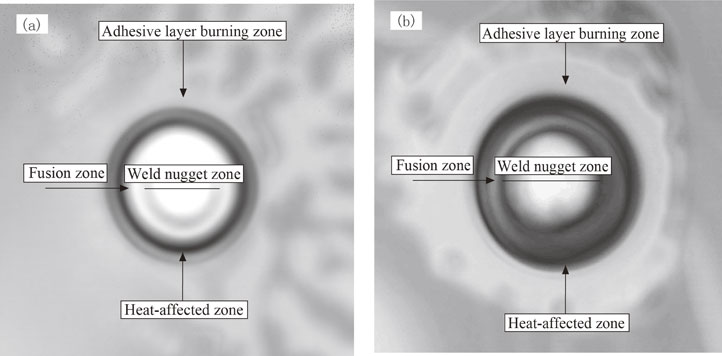
Ultrasonic C-scan image of weld-bonded joints, (a) Welding current: 7 kA; (b) Welding current: 9 kA.
The energy absorption value of the weld-bonded joint can effectively characterize the joint quality. The energy absorption value is determined by the static failure load and the failure displacement cloud map of the joint. The energy absorption value can directly reflect the buffer shock absorption performance of the joint. As shown in Fig. 6(a), it is the influence of the bonding welding current, welding time and electrode pressure interaction on the joint energy absorption value. It can be seen that the influence of the welding process parameters on the energy absorption value of the joint is the same as the influence of the above process parameters on the failure load and the diameter of the nugget, that is, the energy absorption value of the joint increases with the increase of the welding current and the welding time, and it is apparent that the energy absorption value decreases with the electrode pressure increasing. The influence of the interaction between welding current and welding time on the energy absorption value is shown in Fig. 6(c). It can be seen that the energy absorption value increases with the single factor and is significantly smaller than the interaction trend between the welding current and the welding time. Therefore, in order to improve the energy absorption value of the joints, a fast and effective method is to change the welding current and welding time at the same time.
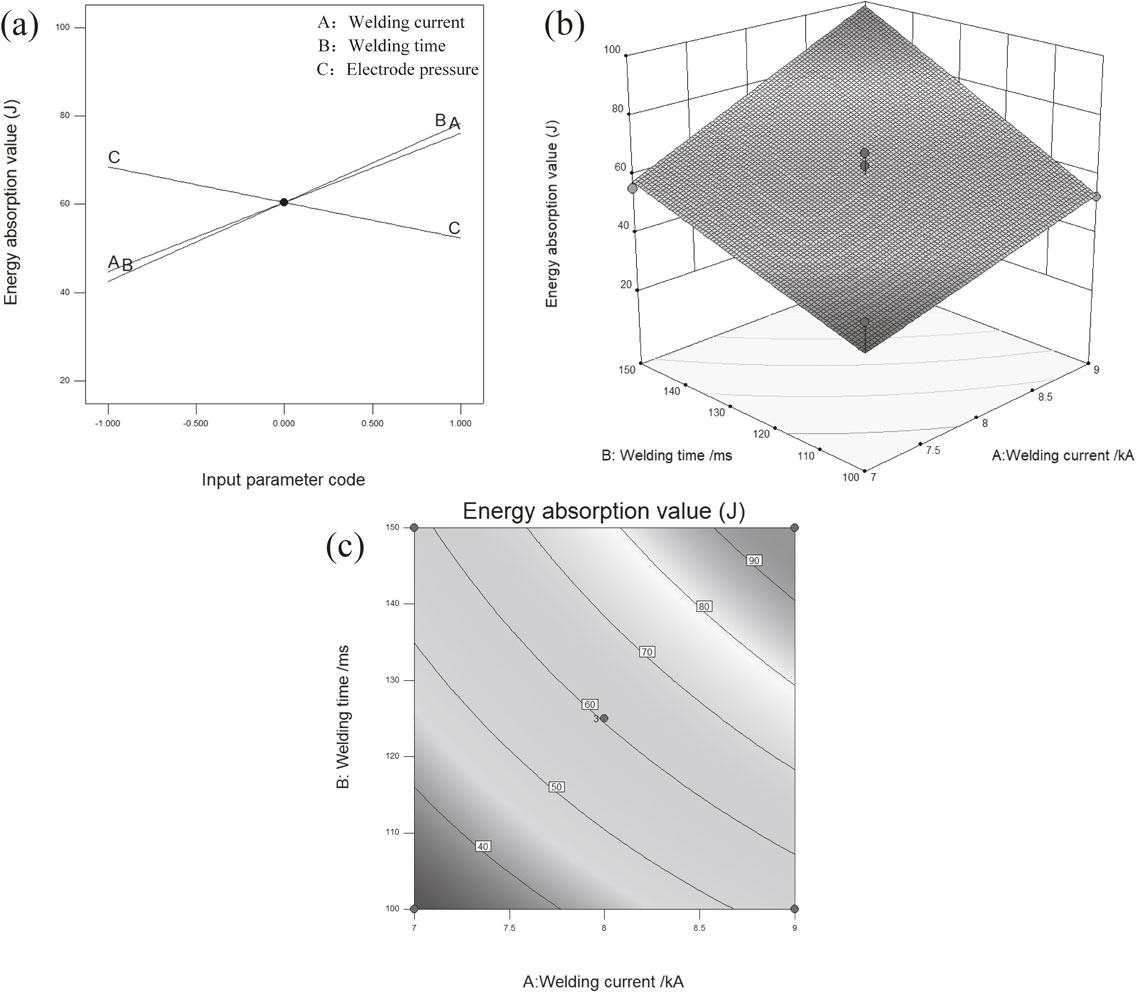
(a) The influence of three-factor interaction on energy absorption value (b) Stereogram (c) Contour map.
The static properties of the joints are determined by the quality of the joints and the layers. The diameter of the nugget cannot directly characterize the mechanical properties of the joint. Therefore, the influence of the welding process parameters on the response value is prioritized. The maximum value of the failure load is used as the target to optimize the parameters. The regression model is calculated to obtain the optimal parameters of welding current 9 kA, welding time 150 ms and electrode pressure 0.3 MPa, but splash occurred under these parameters. The generation of the splash is that the thermal input is too high, and the splash can be prevented by reducing the welding current or shortening the welding time. According to the response surface model analysis, the influence of welding time on the failure load is greater than the welding current. In addition, under the premise of ensuring the large welding time, increasing the welding current is beneficial to improve the mechanical properties of the joint. Therefore, the welding current for the optimal process parameters is appropriately reduced. When the welding current is 8 kA, the weld-bonded joint is not splash. The optimal process parameters of the DP780 weld-bonded joint are determined as follows: welding current 8 kA, welding time 150 ms, electrode pressure 0.3 MPa. The obtained optimal process parameters were tested and verified, which were substituted into the regression model to calculate the failure load of 17072 N and the nugget diameter of 5.16 mm. The weld bonding test specimens under this parameter were tested by means of a material testing machine. In the tensile-shear test, the average failure load was measured to be 17669 N, the diameter of the nugget was 5.10 mm, and the energy absorption value was calculated to be 90.67 J. The verification results of the test show that the error of the failure load, the nugget diameter and the energy absorption value between calculated value and experimental value are less than 3.4%, 1.2%, and 4.7%, respectively, and the error rate is very low within a reasonable range. Therefore, the mathematical model can be used feasibly to predict the failure load, nugget diameter and energy absorption value of weld-bonded joints.
Based on the response surface method, the regression model of the relationship between the failure load, nugget diameter, energy absorption value and welding process parameters of DP780 high-strength steel weld-bonded joints was established. The results show that the predicted and actual value of the failure load, nugget diameter and energy absorption value are verified by experiments. The errors are: 3.4%, 1.2%, and 4.7%, which proves that the multivariate nonlinear regression mathematical model has high significance and high degree of fitting, which can effectively predict the failure load, nugget diameter, and energy absorption value. The analysis shows that the primary and secondary factors affecting the failure load of the weld-bonded joints are: welding time, electrode pressure, welding current. Furthermore, the interaction of welding time and welding current has significant effect on the joint failure load. The failure load of the weld-bonded joints is positively correlated with the welding current and welding time, and negatively correlated with the electrode pressure. The diameter of the nugget increases with the increase of welding current and welding time, and increases with the decrease of the electrode pressure. The optimal welding process parameters: welding current 8 kA, welding time 150 ms, and electrode pressure 0.3 MPa were obtained. In addition, the effective range of the no splash model process parameters is welding current 7∼8 kA, welding time 100∼150 ms, electrode pressure 0.3∼0.4 MPa. With the aid of ultrasonic C-scan image, there is an adhesive layer burning zone outside the nugget of weld-bonded joint. When the welding time is small, the increase of the welding current will provide more heat input, which leads to an increase in the gasification area of the adhesive layer. Therefore, the static performance of the weld-bonded joint is reduced.
This work was supported by the National Natural Science Foundation of China (Grant No. 51565022).