Abstract
The corrosion behavior of six types of polycrystalline wool blanket samples, which were composed of alumina and silica, and exposed to Na2CO3 vapor at 1350°C for 24 h, was investigated. The corrosion in sample A100 (Al2O3: 99.6 mass%) by alkaline vapor was suppressed remarkably as the corundum phase changed to the β-alumina (Na2O·11Al2O3) phase only at the surface of the fiber, and the surface layer functioned as a protective layer against corrosion. The corundum phase in sample A95 (Al2O3: 94.9 mass%) changed slightly to β-alumina due to the formation of the carnegieite phase via the decomposition of mullite phase corroded by alkaline vapor. The corrosion in samples A80 (Al2O3: 80.2–80.8 mass%) and A72 (Al2O3: 72.2–73.2 mass%) by alkaline vapor was more intense than that in samples A100 and A95 because of the high silica content. Alkaline vapor remained near the reaction surface and reacted locally with fibers in a narrow region because the area of the amorphous phase in the high-density samples (A80-H and A72-H) was wider than that in the low-density samples (A80-L and A72-L), and the permeability of the vapor was low in the high-density samples. The carnegieite phase, which was present in the temperature range of 1000–1300°C, disappeared and the amorphous phase was simultaneously formed during alkaline vapor exposure at 1350°C for 8 h in the corrosion process of A72-H.
1. Introduction
In Japan, promoting the utilization of renewable energy and the development of energy conservation technologies have been necessary since the accident at the nuclear power system in March, 2011. The production of ceramics is high-energy-consuming process because the firing process of ceramics at high temperatures is essential. The use of ceramic fibers as heat insulator materials is one of the energy conservation methods in ceramic firing furnaces. Ceramic fiber insulation is an excellent energy conservation property because of its small heat storage.1–5) Polycrystalline wool (PCW), which is a type of ceramic fiber, has high heat resistance and can be used in a high-temperature range of 1000–1600°C. Mullite (3Al2O3·2SiO2) fibers are widely used because of their high heat resistance and mechanical strength.6)
Meanwhile, high-temperature firing is undertaken at a waste incineration kiln to prevent of the discharge of dioxins, which eventually become environmental polluters. The corrosion of metals and refractories by alkaline vapor is a severe problem in the kiln.7,8) In addition, when biomass fuels, which utilize renewable energy sources, are burned in various furnaces, corrosion vapor is formed due to the fuel alkalinity,9,10) which attacks refractories in the furnace. Recently, ceramics containing Na and/or K have been widely studied as lead-free electronic ceramics for environmental protection, and there are major concerns about the effects of alkaline vapors on refractories in the furnace.11–13) Furthermore, the alkaline corrosion of refractories in glass furnaces has been studied in the past.14–17) In these systems, furnace insulations are corroded by the alkaline vapors generated during heat treatment, which causes problems such as volume contraction and cracking of the insulations.
However, Okawara and Yamaguchi investigated the corrosion behavior of mullite refractories by Na2CO3 vapor.18,19) They reported that numerous reaction products containing corundum, nepheline, carnegieite, carnegieite–sodium aluminate solid solution, and sodium aluminate were formed, and these phases gradually changed into an amorphous phase after a long period of exposure to alkaline vapor. In addition, several studies have been reported on coating mullite ceramics for improving alkaline corrosion resistance.20,21) However, the corrosion behavior of mullite or alumina fibers by alkaline vapor has been rarely reported thus far.
In this study, the corrosion behavior of various PCWs composed of alumina and silica by Na2CO3 vapor at high temperature was investigated to expand their applications and contribute to energy conservation.
2. Experimental Procedure
2.1 Materials
Six types of PCW samples were used in this study. The chemical composition and bulk density of the samples before treatment are shown in Table 1. The PCW samples are represented as A100, A95, A80 and A72 according to the alumina content in the samples. In the cases of A80 and A72, H and L symbols are added according to the difference in the bulk density of the samples. The PCW blankets which were cut into 60 mm × 60 mm, were used as samples for alkaline treatment. The range of thickness of the blankets was from 20–30 mm and the range of weight of the blankets was from 8.5–13.4 g.

Table 1 Chemical composition and nominal bulk density of the blanket samples before treatment.
A schematic of the apparatus for preparing PCW blanket sample corroded by alkaline vapor is shown in Fig. 1. The Na2CO3 (≥99.8%) powder (0.2 g) as an alkaline vapor source, was put into an alumina (≥99.6%) crucible (inner diameter of opening 40.5 mm). A blanket sample was placed on the crucible to cover the opening. Two alumina (≥99.6%) tubes (outer diameter 4.2 mm) were inserted as spacers between crucible and the blanket sample to prevent the sample from sticking to the crucible. The sample and crucible were heated at 1350°C for 24 h in an electric furnace to react with the alkaline vapor, and then cooled naturally in a furnace. Additionally, A72-H, which was quenched at various temperatures up to 1300°C and maintained at 1380°C for 8 h before being cooled gradually, was prepared to investigate the thermal changes during heating in alkaline vapor.
2.3 Characterization of samples before and after alkaline treatment
The weight changes of the samples before and after heat treatment with and without alkaline vapor were measured. The crystal phase changes, chemical composition changes, and microstructures of the fibers were investigated via powder X-ray diffraction (XRD), energy dispersive X-ray spectrometry (EDX) and scanning electron microscopy (SEM), respectively. The samples for XRD and EDX analyses were prepared by cutting out an area of 30 mm × 30 mm and a depth of 2 mm from the center of the reaction surface with a cutter knife and uniformly grinding in a mortar. The SEM samples were obtained by sticking a small amount of fiber from the outermost layer of the reaction surface to a carbon tape.
3. Results and Discussion
3.1 Appearance of samples after heat treatment
The thickness of the samples heated without Na2CO3 increased compared with that of the samples before heating. However, the thickness of samples exposed to alkaline vapor decreased, except for A100. In particular, surface hardening, peeling and cracking were observed in A80 and A72, which contained a relatively large amount of silica. Therefore, it was evident that the samples with high silica content were corroded by alkaline vapor. Conversely, in samples with low silica content, the change in appearance was slight, and the reaction surface turned slightly blue.
3.2 Weight change
The blanket sample heated without the alkaline vapor source did not significantly change in weight. The weight change of the blanket samples by alkaline treatment is shown in Fig. 2. The weight change ratios increased with the silica content of PCW but those of A80 and A72 were not distinctively different. In addition, the weight change ratios for the low-density samples were higher than those for high-density samples with relatively the same compositions. Consequently, the weight change of A80-L was the largest in the samples, and the results suggested that the corrosion reaction proceeded extensively in A80-L.
3.3 Chemical composition change
The concentration of the chemical composition on the reaction surface of the blanket samples after alkaline treatment is shown in Table 2. The ratios of the concentration of alumina to that of silica in the reaction surfaces were approximately equal to the ratios of samples before alkaline treatment. The concentration of Na2O in the reaction surface increased with silica content, but those of A80 and A72 were not distinctly different. In addition, the concentration of Na2O in the reaction surface for the low-density samples was larger than those for the high-density samples with relatively similar compositions. These results corresponded with the tendency of weight change for the samples.

Table 2 Chemical composition of the sample surfaces exposed to alkaline vapor.
In the case of high-density samples, it was assumed that alkaline vapor was retained around the reaction surface and the corrosion reaction did not proceed inside the samples. Particularly, the Na2O content of A100 was almost the same as that of the other samples despite the very low weight change. The results suggest that the protective layer was formed by the reaction products at the A100 sample surface.
However, both of the Na2O content and weight change of the low-density samples were higher than those of high-density samples because alkaline vapor penetrated the blankets. In addition, upon comparing A80-L with A72-L, the Na2O content of A72-L was higher than that of A80-L, whereas the weight change of A72-L was lower than that of A80-L. Xu and co-workers reported that the alkaline corrosion resistance depended on the penetration of alkaline vapor into the refractories.22) The results indicate that the formation of reaction products containing silica and Na2O suppressed the penetration of Na2O vapor into the blankets because of the higher silica content in A72-L.
3.4 Phase transition
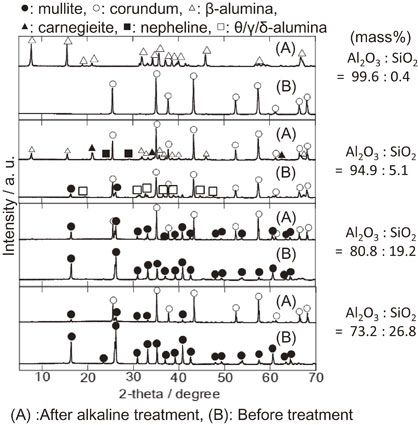
The XRD patterns of A100 and A95 are shown in Fig. 3, wherefrom corundum peaks were only observed in the former before treatment. Although the corundum peak intensity strengthened after heating without an alkaline reagent, other phases were not observed. After alkaline treatment, the corundum peaks disappeared, and the β-alumina (Na2O·11Al2O3) phase appeared simultaneously. Therefore, the transition from the corundum to β-alumina phase occurred by alkaline treatment for A100. The formation of β-alumina in high alumina refractories attacked by alkaline vapor has been widely acknowledged thus far.23–25) In addition, Brown and co-workers concluded that the alkali resistance of β-alumina was greater than that of corundum.25) Therefore, it is suggested that the presence of the β-alumina phase in A100 suppressed the corrosion reaction by alkaline vapor and resulted in a very low weight change ratio.

In the A95 sample before treatment, corundum, mullite, and intermediate alumina (θ-, γ-, and δ-alumina) peaks were observed. The intermediate alumina peaks changed to corundum peaks after heating without an alkaline reagent, and the mullite peaks did not change. After the alkaline treatment, the mullite and intermediate alumina peaks disappeared and the peaks of β-alumina, carnegieite, and nepheline were observed; however, the intensity of the corundum peaks hardly changed. This result indicates that the mullite phase was decomposed and changed to β-alumina, carnegieite, and nepheline phases by alkaline vapor.26) Unlike the result of A100, the corundum phase did not change in A95. The reason was presumed to be that the corrosion reaction of mullite with alkaline vapor preferentially occurred.
The XRD patterns of A80-H and A80-L are shown in Fig. 4. Only the mullite peak was observed in A80-H and A80-L before treatment. However, the intensity of the mullite peaks increased due to crystal growth after heating A80-H and A80-L without an alkaline reagent. After the alkaline treatment of A80-H, the intensity of the mullite peaks decreased and that of the corundum peaks increased. In this pattern, phases containing silica and Na2O were not observed. The results suggest that the amorphous phase which is composed of Al2O3, SiO2 and Na2O, would be present in A80-H heated by alkaline vapor. In the case of A80-L with low density, the mullite phase disappeared and corundum, carnegieite, nepheline, and β-alumina phases were observed after alkaline treatment, unlike A80-H.

The XRD patterns of A72-H and A72-L are shown in Fig. 5. A mullite peak was only observed in A72-H and A72-L before treatment. Notwithstanding, the intensity of the mullite peaks increased due to crystal growth after heating A72-H and A72-L without an alkaline reagent. However, after the alkaline treatment of A72-H, the mullite phase nearly disappeared and the corundum phase appeared. In this pattern, the peaks of phases containing silica and Na2O were hardly detected. Therefore, the amorphous phase seems to be formed in A72-H treated with alkaline vapor. In the case of A72-L with low density, carnegieite, nepheline and β-alumina phases were observed after alkaline treatment similar to A80-L. Comparing A72-L with A80-L after alkaline treatment, the intensity of the carnegieite peaks of A72-L was much higher than that of A80-L because of the high silica content of A72-L.
3.5 Microstructure of the samples
The SEM images of the reaction surfaces of the samples after alkaline treatment are shown in Fig. 6. In A100 and A95 with low silica content, the fiber shapes were maintained throughout the entire field of observation. However, the amorphous-like phase partially covered the fiber surface or adhered between the fibers in A80 and A72. These observations suggest that hardening, peeling, and cracking occur at the reaction surface of A80 and A72 after alkaline treatment owing to the network structure between the fibers according to the formation of the amorphous phase. In addition, the amorphous-like phase covered a wide area in the high-density samples of A80-H and A72-H. The reason for this result was assumed to be that the corrosion reaction proceeded locally at the reaction surface because the higher the density, the lower the permeability of alkaline vapor. In addition, the amorphous-like phase may act as a protective layer for alkaline vapor corrosion.

Furthermore, the SEM images of the area containing amorphous-like regions in A80-H and A-72-H and the chemical composition of the square region are shown in Fig. 7 and Table 3. As shown in Table 3, the ratios of silica to alumina on the surface of the amorphous region were higher than those of the blankets before alkaline treatment in both samples. The result indicated that the amorphous phase was a silica-rich phase formed by mullite decomposition, which was consistent with the XRD results.
3.6 Corrosion reaction process of PCW by alkaline vapor
The thermal changes of A72-H, wherein the mullite phase almost disappeared after treatment with alkaline vapor, were comprehensively investigated. Figure 8–10 show the weight changes, Na2O content, and XRD patterns of A72-H treated with alkaline vapor at various temperatures, respectively. When the temperature reached the melting point (845°C), the Na2CO3 powder changed to liquid. When the sample was quenched at 860°C, the Na2CO3 in the crucible was a red-hot liquid. However, the weight of the blanket and Na2CO3 maintained the value before heating. Therefore, Na2CO3 had not yet vaporized until 860°C. The vaporization of Na2CO3 began at temperatures between 860 and 1000°C because the weight of Na2CO3 decreased when the sample was quenched at 1000°C. In addition, although the weight change was very low at 1000°C, a relatively large amount of Na2O was present at the reaction surface and weak carnegieite and nepheline peaks were observed in the XRD patterns. These results indicate that the corrosion reaction was limited at the shallow surface layer of the sample at an early stage of the reaction. The intensity of the mullite peaks decreased remarkably in a temperature range from 1000–1100°C, after which the intensity of the peaks was mostly maintained in the temperature range of 1100–1350°C. From the results, it was assumed that both crystal growth and the decomposition of mullite proceeded in the temperature range. Although strong carnegieite peaks were observed in a temperature range of 1100–1300°C, the intensity of the peaks became very weak after heating at 1350°C for 8 h. Nonetheless, the corundum peaks, the very weak peaks of the β-alumina, and mullite peaks were observed after heating at 1350°C for 8 h. Therefore, the silica containing compounds, such as carnegieite and nepheline changed to an amorphous phase in a temperature range of 1300–1350°C. After being maintained at 1350°C, the Na2O content at the reaction surface of the sample decreased remarkably despite increase in weight. This result indicated that compounds containing Na2O penetrated the blanket during maintenance at 1350°C.

4. Conclusions
The corrosion behavior of six types of PCW blanket samples composed of alumina and silica exposed to Na2CO3 vapor at 1350°C for 24 h was investigated. The results are summarized as follows.
-
(1)
Corrosion in A100 (Al2O3: 99.6 mass%) by alkaline vapor was remarkably suppressed as the corundum phase changed to the β-alumina (Na2O·11Al2O3) phase only at the surface of the fiber, and the surface layer functioned as a protective layer against the corrosion.
-
(2)
The corundum phase in A95 (Al2O3: 94.9 mass%) changed slightly to β-alumina owing to the formation of the carnegieite phase by the decomposition of the mullite phase corroded by alkaline vapor.
-
(3)
Corrosion in A80 (Al2O3: 80.2–80.8 mass%) and A72 (Al2O3: 72.2–73.2 mass%) by alkaline vapor was more intense than that in A100 and A95 because of the high silica content of A80 and A72.
-
(4)
In the case of A80 and A72, the area of amorphous phase in the high-density sample (A80-H and A72-H) was wider than that in the low-density sample (A80-L and A72-L). This result suggested that alkaline vapor remained near the reaction surface and reacted locally with fibers in a narrow region because the permeability of the vapor is low in the high-density sample. The reaction behavior of A72-H was more remarkable than that of A80-H because of the higher silica content.
-
(5)
The investigation of the corrosion reaction process by quenching A72-H at various temperatures revealed that the carnegieite phase, which was present in a temperature range of 1000–1300°C, disappeared, and the amorphous phase was simultaneously formed by maintaining the temperature at 1350°C for 8 h. The intensity of the mullite peaks decreased remarkably in a temperature range of 1000–1100°C, whereafter the intensity of the peaks was mostly maintained in a temperature range of 1100–1350°C owing to both crystal growth and decomposition.
-
(6)
These results suggest that the low silica composition (SiO2; 0–5 mass%) is effective to suppress the corrosion of alkaline vapor at high temperatures and the high density (130 kg m−3) is relatively effective to suppress it in the case of the high silica composition (SiO2; 20–28 mass%).
REFERENCES
- 1) T. Nishio and Y. Fujiki: J. Ceram. Soc. Jpn. 98 (1990) 1223–1230.
- 2) V. Maneeratana and W.M. Sigmund: Chem. Eng. J. 137 (2008) 137–143.
- 3) X. Chen and L. Gu: J. Mater. Proc. Tech. 209 (2009) 3991–3998.
- 4) X. Chen and L. Gu: J. Non-Cryst. Solids 355 (2009) 2415–2421.
- 5) Y.B. Zhang, C.F. Xiao, S.L. An, J.F. Yang and S.J. Xu: Sci. Sinter. 42 (2010) 203–210.
- 6) P.C. Dokko, J.A. Pask and K.S. Mazdiyasni: J. Am. Ceram. Soc. 60 (1977) 150–155.
- 7) A. Valenzuela-Gutiérrez, J. López-Cuevas, A. González-Ángeles and N. Pilalua-Díaz: SN Appl. Sci. 1 (2019) 784.
- 8) N. Li, E. Vainio, L. Hupa, M. Hupa and E.C. Zabetta: Energy Fuels 31 (2017) 10046–10054.
- 9) S. Schaafhausen, E. Hugon, E. Yazhenskikh, B. Wilhelmi and M. Muller: Adv. Appl. Ceram. 114 (2015) 55–64.
- 10) R. Boris, V. Antonoviè, J. Keriene, R. Stonys, A. Kudma and P. Zdanevièius: Refract. Ind. Ceram. 57 (2017) 651–654.
- 11) R. Li, X. Sun, T. Zheng and J. Wu: J. Am. Ceram. Soc. 103 (2020) 444–453.
- 12) N. Kumar, A. Shukla, N. Kumar and R.N.P. Choudhary: J. Electroceram. 44 (2020) 203–214.
- 13) C. Shi, J. Ma, J. Wu, K. Chen and B. Wu: J. Mater. Sci. Mater. Electron. 31 (2020) 2809–2816.
- 14) M.D. Allendorf and K.E. Spear: J. Electrochem. Soc. 148 (2001) B59–B67.
- 15) K.E. Spear and M.D. Allendorf: High Temperature Corrosion and Materials Chemistry III, (The Electrochemistry Society Inc., Pennington, NJ, 2001) pp. 274–284.
- 16) R.G.C. Beerkens and O.S. Verheijen: Phys. Chem. Glasses 46 (2005) 583–594.
- 17) H. Limpt, R. Beerkens and O. Verheijen: J. Am. Ceram. Soc. 89 (2006) 3446–3455.
- 18) S. Okawara and A. Yamaguchi: Yogyo-Kyokai-Shi 77 (1969) 208–216.
- 19) A. Yamaguchi, S. Okawara and A. Yamanaka: Yogyo-Kyokai-Shi 77 (1969) 357–366.
- 20) X. Zhang, J. Zhou, J. Wang and Y. Jiang: J. Mater. Sci. 44 (2009) 2938–2944.
- 21) R. Chen, W. Jia and X. Xu: J. Alloy. Compd. 770 (2019) 945–951.
- 22) Y. Xu, S. Sang and Y. Liet: Metall. Mater. Trans. A 45 (2014) 2885–2893.
- 23) E. Criado, J.S. Moya and S. De Aza: Ceram. Int. 7 (1981) 19–21.
- 24) N.R. Brown, R.F. Hayden and J.J. Brown, Jr.: Mater. Sci. Forum 34–36 (1988) 711–715.
- 25) C.R. Kennedy: J. Mater. Energy Syst. 3 (1981) 27–31.
- 26) M.S. Başpinar and F. Kara: J. Ceram. Silikáty 53 (2009) 242–249.


