Abstract
Fine Ni particles are utilized as internal electrode materials for multilayer ceramic capacitors. Despite extensive research, the effects of the surface properties (additional elements) remain unclear. To the best of our knowledge, the present study is the first to demonstrate the effects of the addition of sulfur (S) and phosphorus (P) on surface modification and binder decomposition during the production of fine Ni particles. Scanning electron microscopy, X-ray diffractometry, thermogravimetry-differential thermal analysis, hydrogen temperature-programmed reduction, temperature-programmed decomposition, and X-ray photoelectron spectroscopy were performed to analyze non-doped Ni, S-doped Ni and P-doped Ni powder. S existed as S–O or Ni–S on the particle surface in the S-doped Ni powder, whereas P existed solely as P–O on the particle surface in the P-doped Ni powder. When formed into a paste with these powders, the decomposition temperature of the binder is lower than that of the binder alone owing to the catalytic effect of the unmodified surface of Ni in non-doped Ni. However, the catalyst poisoning effect of S in S-doped Ni and the coating effect of P–O in P-doped Ni suppressed the lowering of the binder decomposition temperature due to the catalysis of the Ni surface. The results of the present study are expected to inspire future research on the optimization of the manufacturing process of multilayer ceramic capacitors.
1. Introduction
Ni particles are processed into a slurry-like paste in the manufacturing process of multilayer ceramic capacitors (MLCCs). This paste is applied at a target thickness to a dielectric sheet that is thinly printed on a polyethylene terephthalate (PET) film, and subsequently dried. Several hundred layers of these sheets are stacked, and subsequently cut to the desired size to obtain an unfired green chip.1) This green chip needs to be fired to elicit its function as a capacitor. The fine Ni particles constitute Ni electrode layers containing organic components such as resins and additives. These layers are formed between dielectric ceramic layers containing organic components, and fired with dielectric ceramics in a reducing atmosphere. The green chips fired without preprocessing are prone to cracking and delamination due to the generation of gases via the decomposition of the organic matter. Therefore, a binder decomposition process is generally performed prior to firing to remove the organic matter. Binder decomposition is the process of decomposing or burning organic matter in a nitrogen atmosphere containing minuscule amounts of oxygen and water to prevent the oxidization of fine Ni particles.2)
During binder decomposition, gases may be rapidly generated from the organic components of the Ni electrode layers at low temperatures prior to the decomposition and removal of the organic matter in the dielectric layers. This induces the generation of a substantial amount of decomposition gases at a stage in which the escape routes for the gases are limited. The gases tend to accumulate inside the chip, thereby causing delamination and cracking.1,3) Therefore, the atmosphere and heat treatment conditions maintained during binder decomposition are precisely regulated. The process has also been optimized by controlling the decomposition behavior of the binder contained in the dielectric and Ni electrode layers. However, the recent increase in the number of layers in MLCCs has necessitated stringent control of the decomposability of the binder in the Ni electrode layers. Regarding the binder decomposability of the paste using Ni particles, previous research was focused on the oxide film on the Ni surface,3) the fabrication process of Ni particle,4) and the shape and properties of Ni particles.5–8) However, the effects of the surface properties (additional elements present on the surfaces of the Ni particles) remain unexplored.
Using Ni particles doped with S or P, the present study identified the forms in which S and P exist on the particle surface. Furthermore, the effects of S and P on the decomposability of ethyl cellulose (EC), which is primarily used as a binder, was investigated.
2. Experimental Methods
2.1 Powder manufacture
Ni powder having an average particle size of 0.7 µm, manufactured using spray pyrolysis, was used in this study. Spray pyrolysis is a method of particle synthesis in which the spraying and thermal decomposition of a raw material solution having a target composition in a high-temperature furnace is followed by rapid cooling. Table 1 shows the composition of the raw material solutions of various Ni powders. The Ni raw material solution was prepared by dissolving nickel nitrate hexahydrate (Ensho Sangyo Co., Ltd.) in purified water (Ni concentration = 50 g/L). To reduce Ni, 10 mass% mono-ethylene glycol (Godo Co., Ltd.) was added to the raw material solution as a reducing agent. This raw material solution was used to obtain non-doped Ni powder for comparison. In addition, sulfuric acid (Wako Pure Chemical Industries, Ltd., special grade reagent) was used as the S source to obtain S-doped Ni powder, and phosphoric acid (Wako Pure Chemical Industries, Ltd., reagent first grade) was used as the P source to obtain P-doped Ni powder. Each acid was added to the Ni raw material solution so as to be 1000 ppm with respect to Ni. A spray box having a diameter of 30 cm equipped with eight ultrasonic oscillators having a diameter of 25 mm and a resonance frequency of 1.63 MHz on its bottom was used. Each raw material solution was circulated in a spray box and sprayed using ultrasonic oscillators. The atomized droplets were introduced by the carrier gas N2 (flow rate: 15 L/min) into a ceramic reaction tube heated to 1550°C by an electric furnace, and thermal decomposition was performed. Nickel nitrate was thermally decomposed to nickel oxide, and nickel oxide was reduced to Ni by H2 and CO generated by the thermal decomposition of mono-ethylene glycol. Ni is further heated to obtain molten Ni, which was cooled to produce spherical Ni particles. The as-produced powder was collected by a cyclone collector.

Table 1 Compositions of raw material solutions of non-doped, P-doped and S-doped Ni powder.
Low-magnification images of the Ni powder surface were obtained via scanning electron microscopy (SEM; S-4500, Hitachi High-Tech Corporation) following the attachment of the powder to the SEM sample table using carbon tape. Additionally, the powder was attached to a Cu mesh and analyzed using high-magnification SEM (HD-2000, Hitachi High-Tech Corporation). The crystallinity of the Ni powder was verified using X-ray diffraction (XRD; SmartLab, Rigaku Corporation), and the crystallite size was determined using the Halder–Wagner method.9) The modified state of the surface of the Ni powder was verified using X-ray photoelectron spectroscopy (XPS; ESCA-3400, Shimadzu Corporation) following the attachment of the powder to the XPS sample holder using carbon tape. The modified states of S and P inner the Ni particles were confirmed by alternately performing ion etching using Ar+ ions accelerated at a voltage of 2.0 keV and XPS measurement. Etching was performed for 10 min to adjust to the analysis depth 1 nm, for another 30 min to adjust to the depth 3.5 nm, for another 30 min to adjust to the depth 6 nm, for another 30 min to adjust to the depth 8.5 nm, for another 30 min to adjust to the depth 11 nm, for another 60 min to adjust to the depth 16 nm, for another 60 min to adjust to the depth 21 nm, and for another 120 min to adjust to the depth 31 nm. The oxidation behavior of the Ni powder was evaluated using thermogravimetry-differential thermal analysis (TG-DTA/TG-DTA2000SR, Bruker AXS) in air at a heating rate of 10°C/min. The reduction behavior was evaluated using hydrogen-gas-temperature-programmed reduction (H2-TPR/BELCAT II + BELMass, MicrotracBEL Corp.) in a 5 mol% Hydrogen/Argon atmosphere at a heating rate of 10°C/min. The desorption of gas from the Ni powder in an inert atmosphere was investigated using temperature-programmed decomposition (TPD/BELCAT II + BELMass, MicrotracBEL Corp.) in a helium atmosphere at a heating rate of 10°C/min.
2.3 Investigation of binder decomposition behavior
To investigate the binder decomposition behavior, the Ni powder was formed into a paste using the following procedure. Ethyl cellulose (EC/Dow Chemical Company: STD200, number average molecular weight Mn = 80000) was heated and dissolved in dihydroterpineol (DHT/The Nippon Koryo Yakuhin Kaisha, Ltd.) at a concentration of 10 mass%, and the mixture was used as the EC solvent. Subsequently, 5.0 g of the Ni powder and 2.5 g of the EC solvent were mixed, and the Ni powder was dispersed into primary particles using a three-roll mill. 2.5 g of DHT was added to the mixture to obtain a paste in which the Ni powder and EC were homogeneously mixed.
Samples of dried paste were used in the experiments to investigate the binder decomposition behavior. The samples were produced using a 250 µm applicator to form a Ni coating on a commercially available PET film coated with a release agent, followed by drying at 150°C for 15 min using a hot air dryer. Thereafter, the dried coating was peeled from the PET film and broken into squares having a side length of approximately 2 mm. The weight changes owing to the decomposition of EC in the Ni powder paste in a nitrogen atmosphere were measured via TG-DTA using the dried paste pieces. In the TG-DTA measurements, 100 mg of the dried paste pieces were placed in an alumina sample pan. High-purity alumina powder was used as the reference material. The changes in weight were measured by increasing the temperature up to 800°C at a heating rate of 10°C/min in a nitrogen atmosphere (N2 flow rate: 300 mL/min). To investigate the decomposition behavior of EC alone, TG-DTA measurements of the dry film of the EC solution were conducted in a nitrogen atmosphere at a heating rate of 10°C/min.
3. Results and Discussions
3.1 Properties of various Ni powders
Table 2 lists the physical properties and composition analysis results of the three types of Ni powders used in the experiments. The P content in the P-doped Ni powder was 1031 ppm or 0.19 mol%, which is within the solid solubility limit of P in Ni.10) The S content in the S-doped Ni powder was 597 ppm or 0.11 mol%, which exceeded the solid solubility limit of S in Ni.11)
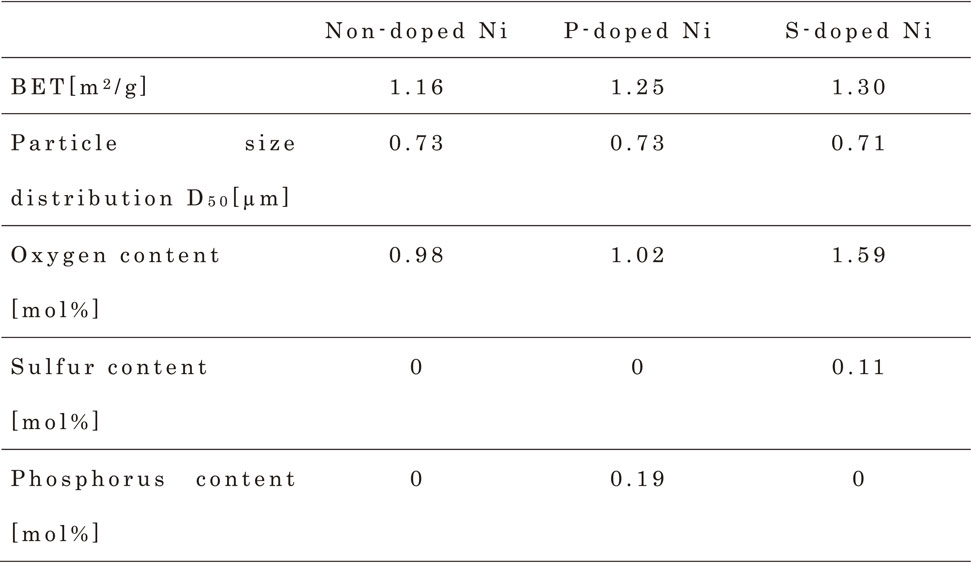
Table 2 Physical properties and composition analysis of non-doped, P-doped and S-doped Ni powder.
Figure 1 shows the SEM images of the Ni powders. The high-magnification SEM images revealed the presence of spherical particles in each powder. In non-doped Ni, facets were observed in places owing to their high crystallinity. In P-doped Ni, the particles were relatively smooth; however, distortions were observed. Relatively rough sections were observed in the S-doped Ni powder.
Figure 2 shows the XRD patterns of the Ni powders. The analysis depth of XRD is 10 µm. Since the particle size of Ni powders are 0.7 µm, the result is information on the entire particle (surface and inside). All the powders were composed of single-phase Ni with no impurity phases such as NiO. The non-doped Ni powder exhibited the largest crystallite size and high crystallinity, whereas the P- and S-doped Ni powders exhibited small crystallite sizes and low crystallinity. This might have occurred because P and S were solid-soluted in the Ni crystal, thereby distorting the crystalline structure of Ni.12)
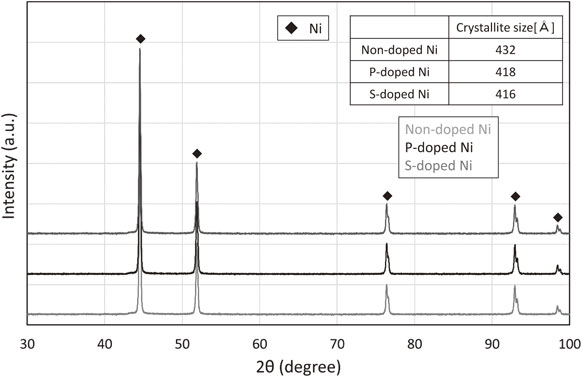
Figure 3 shows the Ni 2p XPS spectra of the powder surface of non-doped Ni (a), P-doped Ni (b), and S-doped Ni (c). The analysis depth of XPS is 1 nm or less. Since the particle size of Ni powders are 0.7 µm, the result is information only on the particle surface. The raw data is peak-separated into surface modification elements NiO (black solid line), Ni(OH)2 (gray solid line) and Ni or Ni–S or Ni–P (black dashed line) indicated by the arrows in the figure, and the bar charts representing the ratios of surface modification elements obtained by peak-separation, are also presented in Fig. 3(d). In each powder, more than 75% of the Ni particle surface was covered by NiO and Ni(OH)2. This occurred because during powder manufacturing, particles were formed around Ni in a high-temperature reducing atmosphere and NiO was formed on the particle surface via contact with an oxygen-containing atmosphere at 300°C or higher during cooling. In addition, Ni(OH)2 was formed via the adsorption of H2O from the surrounding atmosphere after the formation of NiO. The bar charts revealed that the content ratio of NiO to Ni(OH)2 was approximately 1:1 for the majority of the particle surfaces in non-doped Ni. The content ratio of NiO to Ni(OH)2 in S-doped Ni was similar to or higher than that in non-doped Ni, respectively. The content ratio of NiO to Ni(OH)2 in P-doped Ni was halved and increased, respectively, compared to that in non-doped Ni. The Ni/Ni–P ratio for P-doped Ni was higher than that for the other two powders.

Figures 4(a) and 4(b) show the S 2p and P 2p XPS spectra of the S-doped and P-doped Ni powder surfaces, respectively. As shown in Fig. 4(a), S–O and Ni–S were identified on the surface of S-doped Ni powder. Similarly to NiO, S–O was formed via the contact of S present on or near the surface of the particles with an oxygen-containing atmosphere at 300°C or higher during the cooling process in powder manufacturing. However, when Ni exists in the vicinity of S, the free energy change (ΔG) for the reaction 2Ni + SO2 = 2NiO + S is −34.3 kJ/mol at 527°C.13,14) Therefore, the forward reaction occurs, and S also exists as Ni–S. Figure 4(b) shows that only P–O was identified and Ni–P was not observed on the surface of P-doped Ni powder. Similarly to NiO, P–O was formed via the contact of P present on or near the surface of the particles with an oxygen-containing atmosphere at 300°C or higher during the cooling process in powder manufacturing. However, when Ni exists in the vicinity of P, the free energy change (ΔG) for the reaction 2Ni + 1/5P4O10 = 2NiO + 4/5P is 124.2 kJ/mol at 527°C.13,14) Therefore, unlike for S, the forward reaction is inhibited, and P exists solely as P–O. It was inferred that the Ni/Ni–P in P-doped Ni (Fig. 3(b)) represented the unmodified surface of Ni. Figure 5 shows the content ratio of the modifying elements in (a) S-doped Ni powder and (b) P-doped Ni powder in the depth direction, as determined by Ar+ ions etching and XPS measurement. Figure 5(a) shows that S–O was confirmed at a depth of 1 nm from the particle surface but was not confirmed at depths exceeding 1 nm, and Ni–S was confirmed at a depth of 21 nm form the particle surface, in S-doped Ni. The content of Ni–S attained its maximum at a depth between 1 and 3.5 nm. Figure 5(b) shows that P–O was confirmed at a depth of 11 nm from the particle surface but was not confirmed at depths exceeding 11 nm, and Ni–P was not confirmed at any depth, in P-doped Ni.


The TG-DTA measurements showing the oxidation behavior of each powder are presented in Fig. 6. The results indicated the progress of oxidation for all the Ni powders and increasing the temperature increased the weight. The oxidation commencement temperature is identified in the figure as the point of intersection of the tangents to the TG curve before and partway through the weight increase. The oxidation commencement temperatures of P-doped and S-doped Ni were low (∼390°C), and they differed by approximately 50°C from the oxidation commencement temperature of non-doped Ni (∼440°C). In the manufacturing process of MLCC, if Ni is oxidized during binder decomposition, it is reduced by subsequent firing in the reducing atmosphere and releases oxygen gas, which causes delamination and cracks. The oxidation commencement temperature of P-doped and S-doped Ni is lower than that of non-doped Ni, but it is higher than the decomposition commencement temperature of ethyl cellulose at 350°C.3) Therefore, it is considered that none of non-doped, P-doped and S-doped Ni are oxidized during binder decomposition.

The H2 and H2O profiles measured by H2-TPR showing the reduction behavior of each powder are presented in Fig. 7. These results indicated the amounts of H2 consumed and H2O produced via the reduction of NiO and Ni(OH)2 on the surface of each powder by H2. The reduction commencement temperature for S-doped Ni shifted to the high-temperature side. Furthermore, the amount of H2O produced was higher than that for non-doped Ni. P-doped Ni was marginally reduced at 145°C, similarly to non-doped Ni, and a reduction peak was observed in the range of 310–600°C. This may have occurred because the Ni that was not surface-modified by P–O was reduced at a low temperature similar to that for non-doped Ni. Subsequently, the Ni surface that was modified by P–O was reduced on the high-temperature side. If the Ni surface is modified by P–O, then the reduction commencement temperature is highest (310°C), and NiO and Ni(OH)2 are considered to be more stable. Table 3 lists the electronegativities of the elements constituting the Ni particle surface (Ni, S, P, and O) and the electronegativity differences of these bonds.15) The electronegativity differences were 1.53, 0.86, and 1.25 for the Ni–O, S–O, and P–O bonds, respectively. However, the main reduction commencement temperature for P-doped Ni was higher than that for S-doped Ni. This was because the difference in reduction commencement temperature was attributable to the difference in the bonding force between S–O and P–O. It was also influenced by the higher abundance ratio of Ni–O in S-doped Ni compared to that in P-doped Ni (Fig. 3).
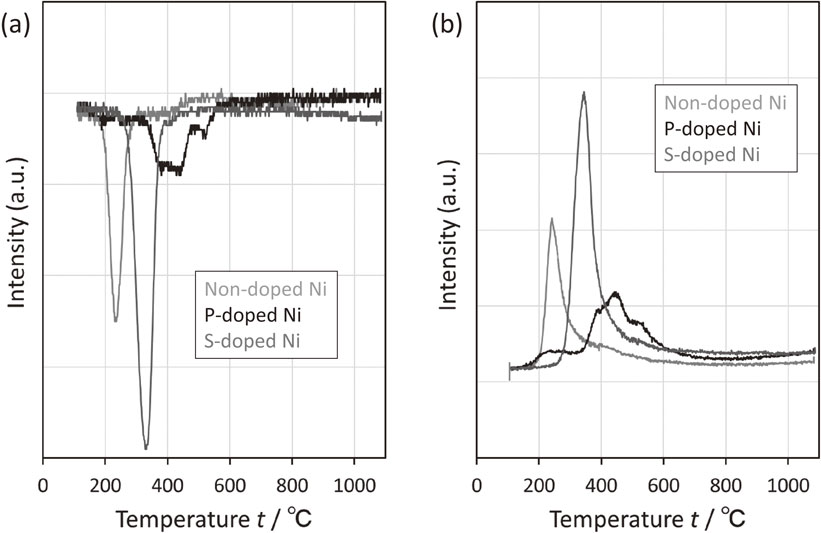

Table 3 Electronegativity of Ni, S, P, O and difference between electronegativity of Ni–O, S–O and P–O.
CO2 profiles measured by TPD showing the CO2 desorption behavior of each powder are presented in Fig. 8. Here, the CO2 desorption was attributed to desorption of the decomposition residue of the reducing agent that was re-adsorbed during powder manufacturing. In the CO2 desorption plots, a steep desorption peak was observed at 320°C in non-doped Ni, thereby indicating the low activation energy for CO2 desorption on the unmodified surface of Ni. Broad peaks were also observed between 250 and 600°C for S-doped Ni and P-doped Ni; however, they were significantly smaller than the peaks for non-doped Ni.
The SO profile measured by TPD showing the SO desorption behavior of the S-doped Ni powder is presented in Fig. 9. It was verified that SO was desorbed at approximately 900°C and not in the binder decomposition temperature range of 300–500°C.
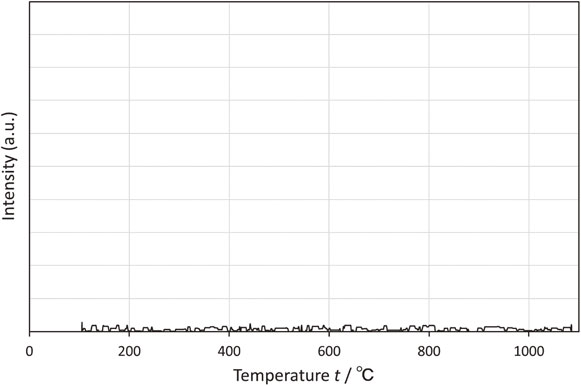
The P profile measured by TPD showing the P desorption behavior of the P-doped Ni powder is presented in Fig. 10. The form of P desorption was unknown, but the peak attributed to P was not confirmed. It was verified that P was not desorbed in the operating temperature range.
3.2 Binder decomposition behavior
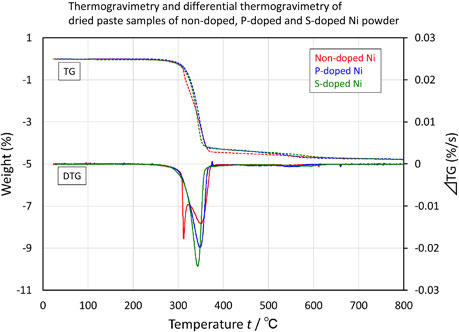
Figure 11 shows the results of the TG-DTA and differential thermogravimetry (DTG) measurements for the dried paste samples of each powder. The DTG curve shows the differential of weight change, i.e., the rate of weight loss. In the DTG curve, the main peak temperature was 350°C for all the powders; however, a sharp shoulder peak was observed at 310°C on the low-temperature side of the main peak solely for non-doped Ni. Figure 12 shows the TG and DTG plots recorded by TG-DTA for the dried film of the EC solution. The results revealed the decomposition behavior of EC alone, which was nearly identical to that reported in the literature.16–19) A gradual weight loss at 300°C was followed by a rapid weight loss caused by the decomposition of EC at 325°C. Furthermore, primary decomposition was verified by the appearance of a DTG peak at approximately 365°C. Therefore, the main peak at 350°C confirmed for all powders was ascribed to the self-decomposition of EC. The shoulder peak at 310°C, which was confirmed solely for non-doped Ni, was attributed to the Ni-catalyzed low-temperature decomposition of EC. Ni generally acts as a catalyst for various organic synthesis and decomposition reactions owing to the electrical affinity of the d-electron pores. Sugimura et al. have reported that Ni also catalyzes the combustion of EC.3) The unmodified surface of Ni in non-doped Ni, which is responsible for the steep peak at 320°C (Fig. 8), acts as a catalyst to lower the decomposition temperature of EC. Consequently, the DTG peak appears at a temperature lower than 365°C, which is the self-decomposition temperature of EC. The proportion of the unmodified surface of Ni was low for S-doped Ni, and the Ni surface was modified by S (Fig. 3 and 4). S poisons Ni catalysts by forming a strong chemical bond with Ni through the unshared electron pair.20) S suppressed the lowering of the decomposition temperature of EC. Consequently, the sole DTG peak observed at 350°C was the one corresponding to the self-decomposition of EC. P is also known to poison Ni catalysts; in general, a simple substance or compound that possesses an unshared electron pair acts as a catalyst poison.21) P–O bonds were detected on the particle surface of P-doped Ni (Fig. 4). They were probably identified with phosphate ((PO4)3−), pyrophosphate ((P2O7)4−), metaphosphate ((PO3)−), or diphosphorus pentoxide (P2O5). The proximity of the peak positions of the spectra hindered identification;22) however, these compounds were not considered to act as catalyst poisons owing to their lack of unshared electron pairs. Although the proportion of the unmodified surface of Ni was high for P-doped Ni (Fig. 3 and 4) as it was for non-doped Ni, the sole DTG peak appearing at 350°C corresponded to the self-decomposition of EC owing to the coating effect of P–O and not the catalyst-poisoning effect of P. A broad peak was observed between 250 and 600°C for S-doped Ni and P-doped Ni (Fig. 8). However, it was significantly smaller than the peak corresponding to the decomposition of EC; therefore, it did not appear as a DTG peak in Fig. 11.

Table 4 summarizes the S, P, and O contents, in mol% and mass%, in each Ni powder. The table also presents the estimated and measured (by TG-DTA) weight losses owing to the decomposition of EC in the dried paste samples of each Ni powder. When these powders were made into pastes, the amount of EC added was 5 mass% relative to Ni. Here, the weight loss during TG-DTA was estimated to be 4.76%. Table 4 revealed that all the samples exhibited nearly identical weight loss. This suggested that the reduction and decomposition of the modifying elements such as NiO, Ni(OH)2, Ni–S, S–O and P–O on the Ni powder surface did not influence the decomposition of EC contained in the dried paste samples of each Ni powder.

Table 4 Difference between the estimated and actual loss in dried paste samples of non-doped, P-doped and S-doped Ni powder.
4. Conclusion
S added during the production of Ni particles via spray pyrolysis existed in the form of S–O or Ni–S on the Ni particle surface and as Ni–S inside the particles. P added during the production existed as P–O in the vicinity of the Ni particle surface. The CO2 desorption behavior, measured by TPD, revealed the presence of a steep CO2 desorption peak at low temperatures only for non-doped Ni. It was confirmed that the activation energy for CO2 desorption was low only for non-doped Ni. When formed into a paste, the decomposition of EC was observed at temperatures lower than the self-decomposition temperature of EC owing to the catalytic effect of the unmodified surface of Ni in non-doped Ni. The catalysis of Ni was suppressed by the catalyst poisoning effect of S on the Ni catalyst in S-doped Ni and the coating effect of P–O in P-doped Ni. Decomposition was observed only at the self-decomposition temperature of EC.
REFERENCES
- 1) S. Igarashi: New Ceramic Powder Handbook, (Science Forum Co., Tokyo, 1983) pp. 457–462.
- 2) T. Nomura: Compact and Large Capacity and High Reliability of Multilayer Ceramic Capacitors and Material/Process Technology, (Information mechanism Co., Tokyo, 2018) pp. 79–82.
- 3) K. Sugimura and H. Ito: J. Soc. Powder Technol. Japan 45 (2008) 544–549. doi:10.4164/sptj.45.544
- 4) K. Nagashima: The Secret of Manufacturing Multilayer Ceramic Device, (TIC Co., Tokyo, 2014) pp. 166–173.
- 5) R. Ueyama, T. Ueyama, K. Koumoto and K. Kobayashi: J. Ceram. Soc. Jpn. 109 (2001) 351–354. doi:10.2109/jcersj.109.1268_351
- 6) K. Sugimura, K. Nakayama and N. Iida: J. Ceram. Soc. Jpn. 115 (2007) 182–185. doi:10.2109/jcersj.115.182
- 7) K. Sugimura, N.T.M. Diep, F. Iskandar and K. Okuyama: J. Soc. Powder Technol. Japan 46 (2009) 813–818. doi:10.4164/sptj.46.813
- 8) R. Ueyama, T. Ando, T. Morimitsu and Y. Hashizume: J. Ceram. Soc. Jpn. 115 (2007) 65–68. doi:10.2109/jcersj.115.65
- 9) N.C. Halder and C.N.J. Wagner: Acta Crystallogr. 20 (1966) 312–313. doi:10.1107/S0365110X66000628
- 10) M. Hansen and K. Anderko: Constitution of Binary Alloys, (Genium Pub. Corp., New York, 1958) pp. 1034–1036.
- 11) T.B. Massalski, J.L. Murray, L.H. Bennett and H. Baker: Binary Alloy Phase Diagrams, 2, (American Society for Metals, Ohio, 1986) p. 1739.
- 12) G.L. Krasko and G.B. Olson: Solid State Commun. 76 (1990) 247–251. doi:10.1016/0038-1098(90)90832-V
- 13) M.W. Chase, Jr.: NIST-JANAF Thermochemical Tables Fourth Edition Part II, (American Chemical society, New York, 1998) pp. 1750, 1811, 1824, 1864.
- 14) Nuclear Fuel·Nuclear Materials Thermodynamics Database, Japan Atomic Energy Agency, https://thermodb.jaea.go.jp/data/td/Ni(fcc).html (cited 2021-04-01) https://thermodb.jaea.go.jp/data/td/NiO.html (cited 2021-04-01).
- 15) Y. Iwasawa: Handbook of Chemistry Basic, I, (The Chemical Society of Japan, Tokyo, 2003) End paper.
- 16) X.G. Li, M.R. Huang and H. Bai: J. Appl. Polym. Sci. 73 (1999) 2927–2936. doi:10.1002/(SICI)1097-4628(19990929)73:14%3C2927::AID-APP17%3E3.0.CO%3B2-K
- 17) S.M. Lomakin, S.Z. Rogovina, A.V. Grachev, E.V. Prut and Ch.V. Alexanyan: Thermochim. Acta 521 (2011) 66–73. doi:10.1016/j.tca.2011.04.005
- 18) Z. Zhang, H. Zhang, Q. Zhang, Q. Zhou, H. Zhang, Z. Mo, X. Zhao and X. Wang: J. Appl. Polym. Sci. 100 (2006) 584–592. doi:10.1002/app.23338
- 19) H. Kawamoto: J. Jpn. Wood Res. Soc. 61 (2015) 1–24. doi:10.2488/jwrs.61.1
- 20) Y. Morita, M. Saito and K. Yamamoto: J. Soc. Chem. Ind., Japan 71 (1968) 1457–1462. doi:10.1246/nikkashi1898.71.9_1457
- 21) K. Tarama: Catalytic Engineering Course 2, (Catalytic Society, Tokyo, 1966) pp. 357–358.
- 22) NIST Standard Reference Database 20, Version 3.4 (web version). National Institute of Standards and Technology, Material Measurement Laboratory. https://janaf.nist.gov/periodic_table.html (cited 2021-04-01).