Abstract
Microbiologically influenced corrosion (MIC) is the rapid deterioration of structural materials induced by the action of microorganisms in an environment. Microbial adhesion and proliferation on the material surface are precursors to corrosion initiation, and if the material is stainless steel, its open-circuit potential can be ennobled. Therefore, extensive biofilm formation on metal surfaces and the ennoblement of the open-circuit potential of corrosion-resistant steels are recognized as indicators of MIC.
Numerous laboratory-scale studies have been conducted on the correlation between microbial adhesion on materials and initiation of MIC. However, only few studies have been conducted on the correlation between metallurgical factors of structural materials and the amount of microbes or flora on the material surface in actual environments.
We conducted systematic research focused on material types or alloying elements to investigate how such metallurgical factors affect microbial activity in the field. The corrosion behavior was examined using corrosion engineering methods such as potential measurement and weight loss evaluation. Thereafter, the amounts of microbes and flora adhering to copper, carbon steel, and stainless steel coupons in freshwater were determined using a genetic analysis method. Material analysis indicated that the no rapid change in potential over time was observed for the copper specimen, which ranged from −10 to 60 mV. Moreover, minimal surface stains such as slime was observed on the surface of the copper specimen when compared to the carbon steel surface, which exhibited significant amounts of rust within one month of exposure. Microbial analysis also showed a remarkable decrease in the concentration of bacteria on the surface of the copper specimen over time. These results indicate the considerable potential for the use of copper in practical environments. Thus, this study has captured the growth of microorganisms and the transition of microbial community structure reflecting nutrient requirements in parallel with the process of corrosion induction in an actual environment.
This Paper was Originally Published in Japanese in J. Japan Institute of Copper 60 (2021) 150–156. The captions of Table 1, Table 2, Fig. 3, Fig. 4 and Fig. 5 are slightly modified.
1. Introduction
The corrosion resistance of structural materials is significantly degraded by the action of microbes in the environment. This phenomenon is called microbiologically influenced corrosion (MIC)/biocorrosion, which is known to be caused by bacterial adhesion and growth on material surfaces. With MIC progression, the free corrosion potential of stainless steel becomes significantly nobler. Therefore, potential monitoring and understanding of the material properties in the environment are essential for evaluating MIC risk.
In this context, to properly consider MIC risk in the selection, utilization, and life prediction of structural materials, further understanding of materials science is required. For example, although stainless steel welds are susceptible to corrosion due to sensitization, the possibility that elemental segregation during solidification in welding processes may increase susceptibility to MIC should be considered. To reduce MIC risk through inhibition of bacterial adhesion, copper, which has antibacterial properties and corrosion resistance, can be used as a containment vessel for the geological disposal of radioactive waste.1) Numerous laboratory-scale studies have been conducted on the correlation between bacterial adhesion on material surfaces and the initiation of MIC, both in Japan and other parts of the world.2) However, to the best of our knowledge, only a few field studies have been conducted on the correlation between the types of structural materials and the amounts of microbes and flora on their surfaces. The authors conducted a systematic field study to investigate how material types affect the adhesion and growth of microorganisms on metal surfaces due to microbes in the environment, using dozens of diverse metal materials. Herein, we report the results of a study on copper, carbon steel, and stainless steel based on the corrosion and genetic analyses of industrial water facilities that exhibit a high risk of MIC.
2. Experimental Procedure
2.1 Test material
Three types of metals were used as test material, namely, pure oxygen-free high-conductivity (OFHC) copper (C1020), carbon steel (SPCC-SB), and austenitic stainless steel (American Iron and Steel Institute type 304). For each material, small and large specimens with dimensions of 50 mm × 20 mm and 150 mm × 50 mm, respectively, were prepared. The smaller specimens were mainly used for corrosion evaluation and genetic analysis, and the number of specimens, n, was set to 3 for each test material. The larger specimens were primarily used for free corrosion potential measurements. The surfaces of all specimens were finished using 600-grit emery paper. The chemical composition of each specimen is listed in Tables 1(a) and (b).
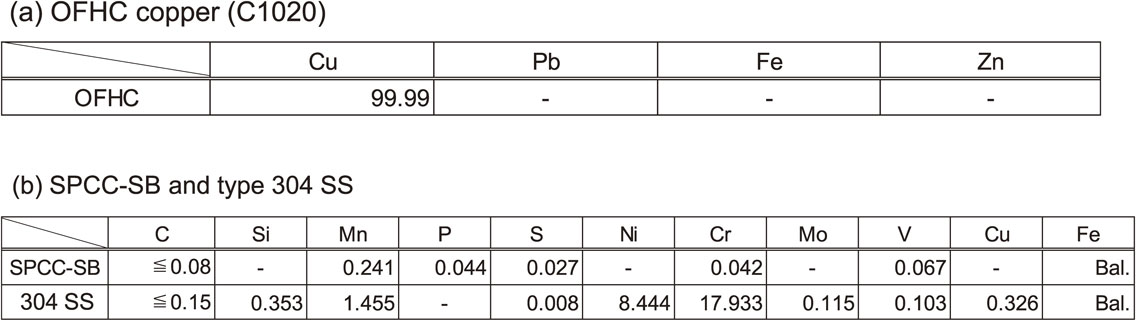
Table 1 Chemical composition of test specimens (mass%). (a) OFHC copper (C1020) (b) SPCC-SB and type 304 SS.
An exposure test was performed at an industrial water storage pool in an energy plant, where the ennoblement of the free corrosion potential was occasionally observed in type-304 stainless steel (304 SS) in the preliminary tests. The water used in this study was industrial fresh water that originated from the neighboring natural rivers, and chemical properties such as chloride ion concentration and pH were not at levels that predicted corrosion risks. The chemical composition of this water, based on the measurements conducted on November 7, 2018, is listed in Table 2. This storage pool serves as the water storage facility for fire protection; consequently, the volume of the pool was designed to be approximately 1,100 m3. In contrast, the actual amount of water that is consumed for industrial use is only equal to a small amount of overflow. This implies that a stagnant environment is maintained in the reservoir, and the environment is considered to be favorable for microbial growth.
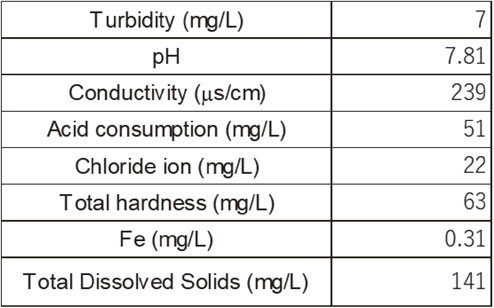
Table 2 Results of water quality inspection.
The free corrosion potential was measured using a Ag/AgCl reference electrode (hereafter, the potential is based on the Ag/AgCl electrode), and data were obtained periodically during the test via manual measurements and automatic measurements using a voltage data logger. The specimens were exposed to the water in the storage pool in the following manner. Each specimen was suspended from the opening hatch of the storage pool using a Teflon wire in the shape of a raft and placed at a sufficient distance from the adjacent specimens. The specimens were installed with the observation surface facing horizontally upward.
2.3 Corrosion analysis
The corrosion effects of the specimens were evaluated via surface observation and corrosion weight loss measurement. After removing the specimens for gene analysis as described below, the small specimens were ultrasonically cleaned in 99.5% ethanol, thoroughly air-dried, and stored in desiccators for weight measurement in the laboratory. For the removal of corrosion products for gravimetric analysis, ASTM G1-033) and ISO 84074) standards were adopted as appropriate.
The corrosion rate was calculated using the following equation.
| \begin{equation}
\textit{Corrosion Rate} = \frac{K \times W}{A \times T \times D}
\end{equation}
| (1) |
Where
K is a constant
$(8.76 \times \frac{10^{4}\,\text{mm}}{y})$,
T is the exposure time in h,
A is the total surface area in cm
2,
W is the mass loss in g, and
D is the density in g/cm
3.
2.4 Deoxyribonucleic acid extraction
One liter of environmental water was collected from the immersion environment, and the suspension was collected by filtration using a membrane filter (Advantec MFS, Inc.) with a pore diameter of 0.22 µm. Deoxyribonucleic acid (DNA) from microorganisms was extracted from the collected suspension as follows. The specimens were brought back to the laboratory, and the microorganisms adhering to the surface were scrubbed off into a polyethylene bag with 1.8 mL of DNA/ribonucleic acid (RNA) shield solution (Zymo Research). The recovery solution was collected in a 2.0-mL microtube and centrifuged at a speed of 16,000 × g for 10 min, following which the supernatant was discarded. DNA was extracted from the obtained pellets via the above procedure, using the ZymoBIOMICS DNA/RNA Miniprep Kit (Zymo Research) according to the instructions provided in the manual. The DNA concentrations were measured using a Qubit dsDNA HS Assay Kit (Thermo Fisher Scientific).
2.5 Quantification of the amount of microorganisms
The amount of microorganisms attached to the surface of each specimen was evaluated via a quantitative polymerase chain reaction (qPCR) test to determine the copy number of the 16S ribosomal RNA (rRNA) gene using genomic DNA extracted by the method described in Section 2.4. A two-step polymerase chain reaction (PCR), i.e., an initial denaturation at 95°C and an extension step at 60°C, was performed using StepOneTM (ThermoFisher Scientific), a THUNDERBIRD® probe, SYBR® qPCR Mix (Toyobo), and a primer set, i.e., 341F/534R. Calibration curves were obtained using a serial dilution of the standard solution with a preknown copy number of Escherichia coli 16S rRNA gene.
2.6 Microbial community analysis
Using the extracted DNA as the template, partial 16S rRNA genes were amplified via PCR using the 530F/907R primer set by targeting bacterial and archaeal 16S rRNA genes. At this time, a tag (X7) consisting of any seven bases was added to the primers for the identification of each sample; thereafter, DNA pools were prepared by matching the molar ratio of each amplified fragment and mixed with PhiX Sequencing Control v3 (Illumina) to obtain a reading sample. The reading samples were analyzed using MiSeq Reagent Kit v3 (Illumina) and next-generation sequencer MiSeq (Illumina) to obtain the nucleotide sequences of each read.
The acquired FASTQ files were treated using the Quantitative Insights into Microbial Ecology 2 (QIIME2) pipeline to organize sequences corresponding to the tags, remove primer sequences, remove errors using DADA2, and perform clustering as operational taxonomic units (OTUs). Based on the representative sequence information for each out, taxonomy analysis was performed using the SILVA 138 (99% OTUs full-length sequences) reference database to identify closely related species for molecular phylogenetic analyses. α- and β-diversity metrics were calculated and plotted using the core-diversity and emperor plugins.
3. Results
3.1 Change in corrosion potential depending on the experimental period microbial community analysis
Figure 1 shows the results of corrosion potential measurements for each test specimen. In the case of type-304 SS, a rapid increase in potential nobleness was observed within 10 d of exposure. Thereafter, the degree of potential increase decreased marginally but reached approximately 300 mV (vs. Ag/AgCl) after 30 d and remained almost constant thereafter. In the case of OFHC copper, no rapid potential change was observed after exposure, and the potential remained in the range of −10 to 60 mV. In contrast, in the case of SPCC-SB, a rapid drop in the potential was observed for the first five days after exposure, followed by a gradual increase from −760 to −660 mV.
3.2 Surface inspection before and after the exposure experiment
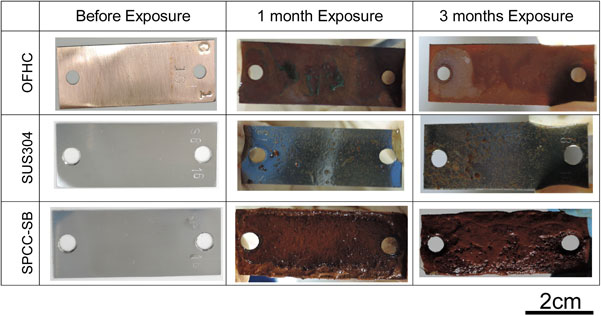
Figure 2 shows the results of the exposure test in an aerobic environment, showing the observation results of the sample surfaces before exposure and after one and three months of exposure. In the case of type-304 SS, the staining tendency increased significantly depending on time. Although no evidence of corrosion could be visually confirmed, a nonuniform slime, suggesting the formation of a biofilm, was observed. In the case of OFHC copper, although a fading of the luster was observed, surface stains such as slime were minimal. In the case of SPCC-SB, corrosion products (red rust) were formed to the extent that the base metal was completely invisible within one month. Although the experimental period was only three months, the surface staining of copper was considered to be insignificant relative to other materials based on the qualitative judgments according to surface observations.
3.3 Quantitative evaluation of the microorganisms attached to the specimen surface
Figure 3 shows the qPCR results of the 16S rRNA gene according to the amount of microorganisms attached to the surface of each specimen immersed under aerobic conditions. In this case, the amount of microorganisms was defined as the number of gene copies of the 16S rRNA gene. Evaluation was conducted after one and three months of exposure for each material to understand the changes over time. The amount of microorganisms attached to the surface of OFHC copper in terms of the slime formed on the surface was determined to be minimal, i.e., the lowest amount at less than 107 copies/cm2. When considering the variations over time, OFHC copper, which was the only nonferrous metal used in this study and is classified as the only antimicrobial metal here, showed the smallest amount of attached microorganisms and a remarkable decreasing tendency in the attached microorganisms, i.e., a single digit decrease to approximately 106 copies/cm2.

The total number of analytical reads of the microbial gene recovered from environmental water, metal surfaces, and corrosion products was 560,411 for nine analysis target samples (as shown in Fig. 4 and Table 3). The average number of reads for each sample was 62,267. The sample with the highest number of reads was OFHC copper (three months) at 76,203; conversely, the lowest number of reads was environmental water (three months) at 51,343, as listed in Table 3. The numerical value of OTUs was 1,209; moreover, type-304 SS exhibited the highest number with 638 OTUs, and OFHC copper had the lowest number with 90 OTUs. The OTUs comprising each sample showed distinct characteristics. Heterotrophic microorganisms such as the unidentified bacteria of the Comamonadaceae family, which is closely related species of genus Sideroxydans, and Novosphingobium spp. were detected in the environmental water samples. Unidentified species of the Beggiatoaceae family were remarkably accumulated (76.1% after one month and 19.3% after three months) in the OFHC copper samples, and related species of Dechloromonas sp. were accumulated (24.9% after one month and 19.3% after three months) on the SPCC-SB samples, as shown in Fig. 4. Conversely, no clear accumulation was observed in type-304 SS samples, except for an unidentified species of class Cyanobacteriia, which accounted for the highest proportion of 3.7% of the total.

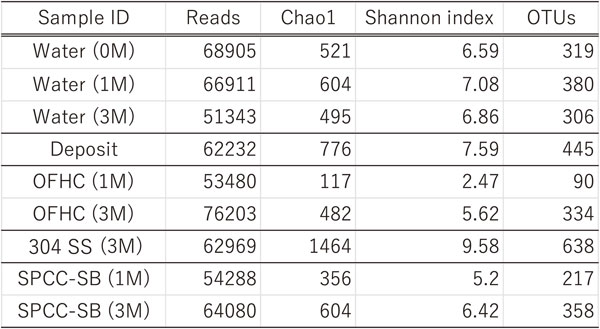
Table 3 Information for 16S rRNA gene sequencing of the samples.
4. Discussions
4.1 Material analysis
Potential noblement in corrosion-resistant steels and reduced noblement in normal carbon steels are common features of the free corrosion potential behavior in natural freshwater environments. The idea of relating these potential fluctuations to microbial activity is widely supported. In particular, when considering the corrosion potential level of stainless steel in natural seawater, an increase in potential of up to 200 mV or higher is considered as a risk for MIC initiation.5) In this case, the speed of the potential ennoblement of type-304 SS was confirmed to be significantly high in this study. Although it may be premature to immediately conclude that this ennoblement behavior poses an MIC risk, we can consider that the experimental environment where the stainless steel specimen was exposed to unsterilized fresh water in the reservoir was sufficient to reproduce the potential noblement and risk of MIC initiation. Thus, the potential mobilization in the type-304 SS specimen in this study suggests a sufficient increase in the growth of a passive film in the test specimen and the risk of initiation of pitting corrosion. Conversely, although the pitting corrosion of stainless steel is often monitored as a sudden decreasing behavior of the corrosion potential from a state of noble potential, a larger specimen of type-304 SS in this study showed no decreasing behavior during the experimental period; moreover, the surface of type-304 SS did not show pitting corrosion during surface inspection. The results can be further verified through continued potential measurements and periodic specimen sampling surveys.
When compared to the type-304 SS specimen, SPCC-SB exhibited a significant decrease in potential. As the corrosion mode of this specimen was typical general corrosion, the potential fluctuation toward the cathode can be interpreted as a dissolution of the iron from the surface of the specimen. A significant amount of red rust layer was observed on the surface of the SPCC-SB specimen at the end of the experiment, and the calculated corrosion rate was highest among the materials examined, as shown in Fig. 5. However, the value was in the range of 0.1 to 0.14 mm/y,6) which is only marginally higher than the corrosion rate in fresh water, such as tap water without a flow effect. For example, when the corrosion of carbon steel by sulfate-reducing bacterium, which is widely recognized as a causative agent of MIC, is reproduced in a laboratory-scale experiment, the corrosion rate is expected to be 35 mils per year (equivalent to 0.9 mm/y).7) However, the corrosion rate observed in this study is significantly low when compared to these values. Therefore, in the case of SPCC-SB, the effect of microorganisms on corrosion initiation during this experimental period was judged to be small. The corrosion rate was derived from eq. (1) by measuring the corrosion weight loss values of a specimen that was exposed for approximately one and three months. In the case of SPCC-SB, there is a significant difference between the corrosion rates in the first and third months, because it has the lowest corrosion resistance among the tested materials and the surface is significantly corroded in the initial stage of exposure; however, after significant amounts of corrosion products are formed, corrosion progression may be mitigated by the corrosion products.

In the case of the OFHC copper specimen, no sudden potential fluctuations were observed during the experiment, and the fluctuation ranged from −10 to 60 mV. Although the surface of the specimen faded over time and gradually lost its luster, no corrosion damage to the metal surface was visually observed, and the weight loss due to corrosion was significantly small. Water quality analysis confirmed that the pH of industrial water was approximately 7. Conversely, the potential during the experiment was in the range of 0.19 to 0.26 V versus the standard hydrogen electrode reference. By comparing these results to the potential–pH diagram,8) we can estimate that the change in color on the specimen surface is due to the formation of Cu2O precipitation products. Although Cu2O is easily susceptible to flow velocity, it is considered to be a stable corrosion-resistant oxide under static conditions. No corrosion damage was observed on the OFHC copper specimens during the experiment. Thus, we can consider that the influence of flow velocity and other factors in the industrial water tank was negligible. However, the adhesion of microorganisms such as slime on the surface of the specimens was not negligible, although it was significantly less than that on other test materials. These are discussed in the subsequent section.
4.2 Microbial analysis
In general, environmental water contains several unculturable or difficult-to-cultivate microorganisms. As a countermeasure, a genetic analysis technique called qPCR was employed, instead of the culture method, to evaluate the amount of attached microorganisms, and the amount of adhered microorganisms was estimated based on the number of copies of 16S rRNA gene per unit area (1 cm2). Although all prokaryotes have 16S rRNA genes, the copy number of gene in a cell varies from 1 to 20 (average of ∼5), depending on the microbial species. Therefore, the copy number itself does not precisely correspond to the number of cells; however, all the results of this study are based on similar microbiota in the same environment. Based on this assumption, we determined that the gene copy number can be used as an indicator for the relative assessment of microbial abundance. The advantage of this method is that it enables comprehensive, mechanical, and rapid quantification of the population of microorganisms in an environment without the need to cultivate them in a nutrient medium; consequently, in recent years, this method has been introduced into MIC research. It is a well-known fact that the number of microorganisms that cannot be restored in nutrient media is significantly high; therefore, this method is effective in estimating the scale and actual condition of microorganisms growing in an environment where MIC is suspected. The results of this study show that the amount of microbial adhesion (gene copy number) was lower in the case of OFHC copper specimens than in the case of the other specimens, and this value tended to decrease depending on time. This result indicates the antimicrobial effect of copper in the environment. However, even in SPCC-SB, where significant amounts of corrosion products were formed, the gene copy number tended to decrease depending on time. In this case, we would like to clarify the influence of factors other than antimicrobial and bactericidal effects. Currently, in the process of a validation study, it is relatively easy to recover microorganisms and microorganism-derived organics from samples to be analyzed such as the OFHC copper specimen, where little or no corrosion has occurred; in contrast, in materials with significant corrosion, the percentage of microorganisms and microorganism-derived organic matters that can be recovered is significantly low because of the relatively large proportion of corrosion products. Therefore, in the case of the SPCC-SB specimen, which is a highly corroded material, the data may not accurately reflect the amount of microbial genomes present on the metal surface because of the significant amounts of corrosion products. This implies that corrosion products can act as a disturbance, which may result in a lower estimate of the actual gene content. A similar case is demonstrated in the genetic analysis of soil samples, where gene recovery is inhibited by the adsorption of nucleic acids on soil particles. However, in this case, a method was established to prevent gene recovery inhibition by adding additives during DNA extraction.9) The amount of corrosion products was so large that we used a kit that allows DNA extraction from environmental samples such as soil samples. However, the efficiency of gene recovery from SPCC-SB is lower than those from OFHC copper and type-304 SS. This is because the effect of additives may have been masked and the water layer containing nucleic acid solution may have remained in the corrosion products during DNA extraction. We would like to clarify the effects of significant amounts of corrosion products that are identified in carbon steel through relative verifications in future.
Microbial community structures were analyzed by the amplicon sequencing of 16S rRNA gene fragments using a next-generation sequencer. The results, which were statistically processed without any culture manipulation, showed exhaustive and mechanically derived genetic information of microorganisms in the environment. Based on the obtained microbial analysis information, further analysis of α- and β-diversities was conducted. Here, α-diversity indicates the species diversity of the microbial community in each sample, while β-diversity indicates the comparison of the diversity of the microbial community structure among samples.
First, we discuss α-diversity analysis. The OFHC copper specimen (after one month) showed the lowest number of OTUs (90), Chao1 value (117), and Shannon index (2.47), which indicates species evenness. This result clearly indicates a low diversity, and the accumulation of the Beggiatoaceae family is reasonable (Fig. 4). This species was not detected in the water samples, and only 3.0% was present in sediments. In contrast, type-304 SS showed the highest diversity among the analyzed specimens, as indicated by the Chao1 value of 1,464 and Shannon index of 9.58. Corresponding to the high diversity, specific microorganisms were not accumulated, and the unidentified class, Cyanobacteriia, was the most abundant at only 3.7% (Fig. 4). The Shannon index values of SPCC-SB were 5.20 and 6.42 after one and three months, respectively, which are predominantly greater than that of the OFHC copper sample (after one month) and close to the value in environment water, indicating that the diversities of both samples are similar. However, the genus Dechloromonas bacterium was predominantly observed at ∼20% in both SPCC-SB specimens (Fig. 4); however, it was difficult to detect this bacterium in the OFHC copper, type-304 SS, and water samples. These results indicate that the microbial communities of the SPCC-SB, OFHC copper, and water samples with relatively lower α-diversity differ from each other.
Next, β-diversity was analyzed to evaluate the differences between each sample, and principal coordinates analysis (PCoA) (weighted UniFrac, Fig. 6) plots were created. This plot shows the presence and number of OTUs in each community structure. The UniFrac distance is a metric distance based on the phylogenetic distances of OTUs observed in microbial communities. This implies that community structures with small UniFrac distances are plotted close to each other and are similar; conversely, the community structures with wide UniFrac distances are plotted far from each other, forming different microbial community structures. In this PCoA plot, the OFHC copper samples are clearly located away from the water and deposit samples, i.e., the sediments in the aerobic pool. This result suggests that a special microbial community structure is formed on the surface of the OFHC copper specimens. Conversely, the microbial community on the SPCC-SB surface showed similar α-diversity to that of the water samples, whereas the β-diversity analysis showed that the microbial community structure clearly differed from that of environmental water, deposit/aerobic pool sediments, and the attachments on OFHC copper (Fig. 6). This result is consistent with the accumulation of the species related to Dechloromonas sp. In comparison with the quantitative PCR results, the decrease in the amount of attached microorganisms on the OFHC copper specimen is a simple decrease in the amount of microorganisms and shows different effects on different species of microorganisms. In other words, the unidentified species of the Beggiatoaceae family could survive relatively easily on the OFHC copper specimen.

This implies that, in a real environment, OFHC copper can reduce the population of several microorganisms that constitute the environment, which can be confirmed by molecular biological methods. In future, we plan to accumulate experimental data and microbiological analysis results, including the visualization of the antimicrobial spectrum of metals. The effective use of microbial analysis methods is expected to reveal a new phase of antimicrobial research on metals. Conversely, from the perspective of MIC research, the SPCC-SB specimen, in which the amount of attached microorganisms was clearly high, exhibited the presence of large quantities of Dechloromonas sp., which is rarely detected in environmental water. Dechloromonas spp. can obtain energy by oxidizing Fe(II) ions that are dissolved by chemical or biological corrosion to Fe(III) ions. In other words, we have succeeded in capturing the growth of microorganisms and the transition of the microbial community structure reflecting nutrient requirements in parallel with the process of corrosion induction in an actual environment.
5. Conclusion
-
(1)
Through the investigation of the free corrosion potential of stainless steel via the exposure test, potential ennoblement was reproduced, and the probability of MIC risk was clarified.
-
(2)
qPCR analysis confirmed that the amount of adhered microorganisms on the surface of OFHC copper with antimicrobial properties was lower than those on the surfaces of other samples (steel) without antimicrobial properties; moreover, this study quantitatively clarified that the antimicrobial properties were demonstrated in a real environment that was not closed.
-
(3)
Microbial community analysis revealed differences between the community structure formed on copper surfaces and that in environmental water or on steel material surfaces; furthermore, it revealed differences in microbial susceptibility to the antimicrobial effects of copper.
Acknowledgments
The authors would like to acknowledge that this research was supported by a 2014 research grant from the Japan Institute of Copper. This work was also supported by the Japan Society for the Promotion of Science Grant-in-Aid for Scientific Research (B) 20H02460, Young Scientists (A) 17H04719, and NACE-TJS MIC Research Grant.
We would like to thank Furukawa Electric Co., Ltd. and Mr. Masaaki Kurihara, Technical Department, Japan Copper Development Association for providing the test materials.
We would also like to express our deepest gratitude to Mr. Y. Kashima, Mr. K. Watanabe, Mr. M. Kobayashi, and Mr. I. Homma of INPEX Naoetsu LNG Terminal for their invaluable support and assistance in conducting this research.