Abstract
Laser-wire-based directed energy deposition (DED) is a type of additive manufacturing. We investigated the chemical composition and fatigue performance to verify the usefulness of Ti–6Al–4V fabricated by laser-wire-based DED which deposited dot-shaped beads on a base material and conducted in preventing atmospheric intrusion with local shielding only. We compared the fatigue performance to a wrought material equivalent to AMS4967M and evaluated the deposited material in the as-fabricated condition. The chemical composition of the deposited material was within the specifications for the alloy. The fatigue strength at 1 × 10⁷ cycles of the deposited material was more than 100 MPa higher than that of 682 MPa of the wrought material. Perhaps the high fatigue strength of the deposited material was caused by the low porosity and the acicular α′ martensitic phase. From these results, we showed the usefulness of Ti–6Al–4V deposited by a laser-wire-based DED to which local shielding was applied.
1. Introduction
Due to such social demands as environmental load reduction and energy savings, the need for reducing the weight of transportation equipment is increasing. As a material that corresponds to this demand, titanium alloy with excellent specific strength is used in the aerospace and automotive fields, for example.1,2) However, this alloy’s use is limited because its manufacturing cost is high since its productivity and yield are low in such conventional processes as forging and casting.3–5) Thus, such net shaping as metal additive manufacturing (AM) and powder metallurgy (PM) has received attention as a technology that reduces production cost.6,7)
Metal AM is a technology for making arbitrarily shaped objects from 3D model data using a heat source (a laser, an electron beam, or a plasma arc) and a feedstock (metal powder or a wire), and layer upon layer deposits.8) One advantage of metal AM is its nearly unlimited design freedom; it is starting to be utilized as a technology to achieve topology optimization for weight reduction. Metal AM technology is especially promising in the aerospace industry because it can reduce the buy-to-fly ratio, which is the weight of the raw material divided by the weight of the final component. This decreases production cost.9) There are mainly two metal AM methods: powder bed fusion (PBF) and directed energy deposition (DED). In the PBF process, a powder bed is selectively melted to form layers using a laser or an electron beam, and DED is carried out by simultaneously feeding powder or wire and irradiation with a laser, an electron beam, or a plasma arc.8) DED has advantages of fewer size restrictions and simpler application for repairing parts than PBF.6,10,11) Using a laser as a heat source minimizes the material distortion and deterioration compared to such repair technology as tungsten inert gas welding and electron-beam-based DED.12,13) On the other hand, compared to powder, applying a wire as a feedstock simplifies the process setup and operation and reduces material loss, raw material cost, and the contamination risk due to a small surface to weight ratio.14,15) For the above reasons, research on Ti–6Al–4V deposited by DED using a laser and a wire has recently been promoted for aviation fields.16)
In parts or components, such as turbine blades and combustion gas turbines that are typically loaded with cyclic low-stress, fatigue failure is a leading design consideration.17) However, industry understanding of the fatigue performance of an additively manufactured Ti–6Al–4V is inadequate since such research remains in its infancy. For example, the fatigue properties of Ti–6Al–4V deposited by DED have been reported.18–20) Zhao et al. demonstrated that Ti–6Al–4V fabricated by laser metal deposition (LMD), which uses powder as a feedstock, presents the anisotropy of fatigue life and crack propagation due to columnar β grains.18) Sterling et al. found that the fatigue strength of a Ti–6Al–4V alloy fabricated by laser engineered net shaping (LENS) was inferior to that of a wrought material with equiaxed grains.19) Such lower fatigue strength is largely a consequence of porosity. Biswal et al. investigated the fatigue performance of a wire arc additive manufacturing (WAAM) Ti–6Al–4V and concluded that the fatigue strength of a Ti–6Al–4V fabricated using contaminated wire was reduced due to pore sizes over hundreds of microns.20) The fatigue strength of a Ti–6Al–4V deposited by laser-wire-based DED has also been investigated.21–23) Brandl et al. demonstrated high cycle fatigue properties that match or exceed those of the material specifications of AMS 4928 of wrought Ti–6Al–4V.21) However, DED in previous works was conducted with such size restrictions as in an open box flooded by argon gas or in a chamber filled with argon gas.21–23) Such a large chamber is uneconomical for accommodating large fabrication. Furthermore, a conventional laser-wire-based DED that deposits linear beads complicates control of the metallographic structure due to the tendency for heat accumulation over time. To solve these practical problems, we devised a new fabrication method that deposits dot-shaped beads. Therefore, the aim of this study is to aid in further assessing the mechanical properties, with emphasis on fatigue performance, of Ti–6Al–4V deposited by a laser-wire-based DED. We conducted a laser-wire-based DED by preventing atmospheric intrusion with local shielding only without relying on a chamber to better exploit the above DED advantages. The deposited material was evaluated in its as-fabricated condition.
2. Experimental Procedure
2.1 Experimental setup and deposition procedure
Figure 1 shows schematic of the experimental system that we designed originally. It is comprised of a customized laser oscillator IPG YLS-6000, a laser processing head HIGHYAG BIMO-HP with zoom module (M = 1.1–1.7), a wire-feeding apparatus, and a computer numerically controlled (CNC) machine for the following five motions: a horizontal motion (x and y axes), a vertical motion (z axis) and a rotation motion (a or b axis and c axis). In this study, we used three motions: x axis, y axis, and z axis. A laser beam with a top-hat energy distribution characteristic in the focus position was aimed at the deposited surface of the substrate, resulting in a 2.6 mm diameter laser beam spot. The wire-feeding angle was fixed at 45° toward the surface of the substrate. An argon shielding gas was used to prevent the oxidation of the deposited material.

The following is the deposition procedure. While the laser beam created a molten pool on the deposited surface of the substrate, the wire feedstock stored on the spool is fed into the molten pool by the wire-feeding apparatus. Then a dot-shaped molten bead is formed by not moving each axis. Subsequently, before the molten bead is solidified by stopping the irradiation of the laser beam, and the wire feedstock is removed from the molten bead to prevent the wire feedstock and bead from bonding together. Then the deposition point is moved to the next one to form another dot-shaped bead. Due to intermittent heating, this dot-forming process does not easily generate excess heat accumulation compared with a linear bead forming process. In this study, the samples were deposited by overlaying dot-shaped beads in the horizontal (x and y) and vertical (z) directions while jetting shielding gas toward the bead. Table 1 lists the fabrication details, which were determined as conditions with few pores by preliminary experiments.

Table 1 Deposition details.
We used commercially available, 1.2 mm diameter Ti–6Al–4V wire (AWS ERTi-5) feedstock. 120 mm (W) × 85 mm (D) × 10 mm (H) Ti–6Al–4V plates were used as a substrate for deposition. The wrought material, which used as comparative material of the deposited material, was forged at an upsetting ratio of 80% at approximately 1123 K with a commercially available material and was subjected to a heat treatment with reference to Aerospace Material Specifications (AMS) 4967M.
2.3 Microstructural analysis and material evaluation
Chemical composition was analyzed using an optical emission spectrometer for metallic elements and a method of carrier gas hot extraction and high frequency combustion for non-metallic elements.
The samples for an optical microscope (OM) (OLYMPUS GX71) observation were mechanically polished. The final polishing was carried out with colloidal silica suspension (0.08 µm). Then the polished surfaces were etched in a 1.4 vol% HNO3, 1.9 vol% HF, and 96.7 vol% H2O solution. The phase constitutions were examined on an X-ray diffractometer (XRD) (Bruker D8 ADVANCE) using a Cu-Kα radiation source. Microstructures and crystal orientations were observed by a scanning electron microscope (SEM) (Hitachi SU5000) and an electron backscatter diffraction (EBSD) (TSL Solutions).
Transmission observation for the evaluation of internal pores was done by an X-ray computed tomography (CT) equipment (Zeiss Metrotom800).
Analysis and evaluation were carried out using the middle portion of the deposited material.
2.4 Mechanical testing
The tensile specimens were assessed on an AG-X plus (Shimadzu) universal testing machine at room temperature with a test velocity of 0.2 mm/min. Dumbbell-shaped plate specimens had a 10-mm gauge length and a 2 mm2 gauge cross area. In addition to comparing the strength of the deposited and wrought materials, we conducted a tensile test for confirming whether the wrought material we heat-treated satisfied AMS 4967M.
According to the American Society for Testing and Materials (ASTM) E466, we performed a fatigue test on an ElectroPuls E10000 (Instron) at 296 K in the atmosphere. A test frequency of 30 Hz and a load ratio of R = 0.1 were used. Figure 2 shows a fatigue test specimen.21) Specimens were machined from both the deposited and wrought materials and polished longitudinally to impart a maximum surface roughness of 0.2 µm.
3. Results and Discussion
3.1 Chemical compositions and pores
The chemical compositions of each material and the ASTM standards for Ti–6Al–4V are presented in Table 2. The deposited material was in agreement with the ASTM standards, suggesting that the oxidation of Ti–6Al–4V can be prevented by only local shielding. The oxygen content of the deposited material exceeded that of the wire as a feedstock within a range satisfying the ASTM standards. Although increasing oxygen concentration lowers the resistance against crack growth, we assumed that the fatigue performance of the deposited material hardly decreases, based on the results of previous work because the increase in the oxygen concentration was as slight as approximately 0.02 mass%.24,25)

Table 2 Chemical composition (in mass percent).
Figure 3 shows an X-ray CT image of the deposited fatigue test specimen, which had one pore. Although some of the deposited specimens had no observable pores, others had a few spherical ones whose diameters were smaller than approximately 100 µm. The pores were probably caused by gas entrapment.26) In the wrought material, the pores were not confirmed by X-ray CT, cross-section, or fracture surface observations. The reduction of pores in the deposited material is a subject for future study.
3.2 Microstructures
Figures 4(a) and (b) show the XRD patterns of the deposited and the wrought Ti–6Al–4V. α phase peaks were indexed in both materials. In the wrought material, β phase peaks were also indexed. In the deposited material, peak broadening was observed at angles lower than the top of the peak at approximately 40 degrees. This broadening suggests the existence of an acicular α′ martensitic phase. The low-angle peak of the double peak observed at approximately 64 degrees was due to α′ martensitic phase.27) Therefore, it is conceivable that the cooling rate was higher than 410 K/s from above the martensite start temperature with reference to a continuous cooling transformation (CCT) diagram for Ti–6Al–4V.28)

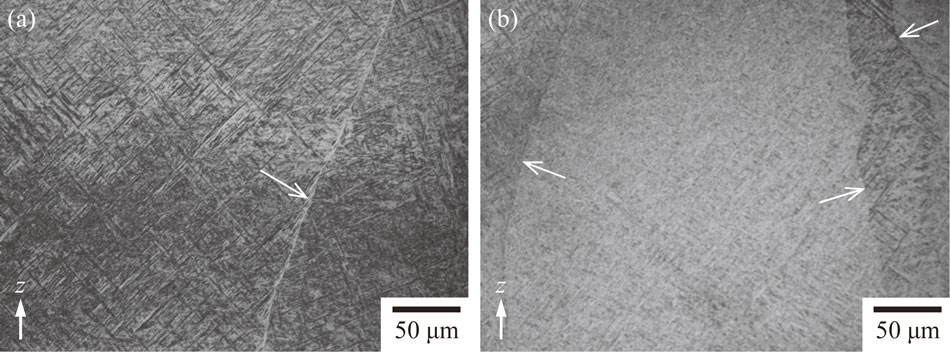
Figures 5(a) and (b) show the EBSD image quality (IQ) maps of the deposited and wrought samples. The deposited material had an acicular structure that consisted of α laths, and the wrought material had a bi-modal structure that consisted of equiaxed grains with an average size of approximately 10 µm and a lamellar structure. No grains, which only grew in a specific direction, were observed in either sample. However, when observed at lower magnification as shown in Fig. 6, the deposited material had coarse columnar prior β grains that grew almost parallel to the z-direction across the bead boundary. The minimum feret diameter of most of the prior β grains exceeded approximately 0.1 mm. It is conceivable that the columnar prior β grains grew epitaxially, parallel to the z-direction due to the thermal gradient introduced by the subsequent layers that were added. Figures 7(a) and (b) show optical microscope images of the field of view, including the prior β grain boundaries. In both images, an acicular structure was observed in the prior β grains. There was also a case where grain boundary α was present at the prior β grain boundary and another where grain boundary α was not present at the prior β grain boundary. This difference in microstructure was caused by the cooling rate, and grain boundary α appears when the cooling rate is relatively slow.22)

Table 3 displays the tensile testing results. The tensile property of the wrought material was in agreement with AMS4967M. The yield strength (YS) and the ultimate tensile strength (UTS) of the deposited specimens were lower than the wrought ones, although the total elongation (El) was higher on average. The Young’s modulus was similar. When comparing each direction in the deposited specimens, the specimens parallel to the z-direction had higher ductility than the specimens parallel to the x-direction because the columnar prior β grain boundaries where grain boundary α is present affected the ductility anisotropy.29) Since the tensile stress in the x-direction specimens is perpendicular to the prior β grain boundaries, they seem to act as a force to separate grain boundary α. On the other hand, the tensile stress in the z-direction specimens is parallel along grain boundary α, and hence soft grain boundary α effectively increased the ductility.

Table 3 Average tensile properties of Ti–6Al–4V measured three times.
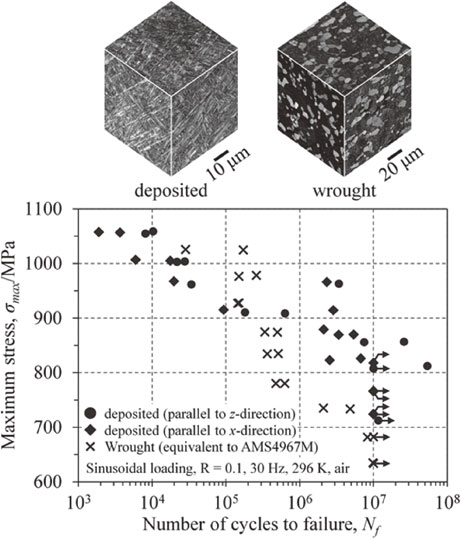
The fatigue test result is presented in Fig. 8. In the low cycle regime of approximately 3 × 10⁵ cycles or fewer, the wrought material had higher fatigue strength than the deposited material. In the high cycle regime of approximately 3 × 10⁵ cycles or more, the deposited material had higher fatigue strength than the wrought material. The fatigue strengths at 1 × 10⁷ cycles based on JIS Z 227330) were respectively 856, 795, and 682 MPa of the deposited material parallel to the z-direction, the deposited material parallel to the x-direction, and the wrought material.

First, we address why the deposited material had greater fatigue strength than the wrought material in the high cycle regime. Figure 9(a) shows the deflection of the fatigue crack propagation along the α laths in the deposited specimen tested in the high cycle regime. In the wrought specimen tested in the high cycle regime, a smooth fatigue crack propagation along the equiaxed α grains was observed as shown in Fig. 9(b). A possible explanation for the deflection observed in the deposited material is an increase in the required energy to propagate a crack.31)

According to Ref. 19), Ti–6Al–4V fabricated by laser engineered net shaping (LENS) using powder as a feedstock has lower fatigue strength than wrought Ti–6Al–4V with equiaxed grains due to multiple pores. Ti–6Al–4V fabricated by powder bed fusion (PBF) using a laser also had many pores, although the fatigue strength of the hot isostatic pressing (HIP) processed PBF Ti–6Al–4V was significantly improved since most of the pores are closed.32) However, the fatigue strength is comparable to that of the wrought Ti–6Al–4V with an equiaxed α – β microstructure even with a HIP-processed laser-based PBF Ti–6Al–4V.33) Luo et al. argued that the increase in the number of pores promotes the initiation of fatigue cracking and decreases the fatigue life.34) In our deposited material, the pores confirmed by X-ray CT scan were at most a few in the gauge section of one fatigue test specimen. Akgun et al. reported that the threshold pore diameter, which affects the fatigue life in the regime of approximately 1 × 10⁴ cycles or more, is 85 µm for WAAM Ti–6Al–4V.35) Figure 10 arranges the Fig. 8 results in terms of the pore size that initiated the fatigue cracks. The pore diameters were measured from the fracture surface obtained by SEM observation. As shown in Fig. 10, the fatigue strength did not significantly decrease, especially not to the level of the wrought material when the observed pore diameter was 85 µm or less. Hence, we expect that a few, small pores suppressed the decline of the fatigue strength.

The pores entrapped in powder remain in the fabricated material in metal additive manufacturing processes using powder.36) The pores in wire are probably eliminated during a wire-drawing process. In fact, as shown in Fig. 11, no pores were observed in the wire material. It is considered that their absence in the deposited raw material reduced the number of pores in the deposited material.

On the other hand, Brandl et al. concluded that, as a rule of thumb, the fatigue limit increases with a decrease in the α lath thickness.37) Seifi et al. confirmed a decrease in the crack-growth resistance when α laths are coarsened.38) Finer microstructures strengthen the crack initiation resistance due to increased slip band density.39) In Ref. 36) using laser as a heat source and wire as a feedstock, the fatigue strength at 1 × 10⁷ cycles in the building direction has approximately 780 MPa using the fabricated material with 2 µm-thick α lath. The HIP process coarsens the α lath thickness, nearly doubling it,37) and the laser-based PBF Ti–6Al–4V post-treated by HIP described above has an α lath thickness of approximately 3 µm.33) The fatigue strength at 1 × 10⁷ cycles in our deposited material with 0.7 µm α lath thickness was 856 MPa under almost the same conditions conducted by Brandl et al.21) The thin lath thickness compared to other AM processes can probably be ascribed to the higher cooling rate for our process.
Therefore, the higher fatigue strength of the deposited material in this study can be attributed to low porosity and a thin α lath thickness. The α lath thickness depends on the scanning speed of the heat source, which correlates with the cooling rate. The higher the cooling rate is, the thinner the α lath thickness.40,41) We assumed that the low porosity was caused by using wire as a feedstock, and the thin α lath thickness was caused by the increased cooling rate due to the dot-forming process of the jetting shielding gas, which does not easily generate excess heat accumulation.
Second, the deposited specimens parallel to the z-direction had higher fatigue strength than the deposited specimens parallel to the x-direction because the anisotropy in the low cycle fatigue behavior was attributed to the anisotropy in the ductility, which is related to the columnar prior β grain.42) The greater fatigue strength in the low cycle regime in the z-direction corresponds to the elongation results indicated in Table 3. In a high cycle regime, the prior β grain boundaries, including grain boundary α, prevent fatigue crack propagation.31,43) Figures 12(a)–(d) show SEM images of typical fracture surfaces in specimens parallel to the z- and x-directions. The fatigue fracture surface across the prior β grain boundary was observed as staircase-like features along the crack path, as shown by the hollow black arrow in Fig. 12(b). In the specimens parallel to the z-direction, such features were clearly observed. The specimens parallel to the z-direction have a higher frequency that crosses the prior β grain boundaries because the prior β grain grew in the z-direction. This is probably the reason why the deposited specimens parallel to the z-direction had a higher fatigue strength.

According to the above results, this study exhibited the usefulness of Ti–6Al–4V deposited by laser-wire-based DED with local shielding that reduces the effect of restriction in size by avoiding the use of a chamber for preventing oxidation.
4. Conclusions
Our study assessed the fatigue performance of Ti–6Al–4V deposited by a laser-wire-based DED. We conducted a laser-wire-based DED by depositing dot-shaped beads under preventing atmospheric intrusion with local shielding only. A fatigue test was conducted at room temperature. The deposited material was evaluated in the as-fabricated condition. These results were compared to wrought material equivalent to AMS4967M. The following are our main conclusions:
-
(1)
The chemical composition of the deposited material was within the specifications for the alloy.
-
(2)
The deposited material had a higher fatigue strength than the wrought material with an equiaxed α – β microstructure in the high cycle regime of approximately 3 × 10⁵ cycles or more. The high fatigue strength of the deposited material in the high cycle regime was likely caused by low porosity and a small diameter pore, and the microstructure, which effectively suppressed the fatigue crack growth, was composed of an acicular α′ martensitic phase and a prior β grain boundary. The acicular α′ martensitic phase had a 0.7 µm lath thickness.
-
(3)
The fatigue strengths were 856 and 795 MPa at 1 × 10⁷ cycles based on JIS Z 2273 of the deposited specimens parallel and perpendicular to the building direction. The fatigue strength of the deposited specimens was more than 100 MPa higher than the wrought specimens.
REFERENCES
- 1) A.K. Jha, S.K. Singh, M.S. Kiranmayee, K. Sreekumar and P.P. Sinha: Eng. Fail. Anal. 17 (2010) 1457–1465. doi:10.1016/j.engfailanal.2010.05.007
- 2) C. Veiga, J.P. Davim and A.J.R. Loureiro: Rev. Adv. Mater. Sci. 32 (2012) 14–34.
- 3) Y. Yan, G.L. Nash and P. Nash: Int. J. Fatigue 55 (2013) 81–91. doi:10.1016/j.ijfatigue.2013.05.015
- 4) K. Faller and F.H. Froes: JOM 53 (2001) 27–28. doi:10.1007/s11837-001-0143-3
- 5) A. Mitchell: Mater. Sci. Eng. A 243 (1998) 257–262. doi:10.1016/S0921-5093(97)00810-1
- 6) D. Gu: Laser Additive Manufacturing of High-performance Materials, (Springer-Verlag, Berlin, 2015) pp. 1–13.
- 7) F.H.S. Froes, M.N. Gungor and M.A. Imam: JOM 59 (2007) 28–31. doi:10.1007/s11837-007-0074-8
- 8) ISO/ASTM 52900:2015, Additive manufacturing -General principles- Terminology.
- 9) E. Brandl, F. Palm, V. Michailov, B. Viehweger and C. Leyens: Mater. Des. 32 (2011) 4665–4675. doi:10.1016/j.matdes.2011.06.062
- 10) S. Nam, H. Cho, C. Kim and Y.M. Kim: Metals 8 (2018) 607–622. doi:10.3390/met8080607
- 11) T. Wohlers, I. Campbell, O. Diegel, R. Huff and J. Kowen: Wohlers Report 2020 3D Printing and Additive Manufacturing Global State of the Industry, (Wohlers Associates, Fort Collins, 2020) pp. 62–64.
- 12) B. Graf, A. Gumenyuk and M. Rethmeier: Phys. Procedia 39 (2012) 376–381. doi:10.1016/j.phpro.2012.10.051
- 13) J.S. Keist, S. Nayir and T.A. Palmer: Mater. Sci. Eng. A 787 (2020) 139454. doi:10.1016/j.msea.2020.139454
- 14) B. Baufeld, E. Brandl and O. van der Biest: J. Mater. Process. Technol. 211 (2011) 1146–1158. doi:10.1016/j.jmatprotec.2011.01.018
- 15) S.H. Mok, G. Bi, J. Folkes, I. Pashby and J. Segal: Surf. Coat. Technol. 202 (2008) 4613–4619. doi:10.1016/j.surfcoat.2008.03.028
- 16) E. Brandl, A. Schoberth and C. Leyens: Mater. Sci. Eng. A 532 (2012) 295–307. doi:10.1016/j.msea.2011.10.095
- 17) R.K. Nalla, R.O. Ritchie, B.L. Boyce, J.P. Campbell and J.O. Peters: Metall. Mater. Trans. A 33 (2002) 899–918. doi:10.1007/s11661-002-0160-z
- 18) S. Zhao, K. Yuan, W. Guo, Y. He, Y. Xu and X. Lin: Int. J. Fatigue 136 (2020) 105629. doi:10.1016/j.ijfatigue.2020.105629
- 19) A. Sterling, N. Shamsaei, B. Torries and S.M. Thompson: Procedia Eng. 133 (2015) 576–589. doi:10.1016/j.proeng.2015.12.632
- 20) R. Biswal, X. Zhang, A.K. Syed, M. Awd, J. Ding, F. Walther and S. Williams: Int. J. Fatigue 122 (2019) 208–217. doi:10.1016/j.ijfatigue.2019.01.017
- 21) E. Brandl, B. Baufeld, C. Leyens and R. Gault: Phys. Procedia 5 (2010) 595–606. doi:10.1016/j.phpro.2010.08.087
- 22) P. Åkerfeldt, M.L. Antti and R. Pederson: Mater. Sci. Eng. A 674 (2016) 428–437. doi:10.1016/j.msea.2016.07.038
- 23) N. Chekir, Y. Tian, R. Gauvin, N. Brodusch, J.J. Sixsmith and M. Brochu: Mater. Sci. Eng. A 724 (2018) 335–347. doi:10.1016/j.msea.2018.03.101
- 24) M.R. Bache, W.J. Evans and M. McElhone: Mater. Sci. Eng. A 234–236 (1997) 918–922. doi:10.1016/S0921-5093(97)00402-4
- 25) K. Dietrich, J. Diller, S.D. Goff, D. Bauer, P. Forêt and G. Witt: Addit. Manuf. 32 (2020) 100980. doi:10.1016/j.addma.2019.100980
- 26) P.A. Kobryn, E.H. Moore and S.L. Semiatin: Scr. Mater. 43 (2000) 299–305. doi:10.1016/S1359-6462(00)00408-5
- 27) H. Beladi, Q. Chao and G.S. Rohrer: Acta Mater. 80 (2014) 478–489. doi:10.1016/j.actamat.2014.06.064
- 28) T. Ahmed and H.J. Rack: Mater. Sci. Eng. A 243 (1998) 206–211. doi:10.1016/S0921-5093(97)00802-2
- 29) B.E. Carroll, T.A. Palmer and A.M. Beese: Acta Mater. 87 (2015) 309–320. doi:10.1016/j.actamat.2014.12.054
- 30) JIS Z 2273. General rules for fatigue testing of metals, Japan Industrial Standards, (1978) (in Japanese).
- 31) H. Galarraga, R.J. Warren, D.A. Lados, R.R. Dehoff and M.M. Kirka: Eng. Fract. Mech. 176 (2017) 263–280. doi:10.1016/j.engfracmech.2017.03.024
- 32) X. Zhao, S. Li, M. Zhang, Y. Liu, T.B. Sercombe, S. Wang, Y. Hao, R. Yang and L.E. Murr: Mater. Des. 95 (2016) 21–31. doi:10.1016/j.matdes.2015.12.135
- 33) R. Molaei, A. Fatemi and N. Phan: Int. J. Fatigue 117 (2018) 352–370. doi:10.1016/j.ijfatigue.2018.07.035
- 34) Y.W. Luo, B. Zhang, X. Feng, Z.M. Song, X.B. Qi, C.P. Li, G.F. Chen and G.P. Zhang: Mater. Sci. Eng. A 802 (2021) 140693. doi:10.1016/j.msea.2020.140693
- 35) E. Akgun, X. Zhang, R. Biswal, Y. Zhang and M. Doré: Int. J. Fatigue 150 (2021) 106315. doi:10.1016/j.ijfatigue.2021.106315
- 36) A. Bauereiß, T. Scharowsky and C. Körner: J. Mater. Process. Technol. 214 (2014) 2522–2528. doi:10.1016/j.jmatprotec.2014.05.002
- 37) E. Brandl, C. Leyens and F. Palm: IOP Conf. Ser. Mater. Sci. Eng. 26 (2011) 012004. doi:10.1088/1757-899X/26/1/012004
- 38) M. Seifi, A. Salem, D. Satko, J. Shaffer and J.J. Lewandowski: Int. J. Fatigue 94 (2017) 263–287. doi:10.1016/j.ijfatigue.2016.06.001
- 39) N. Shamsaei, A. Yadollahi, L. Bian and S.M. Thompson: Addit. Manuf. 8 (2015) 12–35. doi:10.1016/j.addma.2015.07.002
- 40) X. Gong, J. Lydon, K. Cooper and K. Chou: J. Mater. Res. 29 (2014) 1951–1959. doi:10.1557/jmr.2014.125
- 41) L. Ding, Z. Sun, Z. Liang, F. Li, G. Xu and H. Chang: Metals 9 (2019) 1270. doi:10.3390/met9121270
- 42) V. Chastand, A. Tezenas, Y. Cadoret, P. Quaegebeur, W. Maia and E. Charkaluk: Procedia Structural Integrity 2 (2016) 3168–3176. doi:10.1016/j.prostr.2016.06.395
- 43) R. VanSickle, D. Foehring, H.B. Chew and J. Lambros: Mater. Sci. Eng. A 795 (2020) 139993. doi:10.1016/j.msea.2020.139993