1. Introduction
Improving the corrosion resistance of metallic materials is an important research topic because it leads to more efficient use of minerals and energy.1) Therefore, several studies on corrosion prevention have been conducted considering various aspects such as alloying elements, microstructures, heat treatments, coatings, and inhibitors.2–11) High-entropy alloys (HEAs) have attracted the attention of many scientists and engineers as a promising concept for corrosion-resistant alloy design.12–15) HEAs are typically composed of five or more elements with elemental concentrations varying from 5 to 35 at%.16,17) This variety of elemental combinations has the potential to achieve high performance in severe and complex environments, which cannot be achieved using conventional alloys. Because HEAs are multicomponent alloys, it may be possible to develop alloys with two or more desirable properties such as high pitting corrosion resistance and high oxidation resistance. In this study, we developed a high-entropy alloy with high pitting corrosion and oxidation resistance.
In stainless steels and HEAs containing Fe, Cr is known to be effective for improving the pitting corrosion resistance,18–20) and Al is effective for improving the high-temperature oxidation resistance.21,22) No unified view on the effect of Al on the pitting corrosion resistance of stainless steels exists to date;23–27) however, studies on HEAs have revealed that Al decreases the pitting corrosion resistance.28–30) Lee et al.28) prepared AlxCrFe1.5MnNi0.5 (x = 0, 0.3, and 0.5) alloys and performed potentiodynamic polarization in 1 M NaCl. They demonstrated that the addition of Al to the alloys reduced their resistance to pitting corrosion. Ye et al.29) studied the effects of the Al content on the corrosion resistance and high-temperature oxidation resistance of a CoCrFeMnNi HEA cladding layer prepared using microbeam plasma. They concluded that the fine and dense Al2O3 oxide film slowed the diffusion of metal and O atoms at high temperatures, but the addition of Al reduced the corrosion resistance of the cladding layer in a 3.5% NaCl solution. Garip et al.30) assessed the cyclic oxidation performance and electrochemical corrosion behavior of CoCrFeNiAlx (x = 0.7, 0.85, and 1.0) HEAs and concluded that Al increased the cyclic oxidation resistance but reduced the pitting corrosion resistance in 3.5% NaCl. However, it is unclear why Al reduces pitting corrosion resistance because the microstructure changes depending on the Al content, and Al-containing nonmetallic inclusions are also formed by Al addition.31–33) Fu et al.34) studied the impact of solid-solution Al on the corrosion behavior and passive film properties of FeCoCrNiAlx (x = 0.1, 0.3) alloys in 0.5 M HCl. They proposed that the negative effect of Al addition to the HCl solution was caused by metastable ion complexes containing Al and chloride ions. Although the mechanism remains unknown, Al reduces the pitting corrosion resistance of HEAs. To the best of our knowledge, there are no reports on alloy designs that combine the oxidation resistance of Al and pitting corrosion resistance of Cr. Alloys with high pitting corrosion resistance and high oxidation resistance are expected to be useful in the exhaust gas systems of marine engines and chemical industrial equipment. Hence, achieving both pitting corrosion resistance and oxidation resistance is a valuable research subject.
Since HEAs are multi-component alloys, there is a possibility that alloying elements which do not contribute to corrosion resistance may be unfortunately introduced to surface oxide films. In the case of the equiatomic CoCrFeMnNi alloy, it has been reported that Mn oxide is present in the air-formed surface film and reduces the pitting corrosion resistance.35,36) Therefore, surface film modification by potentiodynamic polarization in H2SO4 has been reported to be a method to remove Mn oxide and improve pitting corrosion resistance.36) In addition to surface films, Mn-containing inclusions have been reported to form in CoCrFeMnNi alloys and act as initiation sites for pitting corrosion.36,38) Pang et al.37) reported that MnCr2O4 was generated in a CoCrFeMnNi alloy and that pitting corrosion preferentially originated from the MnCr2O4/matrix interface. Thus, surface modification and removal of Mn-containing inclusions are demonstrated to improve the pitting corrosion resistance of the CoCrFeMnNi alloy. Analogously, by modifying the surface film composition and removing harmful inclusions in a HEA containing Cr and Al, both high pitting corrosion resistance and high oxidation resistance are expected to be achieved.
In this study, a HEA with a solid solution of Al was prepared based on the microstructure of an equiatomic AlCoCrFeNi alloy. The pitting corrosion and oxidation resistances of the fabricated Al-containing HEA were evaluated, and the effects of potentiodynamic polarization in H2SO4 on the pitting corrosion and oxidation resistances were determined, including the mechanisms involved.
2. Materials and Methods
2.1 Materials
Equiatomic Al20Co20Cr20Fe20Ni20, non-equiatomic Al8Co19Cr23Fe32Ni18, and non-equiatomic Co19Cr23Fe40Ni18 alloys were fabricated. Hereafter, the Al20Co20Cr20Fe20Ni20, Al8Co19Cr23Fe32Ni18, and Co19Cr23Fe40Ni18 alloys are referred to as the Al20, Al8, and Al0 alloys, respectively. The fabrication concept of these alloys is described in Section 3.1. High-purity Al, Co, Cr, Fe, and Ni fragments (at least 99.9% purity) were used as raw materials. Arc melting was performed under a Ti-gettered Ar atmosphere. The ingot was remelted at least thrice and flipped each time to improve its chemical homogeneity. Ingots (30 g) with diameters of approximately 30 mm and thicknesses of approximately 12 mm were fabricated. They were hot-rolled at 1473 K to reduce their thickness to 2 mm. After hot rolling, heat treatment was performed at 1473 K for 2 h (water quenching). The specimens were ground using SiC paper up to #1500 and then polished with 6 µm and 1 µm diamond pastes before electrochemical measurements and high-temperature oxidation.
2.2 Material characterization and surface analysis
The microstructures of the fabricated alloys were observed using an optical microscope (OM). A mixture of HNO3 and HCl was used for the etching. The crystal structures were analyzed using X-ray diffraction (XRD). Cu Kα radiation was generated from a Cu target with a Ni filter. Before the data analysis, the contribution of Kα2 was removed. A field-emission scanning electron microscope (SEM) equipped with an energy-dispersive X-ray spectroscopy (EDS) system was used for surface observation and chemical analysis. Secondary electron (SE) and backscattered electron (BSE) images were obtained at an electron-accelerating voltage of 20 kV, and the EDS maps were acquired at the same accelerating voltage.
Auger electron spectroscopy (AES) was used to analyze the air-formed passive films. After polishing the specimen surface to develop an air-formed film, the specimen was stored for 24 h in ambient air (with a relative humidity of approximately 40% and temperature of 298 K). The accelerating voltage for the AES was 5 kV, and the current of the electron beam was 5 nA. To acquire the depth profile, the specimen surface was etched using an Ar+ beam with a tilt of 30° and an accelerating voltage of 2 kV. When calculating the film thickness, the etching rate was assumed to be the same as that for the thermally oxidized SiO2 film on Si (i.e., 1.13 nm min−1).
2.3 Pitting corrosion resistance
To assess pitting corrosion resistance, potentiodynamic polarization was performed in deaerated 0.1 M and 1 M NaCl at 298 K using a conventional three-electrode method. The scan rate of the electrode potential was 23 mV min−1. The size of the working electrode area was 5 mm × 5 mm for 0.1 M NaCl and 500 µm × 500 µm for 1 M NaCl. A battery-powered potentiostat39) was used when polarization was performed by the 500 µm square electrode. In this study, all potentials refer to the Ag/AgCl (3.33 M KCl) electrode.
2.4 High-temperature oxidation
The high-temperature oxidation was performed in air using a muffle furnace. The specimens were placed on an alumina plate, and the temperature was raised to 1273 K in 1 h. Then, the temperature was kept at 1273 K for 0.5 or 20 h. The specimens were then cooled in a furnace. The masses of the specimens were measured before and after oxidation to calculate the mass gain during oxidation.
2.5 Potentiodynamic H2SO4 treatment
For surface modification, potentiodynamic polarization was performed at 298 K in deaerated 1 M H2SO4 as following procedure: (1) natural immersion for 10 min, (2), potentiostatic cathodic polarization at −0.55 V for 10 min, and (3) potentiodynamic polarization from −0.55 to 0.5 V. The dimensions were approximately 7 mm × 7 mm. After the potentiodynamic H2SO4 treatment, when measuring the pitting potential, a working electrode area was fabricated in the center of the 7-mm square area.
3. Results and Discussion
3.1 Materials characterization
First, equiatomic Al20Co20Cr20Fe20Ni20 (Al20 alloy) was fabricated and its microstructure was studied. Figure 1 shows an SEM image and the corresponding EDS maps of the etched surface of the Al20 alloy. As shown in the SEM image, two different phases are observed: matrix and secondary phases. EDS point analysis was performed at Points 1 (matrix phase) and 2 (secondary phase), and the relative concentrations are listed in Table 1. According to the EDS data (Table 1 and Fig. 1), the matrix of this alloy is rich in Al and Ni, and the second phase is rich in Cr and Fe. Co is present in both phases but is slightly abundant in the second phase. To elucidate the effect of Al content on pitting corrosion and high-temperature oxidation resistance, a homogeneous microstructure is required. Moreover, a higher Cr content is desired to obtain an alloy with higher pitting corrosion resistance; hence, a non-equiatomic Al8Co19Cr23Fe32Ni18 (Al8 alloy) was fabricated based on the compositions of the second phase.


Table 1 Target and measured compositions (at%) of Al20, Al8, and Al0 alloys.
Figure 2 shows an SEM image and the corresponding EDS maps of the as-polished surface of the Al8 alloy. The SEM image shows that a homogeneous microstructure is obtained, and the EDS maps indicate that the distribution of the alloying elements is uniform. EDS point analysis was performed at Point 3, and the relative concentrations were confirmed to be in agreement with the target composition, as shown in Table 1. This alloy was found to be suitable for analyzing the effect of Al in a solid solution on corrosion and oxidation resistance. In addition, an Al-free nonequiatomic Co19Cr23Fe40Ni18 (Al0 alloy) was prepared as a reference. Figure 3 shows an SEM image and the corresponding EDS maps of the as-polished surface of the Al0 alloy. A homogeneous microstructure is observed. The composition of the Al0 alloy was analyzed using EDS, and the relative concentrations are listed in Table 1. The relative concentrations at Point 4 were generally in agreement with the target composition.
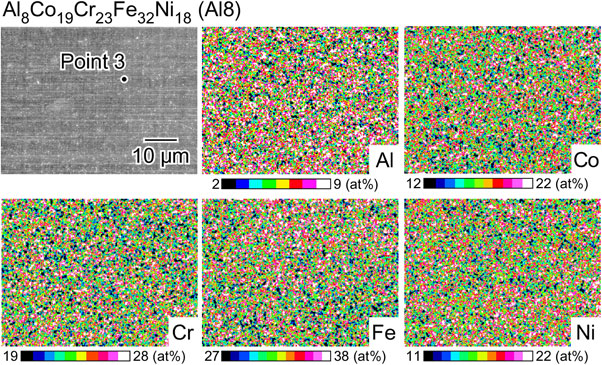
Figure 4 shows the XRD patterns of the fabricated alloys. For the Al20 alloy, the observed peaks are assigned to the FCC or BCC phases. In contrast, only the FCC peaks are observed for the Al8 and Al0 alloys. In previous studies on AlCoCrFeNi-based high-entropy alloys, it was demonstrated that the decrease in Al content facilitates the formation of FCC.31,32,40) The microstructural observations in this study are consistent with these results. By analyzing the microstructure of the equiatomic dual-phase Al20Co20Cr20Fe20Ni20 alloy, an FCC single-phase alloy containing approximately 8 at% Al was successfully fabricated. Because the Al-free Al0 alloy is also a single-phase FCC alloy, the effect of Al on the pitting corrosion resistance and high-temperature oxidation resistance can be comprehended by comparing these two alloys.

As described above, the Al8 and Al0 alloys are homogeneous in microstructure and composition, but non-metallic inclusions exist. Figure 5 shows SEM images of typical inclusions and the corresponding EDS maps. As shown in Fig. 5(a) and 5(b), Al oxide and Al nitride are present in the Al8 alloy, and Cr oxide inclusions are observed in the Al0 alloy. Both O and N probably remained in the arc-melting atmosphere. Because Al is more susceptible to oxidation and nitridation than Cr, Al oxide and Al nitride were generated in the Al8 alloy. EDS point analysis was performed at Points 5–8, and the results are listed in Table 2. It is understood that the inclusions are not pure Al2O3, AlN, or Cr2O3 but contain alloying elements such as Fe and Co.
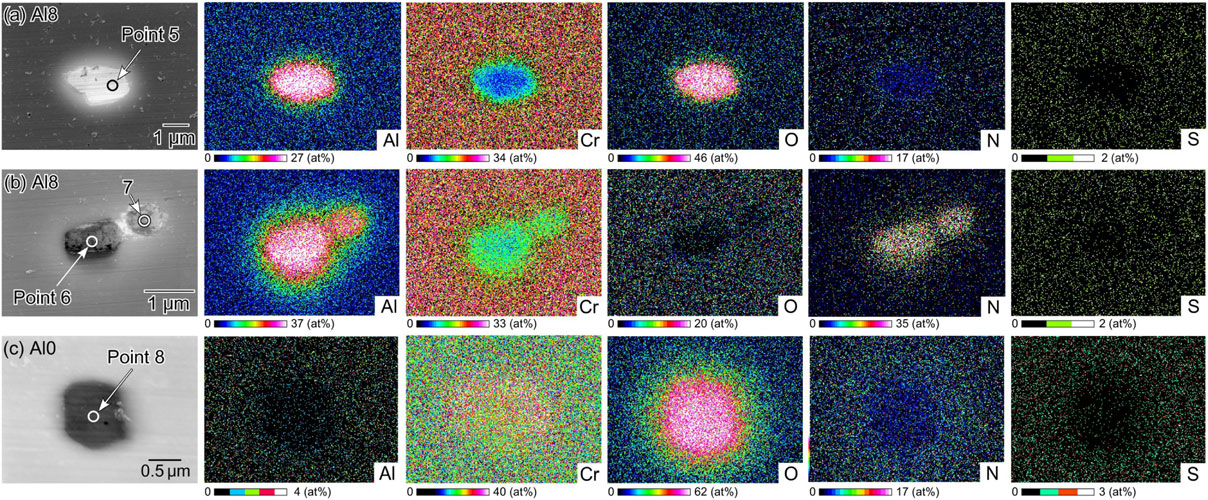
Figure 6(a) and 6(b) show the AES depth profiles of the as-polished surfaces of the Al8 and Al0 alloys, respectively. The vertical dotted lines indicate the thickness of the air-formed surface film, which was calculated by measuring the full width at half-maximum of the oxygen profile. The surface film of the Al8 alloy was slightly thicker than that of the Al0 alloy. Figure 6(c) shows the cation fractions on the film surfaces. In both alloys, the concentrations of Co, Cr, and Ni were almost the same; however, the concentrations of Al and Fe were quite different. On the surface film of the Al8 alloy, the Al concentration was approximately 11 at%, and correspondingly, the concentration of Fe was lower than that in the film on the Al0 alloy.
3.2 Pitting corrosion resistance
Figure 7(a) shows the potentiodynamic polarization curves of the Al8 and Al0 alloys in 0.1 M NaCl, and Fig. 7(b) shows an OM image of the Al0 alloy after polarization. No pits are observed in the image. Therefore, the increase in the current density above 1 V was attributed to oxygen evolution. In contrast, for the Al8 alloy, a sharp increase in the current density was generated at 0.71 V, and pits were observed after polarization, as shown in Fig. 7(c). It was concluded that the addition of Al lowered the pitting corrosion resistance of the CoCrFeNi alloy. Garip et al.30) and Shi et al.33) reported that the pitting corrosion resistance of AlCoCrFeNi-based high-entropy alloys decreases with increasing Al content. The results shown in Fig. 7 are consistent with these findings. As shown in Fig. 6, the concentrations of Co, Cr, and Ni in the surface films of both alloys were almost the same; however, the Al and Fe concentrations were quite different. The pitting corrosion resistance of the surface oxide film does not appear to improve with increasing Fe concentration.41) The pitting corrosion resistance of HEAs probably increases with increasing Cr/Fe ratios in passive films.42,43) Therefore, the presence of Al in the surface oxide film was considered to be a factor that decreased the pitting corrosion resistance of the Al8 alloy.

In addition to the Al-containing surface oxide film (air-formed film), nonmetallic inclusions generally affect pitting corrosion initiation. Figure 7(d) and 7(e) show an SEM image and corresponding EDS maps of a metastable pit. The results of the EDS point analysis at Points 9 and 10 are listed in Table 2. As shown in Fig. 7(d) and 7(e), metastable pits were observed in the Al nitride inclusions. It is known that pure AlN is an insulator owing to its large band gap and has been studied as a protective coating against corrosion.44–46) However, as presented in Fig. 5 and Table 2, the Al nitride inclusions in the Al8 alloy were determined to contain a relatively large amount of Fe and other transition metals (Cr, Co, and Ni); hence, these elements may increase the electrical conductivity by doping.47,48) Therefore, it is speculated that current flow paths exist in the Al nitride inclusions, and the lower corrosion-resistant parts dissolve under anodic polarization and become initiation sites for pitting corrosion.
To clearly understand whether the inclusions acted as initiation sites for pitting corrosion, the electrode surfaces before and after pitting corrosion were compared. The results are presented in Fig. 8. The entire surface of the working electrode should be observed before polarization; thus, a small area of 500 µm square was used. Moreover, 1 M NaCl was used as the electrolyte to ensure pit generation. Figure 8(c) is an OM image of the stable pit, and Fig. 8(b) is the corresponding OM image before polarization. It can be seen that the pit was initiated at the inclusion indicated by the arrow. After polarization, the SEM was performed, and it revealed the presence of the apparent residual of the inclusion (Fig. 8(c)). EDS point analysis was performed at Points 11 and 12, and the results are listed in Table 2. Comparing the relative concentrations at these two points, slightly more O and N were detected in the residual soil (Point 11) than outside the pit (Point 12). There is no contradiction between this result and the view that the pit was initiated at the Al nitride inclusion.

Figure 9 shows the surface appearances of the Al8 and Al0 alloys after high-temperature oxidation. As seen in Fig. 9(a), the surface color of the Al0 alloy oxidized for 0.5 h is gray, but the scale is broken and a part of it peels off when the alloy is oxidized for 20 h (see Fig. 9(b)). In the case of Al8 alloy (see Fig. 9(c)), the surface of the specimen oxidized for 0.5 h is dark red gray in color, which is regarded as interference color. Even after 20 h of oxidation, neither breakage nor peeling is observed on the surface of the Al8 alloy (Fig. 9(d)). The mass changes in these two alloys due to oxidation are listed in Table 3. The mass gain of Al0 alloy oxidized for 0.5 and 20 h is 1.09 and 0.91 mg cm−2, respectively. Because of the peeling-off of the scale on the specimen, the mass gain after 20 h of oxidation was small compared with 0.5 h after oxidation. The mass gain of Al8 alloy oxidized for 0.5 and 20 h is −0.15 and 0.58 mg cm−2, respectively. The mass-loss of Al8 alloy oxidized for 0.5 h was within the range of measurement error, indicating that the Al8 alloy was barely oxidized in the early stage of high-temperature oxidation.


Table 3 High-temperature oxidation data of Al0 and Al8 alloys.
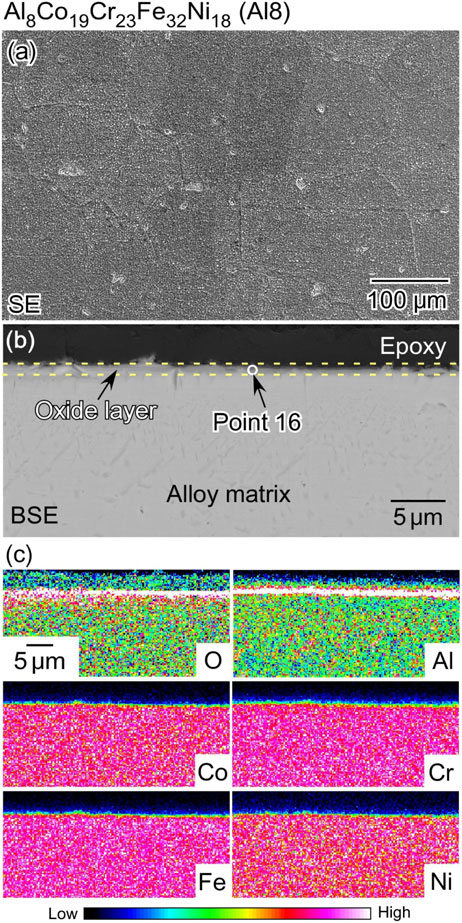
Figure 10 shows a top-surface SEM image, cross-sectional BSE image, and corresponding EDS maps of the scale on the Al0 alloy after 0.5 h oxidation. Table 4 lists the relative concentrations of Al, Co, Cr, Fe, Ni, O, and N at Points 13–15. In Fig. 10(a), many dark spots can be observed on the top surface of the scale, and the generation of nodules is shown in Fig. 10(b), indicating that the dark spots on the top surface were nodules. Based on the EDS maps, the scale can be divided into outer and inner layers; the outer layer is rich in Fe and the inner layer is rich in Cr. Under the Cr-enriched inner layer, Ni was enriched. Focusing on the comparison of the Cr concentration in the inner layer and the oxidation morphology, it can be seen that the Cr enrichment is lower in the inner layer of the nodule area than in the smooth area. In general, nodules are generated when the protective ability of the oxide scale is insufficient and the outer diffusion of metal ions is locally accelerated. As shown in Fig. 10(b), there are voids in the nodule, and it is considered that oxidation occurred at a relatively fast rate. Because a large portion of the scale peeled off after 20 h, and the Cr concentration in the inner layer of the nodule area was relatively low, the Cr content (23 at%) of the medium-entropy alloy (Co19Cr23Fe40Ni18) was insufficient to ensure oxidation resistance at 1273 K.


Figure 11 shows a top-surface SEM image, cross-sectional BSE image, and corresponding EDS maps of the scale on the Al8 alloy after 0.5 h oxidation. Table 4 lists the relative concentrations of Al, Co, Cr, Fe, Ni, O, and N at Point 16. As shown in Fig. 11(a), the top surface of the Al8 alloy scale after high-temperature oxidation was smoother than that of the Al0 alloy, and no nodules were observed. As shown in Fig. 11(b) and 11(c), there is an oxide scale with a thickness of approximately 0.5 µm on the surface. The extremely thin film, compared to Al0, is likely to be an effect of Al. The EDS point analysis at Point 16 indicated that the oxide scale was mainly composed of Al oxide. Compared to the Al0 alloy shown in Fig. 11, the morphology of the oxide scale of the Al8 alloy was significantly different from that of the Al0 alloy. The formation of the Al-enriched oxide scale inhibited high-temperature oxidation.
3.4 Improvement of pitting corrosion resistance by electrochemical treatment
In this study, the as-polished Al8 alloy exhibited good high-temperature oxidation but poor pitting corrosion resistance. To achieve resistance against high-temperature oxidation and pitting corrosion in the Al8 alloy, electrochemical treatment was performed by potentiodynamic polarization in deaerated 1 M H2SO4 at 298 K. In our previous study,36) the potentiodynamic polarization of the Co20Cr20Fe20Mn20Ni20 alloy in H2SO4 from the cathodic region to the passive region of 0.5 V improves the pitting corrosion resistance. Moreover, Lee et al.49) performed electrochemical impedance spectroscopy (EIS) measurements on an Al0.3CrFe1.5MnNi0.5 alloy, and anodic treatment in H2SO4 increased the corrosion resistance in the EIS measurements by two orders of magnitude. Therefore, in this study, potentiodynamic polarization was performed on Al8 alloy in 1 M H2SO4. Figure 12(a) shows the potentiodynamic polarization curves of the Al8 and Al0 alloys. Active dissolution and passivation are observed. It can also be seen that a relatively lower passive current density is obtained at 0.5 V. In this paper, the specimens potentiodynamically polarized from −0.5 to 0.5 V in 1 M H2SO4 were referred to as potentiodynamic H2SO4-treated specimens.
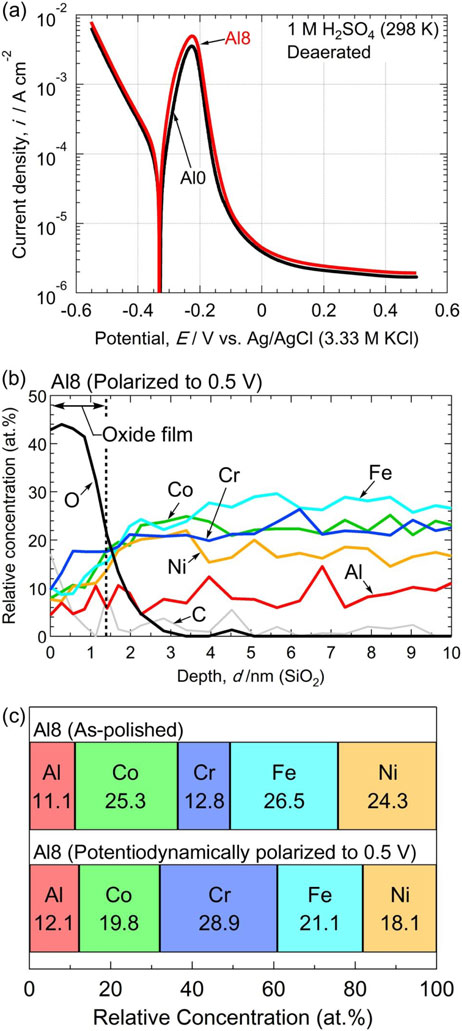
Figure 12(b) shows the AES depth profile of the surface of the potentiodynamic H2SO4-treated Al8 alloy. The film thickness of the surface film was slightly thinner than that of the as-polished Al8 alloy (see Fig. 6(a)). However, as shown in Fig. 12(c), significant accumulation of Cr was observed in the potentiodynamic H2SO4-treated Al8 alloy. Interestingly, the concentration of Al did not decrease compared with that in the as-polished condition, but the concentrations of Fe, Co, and Ni did. Once the alloy surface is dissolved and passivated (oxidized) in an acidic solution, it is possible to enrich oxides with excellent corrosion resistance on the surface of the alloys.
Anodic polarization in 1 M H2SO4 is expected to affect not only the surface oxide film but also the inclusions present on the specimen surface. Figure 13(a) shows an OM image of the surface of the potentiodynamic H2SO4-treated Al8 alloy. Grain boundaries became visible, and a faint brownish discoloration was observed on some grains. The small black dots are probably inclusions. Figure 13(b) shows an SEM image of the inclusion. As shown in the image, some parts of the inclusions are dissolved. The EDS point analysis at Point 17 (see Table 5) implies that this inclusion is Al nitride, and the morphology suggests that the less corrosion-resistant parts dissolved during anodic polarization.


The pitting corrosion resistance of the potentiodynamic H2SO4-treated Al8 alloy was compared with that of the as-polished specimen, as shown in Fig. 7(a). Additional specimens were prepared to distinguish the effects of changes in the surface film composition and partial dissolution of the inclusions. The specimens of the Al8 alloy were polarized to 0.5 V, and then the surfaces were gently polished by a 1 µm diamond paste for approximately 10 s (post-polishing) to remove the passive film formed in 1 M H2SO4. Figure 14 shows the potentiodynamic polarization curves of the Al8 alloy in 0.1 M NaCl. As seen in this figure, the pitting potential increased to approximately 1.1 V by the potentiodynamic H2SO4-treatment without post-polishing. Although post-polishing lowered the pitting potential, it was higher than that of the as-polished specimen. This result was obtained at least twice to confirm the reproducibility. Based on a comparison of the pitting potentials shown in Fig. 14, it was concluded that partial dissolution of the Al nitride inclusions contributed to an increase in the pitting potential of approximately 0.1 V, and passivation provides a further increase in the pitting potential by 0.3 V. Conventional Al-free austenitic stainless steels such as Fe–18Cr–8Ni have significantly higher pitting corrosion potentials when inclusions are removed or measured in a small area without inclusions,50–54) but in high Al alloys, the removal of the soluble inclusions alone is not sufficient, and Cr-enrichment in the surface oxide film is determined to be crucial for improving pitting corrosion resistance.

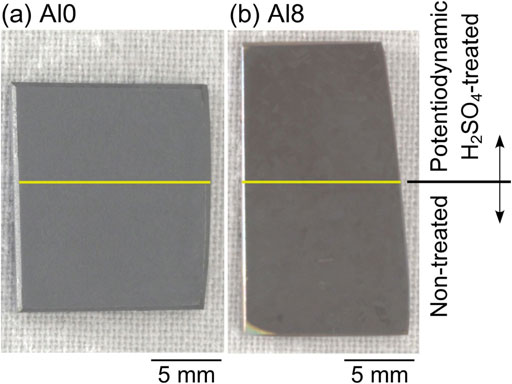
To verify whether the electrochemical treatment reduced the high temperature oxidation resistance, the high temperature oxidation was performed after the electrochemical treatment. Figure 15 shows the surface appearances of the Al0 and Al8 alloys after high-temperature oxidation at 1273 K for 0.5 h. Before high-temperature oxidation, half of the specimen was potentiodynamically treated in 1 M H2SO4. Half of the specimens were covered with acid-resistant tape and potentiodynamic polarization was performed. The tape was stripped and the specimen was degreased before high-temperature oxidation. In Fig. 15, the specimen surface above the yellow line is potentiodynamically H2SO4-treated, and the specimen below the yellow line is untreated. The results showed no apparent difference between the treated and untreated surfaces of both alloys. The potentiodynamic H2SO4-treatment did not significantly reduce high-temperature oxidation resistance.