The Potential of Agricultural Waste Biochar in Enhancing Soil Quality, Forage Productivity and Mitigating Greenhouse Gases Emission
2023 年 11 巻 p. 271-290
詳細
2023 年 11 巻 p. 271-290
The increased animal production in recent decades has increased manure production, which has become a significant source of agricultural waste. Although the abundant nutrient content in manure has the potential to be used as an alternative fertilizer, its natural decomposition process will be harmful to the environment. Composting and using manure as organic fertilizer have an adverse effect on the environment, as manure emits CO2, CH4, and N2O, which are harmful to the environment. Converting this animal waste into biochar through pyrolysis might be a better way to apply it to the soil. We reviewed papers to determine the potential of agricultural waste biochar, focusing on animal waste biochar, to combat soil quality degradation and mitigate greenhouse gas (GHG) emissions. Due to the scarcity of animal waste biochar information, some discussions are based on other agricultural waste types, mainly rice hull and corncob biochar. Applying biochar has been proven to be a suitable method for improving soil quality, forage productivity and reducing GHG emissions. More detailed research is needed to evaluate the potential of animal waste biochar in this regard.
Agricultural wastes are residues from the growing and processing raw agricultural products such as fruits, vegetables, crops, meat, poultry and dairy products [1]. These wastes may contain materials that can benefit humans; however, these economic values are less than the cost of collecting, transporting and processing them. The agricultural waste composition will depend on the system and type of agricultural activities, and these wastes can be liquids, slurries, or solids. Expanding agricultural production has naturally increased livestock waste, agricultural crop residues and agro-industrial by-products. Annual agricultural waste production is estimated at approximately 998 million tons, and manure might contribute about 5.27 kg day-1 per 1000 kg of live weight on a wet weight basis [2].
Among these agricultural wastes, manure amounts have increased as the number of animals has increased [3]. Growing numbers of animals create pressure on land for grazing or forage cultivation locations. Intensive grazing and forage growth may deplete soil quality. Although animal wastes may be used as a nutrient source for plants, their decomposition releases several kinds of greenhouse gases (GHGs) that are harmful to the environment [13]. A possible solution for this problem is pyrolyzing animal wastes to create green fertilizer or a soil amendment called biochar. This can improve soil quality by increasing soil organic matter (SOM), porosity, cation exchange capacity (CEC) and low bulk density. Since biochar is characterized by recalcitrant decomposition and has a higher surface area, applying this material can mitigate GHG emissions and nutrient leaching from the rhizosphere [36, 59, 87]. Animal waste biochar may have several advantages because it will give the crop nutrients. The pyrolization process could increase the surface area, which is essential in adsorption performance compared with agricultural waste biochar. Converting animal wastes into biochar will also bring some advantageous values, such as reducing the volume of manure to one-fourth, providing recalcitrant organic matter, which can enhance fertilizer use efficiency, sustainably improving land quality and protecting the environment by reducing greenhouse gas emissions from livestock and agricultural sectors.
In this review paper, we 1) introduce the environmental problem of animal waste, focusing on GHG emissions and land degradation, and 2) briefly summarize biochar and its characteristics. Furthermore, we 3) describe the biochar’s role in improving forage production and soil quality and 4) highlight its role in mitigating GHG emissions. Due to the scarcity of literature discussing animal waste biochar, some information is based on other agricultural waste biochar, such as rice husk and corncob. Finally, we discuss the potential of animal waste biochar to enhance soil quality and forage production and mitigate GHG emissions.
Fulfilling the increasing demand for food, including livestock products such as meat, milk and eggs, mainly in developing countries, amplifies the pressure on land resources, which decreases land quality in those areas [4, 5, 6]. Intensive animal production induces a considerable accumulation of animal waste, which has caused severe pollution problems. For centuries, the increased numbers of animals have been one factor that raised intensive production systems. These systems produced more manure than can be used as fertilizer, resulting in soil accumulation and running off some pollutants [7]. European countries strictly regulate the amount of manure input and development of the project (MANEV) to unify the main technology for manure management [8]. This project puts all the knowledge for managing animal manure to minimize the environmental impact in Europe. On the other hand, the Biomass Nippon Strategy was implemented to promote the use of biomass energy and bio-based products as part of Japan’s efforts to deal with environmental pollution [9].
The direct application of animal waste as organic fertilizer induces several environmental problems. Due to its high nutrient content, especially nitrogen and phosphorous (Table 1), manure has been recognized as a source of soil nutrients, contributing up to ∼ 37–61% of the total nitrogen input to the land surface [10]. Animal waste is nonpoint source pollution, transported primarily by runoff, and has been blamed for the deterioration of surface and groundwater resources worldwide [11, 12]. Although land application has been recognized as the best method of utilizing animal manure [3], improper application, including excess administration to the site’s demand, can deteriorate ground and surface water quality.
On the other hand, the decomposition of animal waste on farmland emits a substantial amount of harmful environmental gases, including GHGs (N2O, CO2 and CH4), which are generated via both nitrification and denitrification processes as intermediate products or byproducts of animal waste decomposition [13]. Manure production and management are the largest source of N2O emissions (2.8 Tg N2O–N yr−1), accounting for 44% of the global total N2O emissions [14]. More than 13% of global anthropogenic GHGs have been estimated to be emitted from the decomposition of animal waste on agricultural soils, including 60% of CH4 and N2O, which are associated with direct soil-derived GHGs and agricultural inputs [15].
The storage system, management system, temperature and livestock influence the type and amount of GHGs released from manure. GHG emissions tend to increase with increasing temperature, and of the GHGs, methane is emitted in the highest amount from livestock manure [17]. Various efforts have been introduced to minimize the adverse effect of livestock manure on GHG emissions, such as composing the animal diet, manipulating storage temperature [18], composting [19] and covering solid waste during storage [20].
Table 1: The manure produced, nitrogen and phosphorus excreted per animal unit by livestock and poultry in the United States and Japan ([3], [120], [121])
| Livestock type | Number of animals | Manure produced | Nitrogen produced | Phosphorus produced |
|---|---|---|---|---|
| United States | AU | kg d-1 AU-1 | ||
| Beef cattle | 1.0 | 26.8 | 0.13 | 0.04 |
| Dairy cattle | 0.7 | 36.2 | 0.20 | 0.03 |
| Swine | 2.5 | 28.6 | 0.19 | 0.07 |
| Chicken (layer) | 82.0 | 27.4 | 0.37 | 0.14 |
| Chicken (broiler) | 125.0 | 36.2 | 0.49 | 0.15 |
| Japan* | AU | kg d-1 AU-1 | ||
| Beef Cattle | 1.0 | 19.4** | 0.16 | 0.02 |
| Dairy Cattle | 0.7 | 30.3** | 0.13 | 0.02 |
| Swine | 2.5 | 15.7** | 0.15 | 0.02 |
| Chicken (layer) | 82.0 | 9.02** | 0.23 | 0.02 |
| Chicken (broiler) | 125.0 | 16.3** | - | - |
AU: animal unit
-: no data available
*: due to different units in literature sources, this data shows some distinctions from the US data
**: estimated from [120] and “Livestock Farming Statistics,” MAFF of Japan (https://www.maff.go.jp/j/tokei/kouhyou/tikusan/index.html#l).
There are several kinds of manure management; one of the most common is composting. This process degraded fresh manure by microorganisms, which can be run through passive (leaving manure undisturbed) or active (turning and aerating manure mechanically) processes. Composting manure under aerobic conditions may reduce CH4 emission but increase N2O and NH3 [21, 22]. The emission rate of N2O and NH3 during active composting can be lowered by covering manure with a straw or plastic sheet [22]. However, according to Chadwick [20], this process also allows an increase of 11% in total GHG emissions. Thorman et al. [23] also reported a decrease and an increase in N2O emissions after covering solid poultry manure with a plastic sheet. On the other hand, NH3 emissions may also be reduced by covering manure [20]. Several treatment technologies, such as manure separation [24], anaerobic digestion [25], aeration [26, 27] and chemical additive application [22], using nitrite-oxidizing bacteria and struvite crystallization [13], can mitigate GHG emissions from livestock manure.
In developing countries, most farmers have less than two hectares of land with limited resources and need help getting financial support. Due to this condition, managing soil quality and sustainable ecosystem services of the land becomes a hard thing to achieve by farmers [28]. Some studies reported that the average ecosystem service degradation in tropical and subtropic regions between 1950 and 2010 was about 60% [29], or about 500 million hectares [30]. Degradation of soil quality will deteriorate plant production, which will affect farmer’s economic condition and might result in environmental consequences [32, 33].
There are four types of soil degradation: (i) physical, (ii) chemical, (iii) biological and (iv) ecological [31]. Degradation of soil physical properties is indicated by damaging soil structure, which imposes soil compaction indicated by increases in soil bulk density. This condition will influence soil water permeability and enhance surface runoff. Decreasing of soil chemical properties indicated by acidification, reduction of nutrient availability, cation exchange capacity (CEC), cation base saturation (Ca, Mg, K and Na), and increase in aluminum (Al) and iron (Fe) saturation in soil. Meanwhile, the degradation of soil biological properties is indicated by depletion of the soil organic carbon pool (SOC), loss of soil biodiversity, reduced soil C absorption capacity and increased GHG emissions from the soil into the atmosphere. One of the most severe consequences is when the soil produces more GHG emissions (i.e., CO2 and CH4) than it tries to store. Ecologically, soil degradation, as reflected in the combination of the other three types of degradation (physical, chemical and biological), disrupts ecosystem functions such as elemental cycles, water penetration and clarification, as well as causing disturbances in the hydrological cycle and biome productivity [31]. A timely and ambitious effort is needed to address such soil degradation and the deterioration effect of animal waste on the environment and decelerate climate change through global warming [34]. Since most animal waste management involves some additional facilities, is time-consuming and can be difficult to adopt at the farmers’ level in developing countries, pyrolization (making “biochar") could be a simple way to process these materials to form green fertilizer or a soil amendment.

Figure 1: Biochar standard set, including feedstock (Adopted from Mašek et al. [111] with kind permission from Springer Nature)
Biochar is defined as “a solid material obtained from the thermochemical conversion of biomass in an oxygen-limited environment” [35]. Generally, biochar is made from feedstock that is converted under well-controlled. However, there was insufficient information on the production and characteristics. In 2015, the UK Biochar Research Centre at Edinburgh University released a set of standard biochar to address the insufficient information on biochar characteristics (Figure 1). Good-quality biochar has a high percentage of porosity and nutrient content and an extensive microstructure to make the water storage capacity more efficient [36]. Pyrolysis produces biochar, which involves the thermochemical conversion of dry biomass at high temperatures (300–650 °C) without oxygen.
Pyrolysis is derived from the Greek word ‘pyro’, meaning fire, and ‘lysis’ meaning decomposition or breaking down into constituent parts, which means an organic substance is chemically decomposed by heating without oxygen. Biochar can be produced at various socioeconomic scales, from extensive industrial facilities to individual domestic farms [34]. The other advantage of using biochar is its residence time in soil. Some experiments reported that this material might persist in soils for more than a century, which is about 10–1,000 times longer than the residence of most soil organic matter (SOM) [37].
Biochar production and its characteristics are influenced by the raw material and the pyrolization process, especially temperature. Generally, increasing the pyrolization temperature results in a lower amount of biochar (Table 2). At the initial stage of the heating process (200 °C), some materials decrease in weight by approximately 20%. This might be due to incomplete water loss from those materials when the pyrolization temperature increases to 350 °C, and the corncob, manure and rice hull weights decrease by 34.17%, 46.26% and 41.92% respectively [38]. At 500 °C, the weights of biochar from corncob, manure and rice hull decrease by 24.52%, 36.70%, and 33.34%, respectively [38].
The temperature difference in the pyrolization process also creates dissimilarity in the surface area of biochar (Figure 2 and Table 2). The raw materials of biochar produced at lower temperatures (200 °C) have a similar surface area [38]. The discrepancies in surface area from each material start to appear at 350 °C, and when the heating temperature reaches 500 °C, all materials show significant differences. Of the biochar types, manure biochar has the lowest surface area, followed by corncobs.
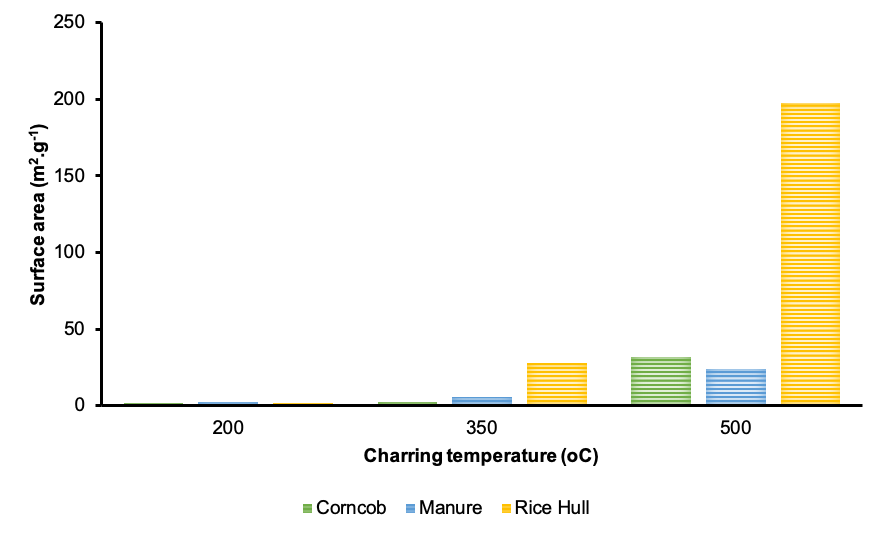
Figure 2: The effect of different temperatures on the surface area of biochar (Adopted from Stoyle, [38])
In contrast, rice hulls had the highest surface area at 198 m2 g-1 (Figure 2). The dissimilarities in these biochar surface areas could be affected by the original character of each raw material. In addition, the significant variation in these biochar surface areas might be altered by the main chemical component of the initial raw material. Rice husk, mainly cellulose, lignin and silica, has a C/N ratio of approximately 80 [39]; corncob has a C/N ratio of 40 [40]; and manure has a C/N ratio of 21 [41]. These C/N ratio values indicate the resistance level of the material in the heating process, where materials with a high C/N ratio are more challenging to break down compared to materials with a lower C/N ratio.
The surface area determines biochar’s absorption performance, which can change according to temperature. The higher temperature in the charring process resulted from biochar with a larger surface area and porosity. The research conducted by Palansooriya et al. [111] proved that biochar’s structure and pore space are also affected by the type of raw materials (Figure 3). The mesquite wood chip biochar produced with a pyrolysis temperature of 850 °C has the biggest pore space compared to biochar from mixing 40% food waste and 60% wood at the same temperature. However, the cow manure biochar has more micropores, which may increase its surface area.

Figure 3: Morphological structure of different kinds of biochar at different temperatures (a) the mesquite wood chip biochar produced at 850 °C; (b) 40% food waste and 60% wood biochar produced at 850 °C; (c) wood chip biochar produced at 850 °C; (d) dairy manure biochar produced at 600 °C (Adopted from Palansooriya et al., [112])
The main characteristic of biochar is carbon content, surface area and pH value determined by the temperature of the charring process and the raw materials (Table 2). The carbon content of biochar derived from pig and poultry manure increased linearly with the charring temperature, but it is opposed to dairy manure. A similar result was also found for biochar-specific surfaces. The charring temperature influences the dairy manure biochar-specific surface: the higher the temperature, the larger the biochar surface area. This condition has not occurred with poultry manure biochar. In the case of pH value, all materials studied in that table show a similar trend [42, 43, 44].
On the other hand, biochar from agricultural wastes has a different carbon content trend than animal waste biochar. Increasing the charring temperature of rice straw resulted in biochar with lower carbon content but increased its specific surface area. Both animals and agriculture wastes biochar agree with the effect of charring temperature on their pH values, where temperature increases applied created biochar with higher pH values [44].
Soil organic matter (SOM) is essential in maintaining soil quality and ecosystem functionality [45], whether in traditional or modern systems. SOM sustains crop production, prevents land degradation [47] and is essential to agricultural soil quality and ecology [46]. Besides, SOM supports the role of soil organic carbon (SOC) in improving soil’s physical, chemical and biological properties [48, 49]. Furthermore, Šimanský et al. [50] reported that applying 20 Mg ha-1 of paper fiber sludge and grain husk biochar increased SOC from 12.2 to 18.9 g kg-1. Although SOC might be increased by adding various kinds of organic matter sources, such as compost, feedstock, manure and other decomposable organic matter, biochar has some advantages and value compared to other sources. First, biochar has a high organic carbon content compared to the different types of organic matter (Figure 4). Second, biochar is much more recalcitrant in soil than other forms of organic matter. Conant et al. [51] reported that 10-15% of organic matter would be decomposed within a year, while the decomposition rate depends on local temperature. On the other hand, biochar can persist in soil over a century as it is recalcitrant to decomposition [52].

Table 2: Physical and chemical properties of biochar from different feedstock pyrolyzed at several temperature conditions
| Feedstock | Yield (%) | Content of elements (%) | Temperature (℃) | Surface area (m2 g-1) | pH | Ash (%) | CEC (cmol kg-1) | References | |||||
|---|---|---|---|---|---|---|---|---|---|---|---|---|---|
| C | H | O | N | P | K | ||||||||
| Livestock | |||||||||||||
| Pig manure | 63.0 | 68.4 | 5.9 | 19.7 | 6.1 | ⎻ | ⎻ | 300 | ⎻ | ⎻ | 46.3 | ⎻ | [115] |
| 50.6 | 71.1 | 4.2 | 19.1 | 5.6 | ⎻ | ⎻ | 400 | ⎻ | ⎻ | 57.8 | ⎻ | ||
| 46.7 | 71.4 | 3.9 | 19.0 | 5.7 | ⎻ | ⎻ | 500 | ⎻ | ⎻ | 62.2 | ⎻ | ||
| 44.3 | 73.9 | 3.0 | 17.8 | 5.3 | ⎻ | ⎻ | 600 | ⎻ | ⎻ | 65.8 | ⎻ | ||
| 42.8 | 75.8 | 2.6 | 17.5 | 4.0 | ⎻ | ⎻ | 700 | ⎻ | ⎻ | 67.6 | ⎻ | ||
| Dairy manure | 77.6 | ⎻ | ⎻ | ⎻ | ⎻ | ⎻ | ⎻ | 200 | 2.1 | ⎻ | ⎻ | ⎻ | [39] |
| ⎻ | 39.3 | 3.8 | ⎻ | 2.7 | ⎻ | ⎻ | 300 | 14.3 | 7.5 | 50.3 | ⎻ | [116] | |
| 44.3 | ⎻ | ⎻ | ⎻ | ⎻ | ⎻ | ⎻ | 350 | 5.8 | ⎻ | ⎻ | ⎻ | [39] | |
| 36.7 | 19.0 | 1.1 | ⎻ | 1.2 | ⎻ | ⎻ | 500 | 44.1 | 9.3 | 63.7 | ⎻ | [39], [116] | |
| ⎻ | 27.9 | 1.0 | ⎻ | 1.1 | ⎻ | ⎻ | 700 | 83.4 | 9.7 | 68.7 | ⎻ | ||
| Poultry manure | 65.7 | 52.9 | 3.9 | 34.7 | 7.8 | ⎻ | ⎻ | 300 | 4.3 | 8.8 | 24.0 | ⎻ | [117] |
| 54.0 | 51.0 | 3.2 | 39.4 | 5.4 | ⎻ | ⎻ | 400 | 11.6 | 10.6 | 28.0 | ⎻ | ||
| 72.0 | 51.6 | 1.9 | 40.3 | 5.5 | ⎻ | ⎻ | 500 | 5.8 | 11.0 | 24.0 | ⎻ | ||
| 47.0 | 52.3 | 1.4 | 40.3 | 4.2 | ⎻ | ⎻ | 600 | 3.7 | 11.5 | 22.6 | ⎻ | ||
| 47.0 | 56.1 | 1.5 | 37.2 | 4.2 | ⎻ | ⎻ | 700 | 6.6 | 10.7 | 24.2 | ⎻ | ||
| Cow dung | ⎻ | 67.0 | ⎻ | ⎻ | 0.7 | 1.8 | 2.3 | 450 | ⎻ | 7.0 | ⎻ | ⎻ | [107] |
| Poultry litter | 36.7 | 51.1 | 3.8 | 10.3⎻15.6 | 2.1 | 20.8 | 48.5 | 350 | 3.9 | 8.7 | 30.7 | ⎻ | [118] |
| 54.3 | 45.9 | 2.0 | ⎻ | 4.4 | 1.2 | 74.0 | 700 | 50.9 | 10.3 | 46.2 | ⎻ | ||
| Agricultural waste | |||||||||||||
| Rice | 46.0 | 60.0 | ⎻ | ⎻ | 1.0 | 1.5 | ⎻ | 400 | ⎻ | 8.6 | ⎻ | 97.3 | [113] |
| Rice straw | 39.3 | 49.9 | 2.8 | 12.0 | 1.2 | ⎻ | ⎻ | 400 | 46.6 | 8.6 | ⎻ | ⎻ | [119] |
| 32.6 | 37.5 | 0.9 | 8.6 | 0.6 | ⎻ | ⎻ | 500 | 59.9 | 9.8 | ⎻ | ⎻ | ||
| 23.4 | 33.8 | 0.6 | 13.7 | 0.4 | ⎻ | ⎻ | 600 | 129.0 | 10.2 | ⎻ | ⎻ | ||
| 18.4 | 36.3 | 0.5 | 17.4 | 0.3 | ⎻ | ⎻ | 700 | 149.0 | 10.4 | ⎻ | ⎻ | ||
| 18.3 | 29.2 | 0.3 | 3.7 | 0.3 | ⎻ | ⎻ | 800 | 257.0 | 10.5 | ⎻ | ⎻ | ||
| Rice stalk | ⎻ | 44.7 | 2.1 | 51.8 | 1.0 | 0.2 | 2.8 | 450 | 22.9 | 9.1 | 343.0 | 54.8 | [114] |
| Rice hulls | 81.23 | ⎻ | ⎻ | ⎻ | ⎻ | ⎻ | ⎻ | 200 | 2.1 | ⎻ | ⎻ | ⎻ | [37] |
| 41.92 | ⎻ | ⎻ | ⎻ | ⎻ | ⎻ | ⎻ | 350 | 5.8 | ⎻ | ⎻ | ⎻ | ||
| 33.34 | 41.52 | ⎻ | ⎻ | 0.6 | ⎻ | ⎻ | 500 | 24.0 | ⎻ | ⎻ | ⎻ | ||
| Corncob | 77.88 | ⎻ | ⎻ | ⎻ | ⎻ | ⎻ | ⎻ | 200 | 1.9 | ⎻ | ⎻ | ⎻ | [37] |
| 34.17 | ⎻ | ⎻ | ⎻ | ⎻ | ⎻ | ⎻ | 350 | 2.4 |
⎻ | ⎻ | ⎻ | ||
| 24.52 | 75.05 | ⎻ | ⎻ | 0.5 | ⎻ | ⎻ | 500 | 31.7 | ⎻ | ⎻ | ⎻ | ||
Yield: the yield of biochar after pyrolysis
CEC: cation exchange capacity
–: Data is not available
Bulk density is essential to determine soil quality. Soil with higher bulk density prevents optimal root growth and nutrient uptake, which decreases plant productivity. The application of biochar with low bulk density decreases soil bulk density. As the biochar dose increases, the bulk density will decrease gradually, even quadratically [52, 53, 55]. Rogovsk et al. [55] found that applying biochar above 60 Mg ha-1 of wood base material decreased the bulk density. This differs from Pratiwi and Shinogi [58], who found that applying rice husk biochar at around 50 Mg ha-1 did not affect bulk density value. Other studies found that biochar at <10 Mg ha-1 [55, 56] did not affect soil bulk density. These results indicate that the type and location of biochar application show a different effect on the soil.
Biochar application to reduce bulk density is influenced by the original soil character, especially soil texture. The effect of biochar application on soil bulk density was more evident in coarse-textured soils than in fine-textured soils. Liu et al. [54] reported that biochar reduced bulk density by 14.2% in coarse and 9.2% in fine-textured soils. Two main mechanisms could explain the reduction of soil bulk density with biochar application: the specific gravity of biochar and the administration time. First, biochar has a lower bulk density (<0.6 g cm-3) than soil (~1.25 g cm-3) [59]. The mixing or dilution effect when applying biochar reduces the soil bulk density. This effect can be considered when the density between materials is widened. The result of biochar addition on soil bulk density reduction may vary based on the soil’s physical properties, such as texture. Some studies found that the impact of biochar on the changes in soil physical properties was diverse and affected by the original soil characteristics. For instance, applying biochar on soil with high bulk density gave a better impact than the lower ones [60].
Second, decreasing soil bulk density might occur through improving soil aggregate formation and soil pore enhancement via biochar and soil particle interaction over the years. Since most of the studies on the effect of biochar applications on the changes in soil physical properties were conducted within a short period, it’s hard to clarify the impact of biochar over the long-term period. Overall, biochar application reduces bulk density, but soil type and biochar application rates influence the extent of these changes [60].
4.3 Decrease soil particle densityAlthough soil particle density is one of the soil’s physical characteristics, which influences many other soil features, it is less studied so far; it sounds more important for soil as the medium for civil engineering. Soil particle density is closely related to bulk density and soil porosity. Therefore, the application of biochar also changes the particle density of soil. Since the particle density of biochar ranges from 1.5 to 2.0 g cm-3, its application to soil with high particles (ranges from 2.4 to 2.8 g cm-3) will significantly lower soil particle density [60, 61].
Even though only a few studies have discussed the effect of biochar on soil particle density, research that has been conducted has shown a decrease in particle density. In a field study, higher doses of wood biochar on fallows reduced soil particle density by 14% but did not affect grassland [56]. In a laboratory study using clay sand, the particle density decreased by 64% with an increase in the volume percentage of the application of peanut husk biochar [62]. Likewise, the decrease in soil particle density with adding biochar is associated with a low density of biochar particles. In summary, several studies show that biochar application can reduce the density of soil particles.
4.4 Increasing soil porosityReducing specific gravity and soil particle weight due to biochar application can affect soil porosity. The percentage of soil density is in contrast to the porosity of the soil. Usually, the lower the density of the soil, the higher the porosity of the resulting soil. Omondi et al. [63] reported that applying biochar can increase soil porosity by 8.4%. Similar to bulk density, the effect of using biochar will be more visible on coarse-textured soils.
Increasing soil porosity can be done in several ways, one of which is by reducing soil density. Applying biochar to low porous soils can increase the percentage of pores because biochar has a pore content of around 70 to 90% [60]. Several studies reported that the increase in the porosity of biochar occurred due to the use of high temperatures in the manufacturing process. Andrenelli et al. [64] reported that soil porosity increased with the addition of pyrolyzed wheat bran biochar (Triticum aestivum) at temperatures higher than 800 °C.
The study conducted by Arvidsson [65] proved that applying biochar can increase soil porosity when the bulk and particle density decreases. Significant and positive effects of this biochar can occur if given biochar with a low particle density. In addition to the biochar quality, the research duration and the soil quality also affect the final results. Coarse and gravelly soils produce a more significant effect when applying biochar than clay. An increase will follow this increase in soil pores in the ability to store water and have positive implications for heat and gas in the soil.
4.5 Increasing soil CEC and mitigating nutrient leachingThe CEC estimates the soil’s ability to absorb, hold and exchange cations. The more cation exchange sites, the higher the CEC content in the soil. Soils with a high CEC absorb more cations to store more nutrients. The soil will use these stored cations as nutrients and reduce nutrient losses [64]. Increasing soil CEC by biochar application due to aromatic carbon, which is acidic on the surface of biochar. This aromatic carbon is oxidized to form large functional groups, which increase the cation adsorption capacity of the soil so that the CEC rises [66, 67, 68].
According to Lehmann [70], biochar CEC may reach 40 cmolc g-1 making it the most excellent material that may hold positive nutrient ions and prevent them from moving from the root zone to the deeper soil layer or leaching into the water body. Therefore, applying biochar enhances the CEC of soil and results in augmented plant growth and productivity. Biochar application with normal nitrogen fertilizer in rice fields increased rice biomass by almost twice that of the control. At the same time, a similar condition was also found for the rice grain [59].
The use of compost on soil treated with biochar significantly increases soil CEC. The process of increasing CEC occurs when the retention of non-acidic cations by the soil increases. The CEC proved to be an essential parameter in binding inorganic nutrients such as K+ and NH4+ in the soil [71] and biochar has been shown to increase their percentage [72]. Biochar application also creates soil quality improvement. In the pot experiment conducted by Wang et al. [59], the NO3--N and NH4+-N of soil after harvest increased by biochar application, where the increasing pattern was positively correlated with the dose of biochar (Figure 5 a and b). The effect of rice hull biochar application on available nitrogen content in soils was more evident in upland crops compared with paddy soils. The considerable difference between available nitrogen (NO3--N and NH4+-N) (Figure 5 c) in upland and paddy soils could be due to the different sources of soil in this experiment.
Biochar as a soil amendment has been a research subject in the last two decades [72, 73]. Some of the physical properties of the soil, such as increasing in soil infiltration, water holding capacity, aeration and redox potential, are modified by adding biochar, resulting in advantages on soil productivity, which finally improve plant growth and yield [66, 74, 75, 76, 77, 78]. Biochar’s ability to retain nutrients and increase water-holding capacity can help to increase crop yields. On the other hand, increasing soil water holding capacity by biochar addition is potent to reduce the amount and frequency of water addition through irrigation. This is because soil amendments with biochar store more water when applied so that the irrigation frequency will be reduced and can optimize the limited availability of water [80]. Some meta-analysis calculated a 9% to 17% increase in yield [80, 81, 82, 83] when nutrient-rich biochar is added to acidic soils [81, 84]. Even low-nutrient biochar positively affects plant productivity in volcanic soils, related to changes in soil biological communities [86].
Applying biochar to the soil under cropping systems provides nutrients [36, 87] and improved soil properties and conditions, such as water-holding capacity [88, 89], CEC [75] and pH [90]. The benefits of biochar can be classified into two categories: those provided by the ash fraction, such as direct provision of nutrients, and limiting potential, which have short-lived effects. While those imparted by the biochar structure, such as water-holding capacity and CEC, have long-lasting effects [91]. However, those effectiveness depends on the soil, climatic conditions and field management practices [80]. For example, the yield from eucalyptus wood residue biochar (EWBC) application has a low production compared to manure-derived biochar and NPK application with two harvests time [96]. However, studies using pig manure (PMBC) and poultry (PLCM) as biochar biomass demonstrated potential as a source of available P with high agronomic performance [87, 88]. An increase in available P sources will correlate with an increase in pH. When the pH increases, most of the P fixation with Fe or Al will be released into the soil solution [89, 90, 95]. Ginebra et al. [96] reported that a mixture of PMBC and PLCM significantly increased the soil pH to around 6.5.
When associated with different fertilizers, crop choices and climatic characteristics influence the response to biochar application [97], Scotti et al. [98] investigated the effect of two biochar types, from the gasification or pyrolysis process, with mineral and organic fertilization treatments on silage maize-Italian ryegrass yields. Adding biochar did not change maize silage yield regardless of the fertilization treatments. However, adding biochar with organic fertilization (digestate from the anaerobic digestion) increased maize silage yield by 17.3% and 9.7% in the first and second years compared to the corresponding fertilization without biochar [98].

Figure 5: The effect of biochar application on NO3--N and NH4+-N (a = upland; b = rice field) and available nitrogen (NO3--N + NH4+-N) content (c) in soils under different water regime conditions. Note: N0 = without nitrogen fertilizer addition, N1 = with nitrogen fertilizer addition, UL = upland, PS = paddy soils). Adopted from Wang et al. [59]
On the other hand, they did not detect a significant effect on maize silage yield between the two biochar types despite the physicochemical characteristics resulting from different processing conditions [98]. To clarify the impact of biochar application on soil quality and crop yield improvement, we need to focus more on the nature of soil character and the type of suitable biochar for those purposes. In addition, long-term field-scale trials may be a more effective way to assess the true impact of biochar applications under specific environmental conditions and agronomic management practices.
Emission of GHGs such as CH4, N2O and CO2 has become the primary sources of environmental pollution from livestock businesses. The amplification of the livestock population significantly increased manure production [99]. Most developing countries applied this decomposable organic matter directly or composted it before using it on their land as natural fertilizers [13]. Substantial amounts of harmful environmental gases are emitted during composting, including GHGs.
The emission rates and flux of GHGs from soil applied with manure depend on manure sources and soil moisture content. The CO2 emission from soil amended with cow manure, swine manure and poultry manure has a similar pattern. Still, cow manure has the highest emission rate for certain days after application compared to other manure sources [100]. On the other hand, poultry manure shows the highest emission rate for N2O under similar conditions [101]. The GHGs emission rate from digested manures was influenced by soil moisture content, even though the type of gas shows dissimilarities in soil moisture regime. The CO2 emission started at 10% soil moisture and reached the optimum at 15%. The N2O and NH4 emissions begin to be detected at around 10.5%. On the other hand, CH4 emissions mostly occur under submerged or anaerobic soil conditions. Wet soil drives the action of methanogens, which are the main source of CH4 [102].
The effectiveness of biochar in mitigating GHGs depends on several factors, such as land use management and soil moisture content. Applying biochar to upland soils during the growing season increased CH4 emissions. Although it does not significantly affect ecosystem respiration, the administration of biochar with different treatments reduces N2O emissions [53]. Although applying biochar increased CH4 emissions by 33%, adding N fertilizer to the treatment mixture increased CH4 emissions by 8% (41%). [59]. Nevertheless, biochar amendments were reported to reduce seasonal N2O emissions by up to 80% with and without N fertilizer [59].
Research conducted by Wang et al. [102] showed different results. Wang et al. [102] found a significant reduction in annual cumulative CH4 emissions from straw biochar application by up to 51% [103]. On the other hand, applying biochar increases soil aeration by increasing the inhibition of methanotrophic bacteria and decreasing the ratio of methanogens to methanotrophs [104]. The aging process of biochar can interact with soil organic matter, silicon, iron and aluminum oxide, forming a layer on the surface and within the biochar pores [105]. Biochar pores can also absorb and promote CH4 oxidation [106].
Furthermore, Wang et al. [103] found that CH4 emissions for low biochar amendment (24 t ha-1) (LB) and high biochar amendment (48 t ha-1) (HB) were significantly lower than the control treatment over the four annual cycles. The amendment of soil with biochar in the long term shows the establishment of a stable microenvironment that is suitable for inhibiting CH4 emissions [103, 104]. The study was conducted on upland soil (peanut), showing a positive impact on reducing CO2 and N2O. Meanwhile, the greenhouse gas flux showed that the highest average CO2 emissions occurred in the plots that were given only chemical fertilizers, while the lowest was in combination with compost and biochar treatment. Compost-amended soil reduced the emission of CO2 by 16–33% compared to the only chemical fertilizer treatment. CO2 fluxes from soils containing amendments were generally lower than only chemical fertilizer treatment [109].
Almost all plots with biochar produced 17–65% less N2O per unit of a peanut than plots with chemical fertilizers alone (F). The N2O flux per unit peanut yield was lower in all organic treatments modified than in treatment F. Soil amendment with biochar resulted in a reduction of N2O emissions of 34–71% per unit yield. N2O fluxes in the biochar, compost and biochar plus compost treatment initially exceeded that of the F treatment but quickly fell below the F level [109].
Yanai et al. [110] observed that the addition of 10% (w/w) biochar produced at 700 °C to clay loams reduced N2O emissions by 89% when 78% of the soil pore space was filled with water (WFPS). However, N2O emissions increased significantly when the same soil was rewetted at 83% WFPS. This phenomenon occurs when soil aeration stimulates N2O-producing microbial activity. N2O emission was not detected upon rewetting at 64% WFPS but was detected after rewetting at 73% and 83% WFPS. Yanai et al. concluded that less than 73% WFPS wetting can inhibit N2O emissions compared to wetting above 73%. These results indicate that environmental conditions influence the amount and type of GHG emissions from soil amended with biochar.
Increasing organic wastes from agricultural activities, including the escalation of animal manure, has attracted more attention to managing them properly and environmentally friendlier. Handling organic matter in traditional ways, such as direct application and composting, triggers eutrophication in the water body and enhances greenhouse gas emissions, mainly in the form of CO2, CH4 and N2O, which harm the environment. Many scientists have proved that applying pyrolyzed organic wastes into biochar might be the better way to increase soil quality and mitigate GHG emissions from the agricultural sector. Since biochar has a high pH value, organic carbon content, and surface area with low bulk density, this material is suitable for boosting soil properties such as enhancing pH, soil organic carbon, CEC, and lowering soil bulk density. The improvement of soil quality will increase plant growth and productivity as well. The ability of biochar to retain nutrients and increase water-holding capacity can help increase crop yields even on low-nutrients of biochar.
Challenges for the future are: the effect of biochar on soil quality improvement and GHGs emission mitigation is influenced by the characteristics of biochar raw materials and the charring process, especially temperature. Although we discussed the potential of biochar for improving soil quality and mitigating GHGs emissions, most studies are composed of agricultural wastes, and a few studies assess the function of animal waste biochar. As mentioned, the pyrolization process of animal manure could increase the surface area, which plays an essential role in adsorption performance compared with agricultural waste biochar. Thus, we should find its characteristics and utility for improving soil quality and GHGs emissions. In addition, local climate and soil characteristics also play an essential role in the biochar effect on those parameters. Thus, we should consider an animal waste biochar application rate suitable for climate and soil conditions in temperate, sub-tropical and tropical regions. A more detailed study is needed to evaluate animal waste biochar’s capability to improve soil quality and reduce GHG emissions.
Finally, socioeconomic reasons that prevent the growing use of animal waste biochar should be considered. The slow progress in adopting animal waste biochar at the farmers’ level might be affected by several factors, such as a need for more information about the benefits of using this material and additional cost and labor for biochar production. These problems could be encountered by conducting more experiments on animal waste biochar and transferring the results to the farmer. The second problem needs government support regarding the scale of biochar production. Within the small scale, biochar production will be time and labor-consuming because every step will run manually. On the other hand, large-scale animal waste biochar production requires machinery, which might be impossible for developing countries’ farmers to achieve. Still, it will reduce the cost of production and price of biochar.
Furthermore, to minimize the transport expense, the animal waste biochar factory might be close to the animal waste sources and farmers. Although there are some socioeconomic issues with using animal waste biochar, reducing GHGs emissions is an urgent global agenda. Thus, carbon credit may create a chance for farmers to use animal waste biochar in the future, and this would solve environmental issues triggered by animal waste.