Current Status and Future Outlooks of Precision Beekeeping Systems and Services
2024 年 12 巻 p. 165-181
詳細
2024 年 12 巻 p. 165-181
Precision beekeeping has emerged as a response to the need for optimizing beekeeping management using sensors and specialized programs, aiming to provide beekeepers with insights into hive conditions without the need for frequent inspections. While the field has made solid advances, particularly with data such as hive weight and temperature, recent years have seen the emergence of sound and image-based methods, opening up new possibilities. There is a need for sensors capable of detecting queen bee presence, Varroa mite levels, disease and predator presence and prediction of swarming behaviour. Sensors that can detect nectar scents and other hive odours, as well as accurately predict the timing for honey harvest and feeding requirements, needs to be designed or improved. Integrating data collection, machine learning, artificial intelligence, and best management practices into an intelligent apiary management system is crucial for the advancement of precision beekeeping.
Traditionally, monitoring beehives have relied on manual and visual inspections. However, these inspections are time-consuming for beekeepers and disruptive for the colonies, thus they are not carried out continuously. Typically, beekeepers inspect their hives every two or three weeks during the main flowering season. Nevertheless, significant changes in colony population dynamics, such as swarming, starvation, or colony death, can occur between these inspections, necessitating continuous monitoring [1].
Passive monitoring of honeybee colony health and fitness has garnered significant interest, particularly in the past two decades. Improvements in in-hive sensors and digital data processing from the hive environment have been observed during this time [2].
Methods of precision agriculture (PA) have been developed and adapted for various agricultural sectors [3]. Precision beekeeping (PB) is defined as a beekeeping management strategy focused on monitoring individual beehives to minimize resource consumption, maximize bee productivity, and reduce stress and unnecessary interventions in beehives [4, 5]. The aim of PB is not to replace beekeepers but rather to support their decisions, which remain pivotal in beekeeping.
PB employs so-called “smart hives”, equipped with sensors aimed at detecting parameters describing the colony’s condition state. These sensors provide information to the beekeeper via web-based systems accessible on smartphones, enabling beekeepers to selectively inspect only the hives that require immediate attention.
The primary goal of data collection in PB is the development of real-time and online tools for continuous hive monitoring. These tools operate, at least partially, at the level of individual hives and utilize solutions based on automatic or automated information technologies [4].
During both the passive (broodless) and active (foraging period) phases of bee colony development, various challenges related to PB exist, where remote monitoring of beehives can be applied. These challenges include:
- Events requiring beekeeper intervention, such as swarm behavior, significant nectar flow, queenless states, broodless states, colony loss, colony poisoning, and starvation [1, 9, 10, 11, 12, 13].
- Presence of diseases, parasites, and predators of the bee colony [14, 15, 16, 17].
PB is a relatively new and promising trend in beekeeping, involving collaboration among experts from various countries. Several European collaborative research projects have been conducted recently, including ITAPIC [18], IoBee [19], SAMS [20], Swarmonitor [21], BeeConnected [22], B-GOOD [23], and Hiveopolis [24]. Numerous team projects dealing with bee colony monitoring exist, with some listed by Chlebo et al. [25]. Some projects stream monitoring data via web applications, including the connected hives of the authors accessible at bee.uniag.sk.
Similar to other fields of PA, PB can be divided into three phases: data collection, data analysis and data application [3].
During the data collection phase, information is gathered from measurements within the hive environment or its immediate vicinity. The phase of data analysis derives conclusions from gathered information, predetermined models, and expert knowledge. In the data application phase, decisions are made, and actions are taken based on data analyses to improve hive performance.
According to Zacepins and Stalidzans [3], three different levels of collecting bee-related data exist:
2) Parameters at the colony level (temperature, humidity, gas content, sound, video, hive vibrations, and weight).
3) Parameters related to individual bees (hive entrance activity monitoring).
Parameters at the colony level represent the aggregate activities of all or most individuals (bees) forming the colony, whereas parameters based on individual bees provide information about the colony’s behavior based on the actions of a subset of individuals within the total bee population.
Monitoring at the apiary level involves analyzing landscape features, farming practices, floral diversity, and abundance, facilitated by GIS (geographic information system) analysis, and climate and weather data obtained through meteorological or video observations [26].
2.1 GIS analysisGIS analysis serves to optimize bee forage and/or the density of beehives, typically provided as a service by third parties and relying on data from hive scales to gauge nectar flow at the hive level. Selecting a suitable location for a bee apiary is a critical task for beekeepers, particularly migratory ones. Aerial and satellite images of agricultural fields can aid beekeepers in locating and choosing appropriate apiary sites [27, 28]. The B-GOOD Project [23] outputs a database of relevant resources for honeybees [29]. Zahid Sharif et al. [30] provides an overview of big beehive data and their potential applications in supporting climate-smart agriculture. Komasilova et al. [28] improve migratory beekeeping practices using a digital flowering calendar, while Kotovs and Zacepins [31] present a GIS-based interactive map to enhance the scheduling of beekeeping activities. The Animal, Landscape, and Man Simulation System (ALMaSS) finds applicability in beekeeping, including pesticide risk assessment [26].
2.2 Meteorological observationsThe study of meteorological parameters in the vicinity of beehives can shed light on certain behaviors exhibited by bee colonies. Parameters such as temperature, relative humidity, wind speed, precipitation, and light intensity play crucial roles in influencing the collection of pollen and nectar by bees [32].
Observations have indicated that honey production declines notably during periods of high wind speeds, particularly when wind peaks exceed 4 m/s. This decline can be attributed to bees being hindered from leaving the hive and their increased consumption of stored honey [33]. Additionally, bee activity diminishes on rainy days, especially when the ambient relative humidity exceeds 80%. Interestingly, honeybees demonstrate a capability to anticipate forthcoming rainfall by intensifying their foraging activities [34].
Research conducted by Clarke and Robert [35] reveals that approximately 78% of the variance observed in bee activity can be explained by fluctuations in temperature and solar radiation. Foraging endeavors are observed across a broad temperature spectrum, ranging from 10 to 40 °C. However, deviations from the optimal brood-rearing temperature of 35°C necessitate significant energy expenditure by bees to either cool or warm the hive, depending on whether temperatures are excessively high or low. Nonetheless, the costs associated with thermoregulation appear to be relatively consistent within the temperature range of 13–30 °C [36].
Access to meteorological data can be facilitated through established meteorological stations, as weather patterns tend to be consistent across larger geographical areas [37].
2.3 Video observationsVideo surveillance offers an alternative method for acquiring meteorological data, albeit with somewhat lower precision. By monitoring the movement of leaves and branches, wind conditions can be inferred, while the presence of raindrops on camera lenses indicates rainfall. Video surveillance systems generate extensive data, with cameras capable of activation either based on specific triggers, such as motion or sound detectors, or upon user request. Utilizing rotating cameras equipped with zoom capabilities enables comprehensive monitoring of multiple hives within a site. Furthermore, these cameras can be programmed to capture footage triggered by various events, including human activity, vehicle movements, animal presence, or any other disturbances potentially affecting bee colonies [5]. Consequently, video surveillance systems can serve as integral components of apiary security measures. In regions prone to bear intrusions, apiary security often involves the installation of electric fences as additional protective measures [16].
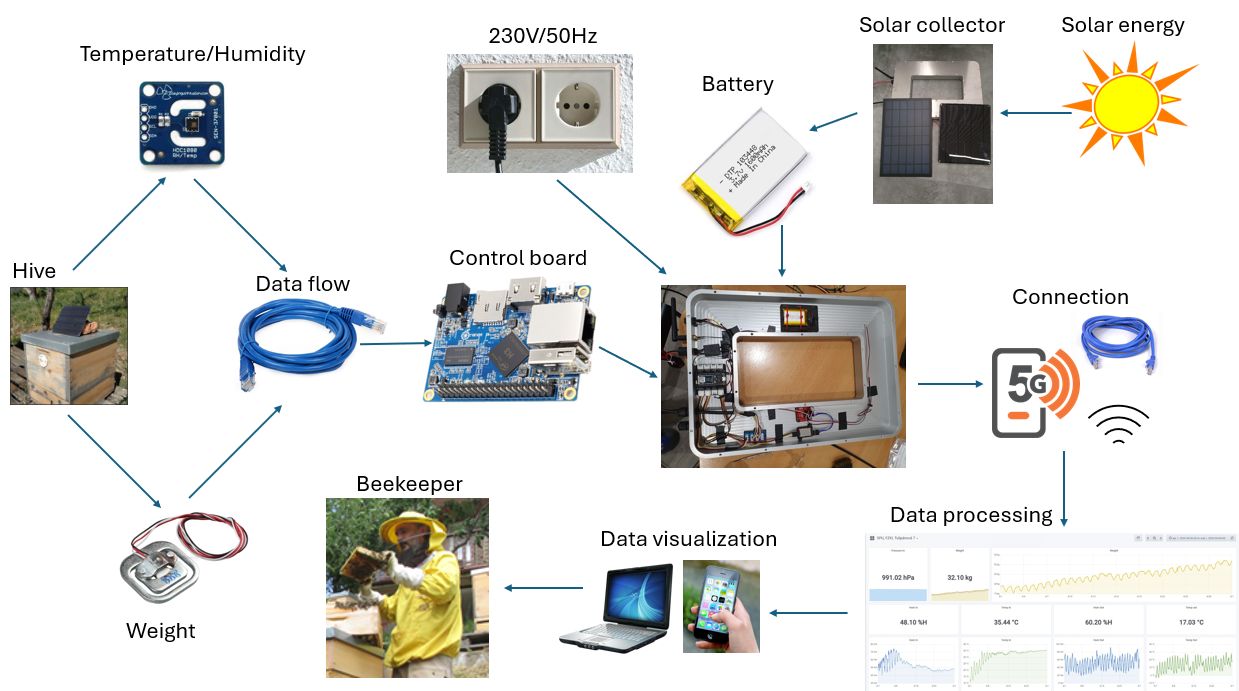
The primary measurements employed in beekeeping involve monitoring weight, temperature, and humidity within beehives (Fig.1). These data are typically presented in a straightforward manner and can be graphed over time, enabling beekeepers to readily interpret hive conditions. However, additional sensors capable of monitoring sound, vibration, and gas content are also available. Automated analysis and recognition algorithms are often necessary to interpret these data effectively, providing valuable insights into the hive’s status [5, 38].

Many electronic colony monitoring vendors offer electronic hive scales, typically positioned externally at the base of the hive to measure its total weight. One notable distinction among these systems lies in the number of load cells employed, which can range from one to four [39]. Products featuring a single load cell usually incorporate a robust frame to support the hive directly above the load cell, which is centrally positioned beneath the hive [4]. In contrast, systems utilizing four load cells typically distribute them at each corner of the hive, facilitating more accurate weight measurements [40].
Monitoring the total weight of the hive, encompassing supers, frames, combs with reserves, and bees, enables tracking of various hive conditions. These include the occurrence of nectar flows during different seasons, daily reserve increments, consumption of reserves during non-flowering periods, robbing and the swarm occurrence indicated by reductions in hive weight [38, 40].
Throughout the day, normal fluctuations in hive weight are observed: a decrease of approximately 300–500 g in the morning as bees venture out for foraging, followed by a gradual increase upon their return [33]. During colder seasons when foraging activity is limited, bees rely on internal hive stores, leading to a daily decrease in colony weight ranging from 30 to 80 g [41].
Integration of feed data with hive weight and brood volume measurements can offer valuable insights. Electronic feed monitoring devices can signal when feeders are empty or report the rate at which feed is being consumed. Timely intervention is crucial to prevent colony losses due to starvation, which can occur during both winter and summer months [39].
Alternative systems focusing solely on measuring the weight of individual frames have been proposed by Li et al. [41] and Sakanovic and Kevric [42]. These systems employ twenty sensors, with two sensors dedicated to monitoring each frame’s weight within the hive.
3.2 Internal temperatureTemperature sensors within the hive environment, commonly thermometers, offer insights into various critical conditions such as brood status, winter cluster dynamics, and both internal and external environmental factors [4, 6]. In many cases, sensors monitoring internal hive temperature also track humidity levels. Beekeepers and researchers leverage temperature data to glean valuable insights into hive conditions, including changes in food consumption, onset of queen laying, swarming tendencies, and mortality [36, 41]. Achieving accurate assessments of brood rearing requires the strategic placement of multiple sensors within the hive, often one or two per frame [36]. When monitoring internal hive temperature, sensor placement is crucial. Sensors positioned near the brood, within the central and warmest regions of the hive, are less susceptible to external influences [5]. These sensors can be housed within a small box at the center of a standard frame [43], placed centrally within the hive near the brood area [33], or directly embedded within hive wood panels [2, 41]. Integration of sensor data collected within the hive with meteorological records and regular inspections has yielded highly precise predictive models, as demonstrated by several researchers [29, 37, 44]. Infrared spectrum cameras offer a complementary approach to temperature measurement within the hive, enabling more accurate predictions of colony behavior [36, 45, 46]. External infrared cameras are particularly useful for monitoring bee cluster positioning during overwintering periods [41].
3.3 Relative humiditySystems for measuring air humidity to monitor bee activity typically complement temperature measurement setups. Unlike temperature sensors, humidity sensors are pricier and require protection from bees as water vapor can’t penetrate wax or propolis to reach the sensor. Relative Humidity (RH) inside the hive serves as an indicator of colony health and optimal development, often stabilized by around 70% by bees [5]. Similar to temperature, RH aids in predicting swarming events, with observations showing a decrease in RH preceding swarming likely due to ventilation [47].
3.4 Acoustic and vibration indicatorsWithin beehives, common vibroacoustic signals include body and wing movements, muscle contractions, and interactions such as pressing thoraxes against substrates or other bees. Auditory signatures unique to multiple queen bees, such as piping, quacking, and tooting, have been identified [48]. While experienced beekeepers may detect some of these sounds, manual classification is challenging. Consequently, proposals include the use of microphones and vibration sensors (e.g., accelerometers) both inside and outside hives [1, 9, 49]. Monitoring these indicators can categorize normal and swarming bee activity, queen presence, hive strength, drone presence, worker density, pest infestations, and physiological changes by analyzing audio signals against predetermined matrices [10, 43, 44, 47]. Active ultrasound monitoring can also assess hive space, aiding in determining bee cluster size [50]. Swarming onset often coincides with increased sound spectral density at around 110 Hz, with sound amplitude rising at 300 Hz as bees initiate swarming [10, 21, 47]. Various commercial sound monitoring devices have been proposed [12, 51], including those using smartphones for hive sound recordings and multi-sensor solutions for comprehensive data collection [1, 39]. While measuring sound is relatively straightforward, challenges arise from sensor placement and environmental noise. Sound analysis is complex and not widely used in beekeeping due to the variability and complexity of hive sounds [1, 13, 39, 51].
3.5 GasesOxygen and carbon dioxide levels within hives have been examined in various experiments due to their roles in metabolism [15, 39]. Changes in carbon dioxide (CO2) levels are linked to bee metabolic activity. Elevated CO2 levels prompt bees to ventilate the hive to maintain it within an acceptable range, typically between 0.1% and 4.3% [52]. Low CO2 levels may signal bee loss due to disease, poisoning, predator attacks, or a queenless colony, necessitating immediate beekeeper intervention [5]. Systems for alerting high CO2 levels are also applicable in snow-prone areas during winter, emitting preliminary alarms to prompt actions like cleaning the flight board and opening hive entrances [36, 52]. While Non-Dispersive Infra-Red (NDIR) detectors have become the primary method for measuring atmospheric CO2 [53], automatic gas measurements are costly compared to temperature measurements, limiting their widespread adoption.
Counters or cameras positioned near hive entrances are utilized to track individual bees [54, 55]. Data regarding individual bees are closely linked to colony-level metrics, as counting systems or entrance images are analyzed collectively to gauge hive health [16]. Bee flight activity, defined as the number of bees entering and/or leaving the hive within a specific timeframe, can exceed 100,000 flights per day in well-established hives during spring [5, 55]. Flight activity sensors offer insights into colony populations, foraging patterns [35], and the effects of pesticides [54] and predators [56] on bees.
Observing landing board activity includes various colony activities such as pollen collection, worker orientation, queen mating, drone behavior, and other tasks like fanning, guarding, bearding, cleansing, swarming, absconding, usurping, robbing, and undertaking [39]. Using dead bee traps to track daily bee losses across a season is prone to errors as bees become accustomed to the traps and empty them [55]. An automated counter offers a more efficient solution for visualizing the impact of pest control measures and long-term sublethal impacts in real field settings [54, 55, 56].
Landing board activity monitors are categorized based on sensor type and the range of activities they can potentially monitor. Video-based monitors are the most versatile, followed by audio-based systems (distinct from in-hive audio monitors), and then foraging bee-focused monitors like bee counters. Odemer [55] provides an overview of automated bee counting devices, highlighting approaches, challenges, and recent advancements.
4.1 Video-based activity monitorsExisting solutions primarily focus on observing single hives on-site, as outfitting each hive with a camera is economically impractical due to the vast amount of generated data [55]. Video cameras require significant power and rely on household current connections, limiting their use to yards with electrical outlets. Future video system development should incorporate analytical overlays to provide beekeepers with processed data rather than raw footage or images.
Image resolution should be adequate to differentiate bee direction, drones and workers, including pollen bearers. Ideally, analysis software would detect various entities such as drones, queens, hornets, wasps, small hive beetle (SHB) adults and larvae, wax moths, and Varroa mites on bees [39]. Promising approaches have been made by using enhanced video-based systems to record bee flight activity utilizing deep learning and artificial intelligence, allowing to measure the effects of environmental or anthropogenic sources [55].
4.2 Audio-based activity monitorsAudio-based entrance activity monitors consume less power than video-based counterparts and can operate on small batteries. Software interpretation of audio data allows beekeepers to receive colony status reports, detecting activities beyond foraging or fanning, such as orientation flights, swarms, absconding, and queen mating flights [39, 55].
4.3 Bee countersBee counters primarily focus on foraging, tallying bees entering and exiting the hive. These monitors employ mechanical, optical, or electrical field sensors to detect bee movement through small holes, bypassing other entrance board activities like fanning and undertaking. Mechanical or electronic counters feature multiple tunnels or openings, each sized for a single bee and equipped with sensors to track bee direction. Real-time tracking of honeybee traffic at the hive entrance allows for the absolute measurement of within-colony mortality rates by subtracting exits from entrances [26].
The efficiency and operational costs of a monitoring system are heavily influenced by data transmission. The balance between knowledge acquisition and hardware/software expenses is crucial (Fig. 2). Various communication technologies are available for colony monitoring, with NFC (Near Field Communication), Bluetooth, and Wi-Fi products often impractical due to limited range. While wired sensors are cost-effective, they may not be suitable for field conditions [39]. Cellular data communication is commonly used, especially since many beekeepers place their apiaries within cell tower range. This service falls under IoT (Internet of Things) and M2M (Machine to Machine) categories. Wireless sensor networks (WSN) have revolutionized monitoring systems, comprising embedded devices capable of data acquisition, processing, and communication with computers and cloud databases. These devices, called nodes or motes, are central to IoT, which connects Internet-enabled objects to web services [4, 5, 46]. Hadjur et al. [16] propose a peer-to-peer topology for network nodes, facilitating resource sharing and task parallelism.
Sensor protection is essential to prevent propolization, often achieved through mesh coating. Sensors are linked to microprocessors powered by batteries and connected to networks for remote data transmission. Arduino and Raspberry Pi are commonly used microprocessors [16]. Data is sent to the cloud for storage, analysis, and alarm generation, with some systems providing beekeepers with data via applications [7, 16]. Access to the electricity network or alternative energy sources is crucial for powering devices. Solar or photovoltaic energy, with panels directly attached to beehives, is a viable alternative. Micro-fuel cells powered by honey are an intriguing option, though still in research stages [39]. Energy-autonomous wireless sensor nodes, harvesting energy from plant microbial fuel cells, offer an eco-friendly, battery-free power solution for continuous monitoring [57].
Currently, scientists and beekeepers rely on hive inspections to understand data significance before developing automated analyses and recognition algorithms. These algorithms interpret data and inform beekeepers about hive conditions, with recognition rules tested for statistical significance based on measurement sensitivity.
6.1 Displaying and interpretationWeights and temperatures are graphed over time for beekeepers to interpret. Changes in hive weight signal nectar flow initiation or cessation, prompting actions like adding supers or harvesting honey. Rapid weight changes can indicate robbing, swarming, or swarm departure. Comparing daily weight gains between colonies during a nectar flow provides information for further analysis, such as resolving unproductive colonies or selecting colonies for queen breeding [40].
A change in brood box temperature from external temperatures to a steady 34 °C indicates brood raising commencement. A gradual rise in temperature over a few hours to 34 °C in the brood box, but away from the brood suggests bees are warming up, possibly for swarming [6]. Supplementing hive weight with temperature and humidity data aids determining queen laying adequacy, brood and egg presence, and swarming tendencies [11, 39].
6.2 Data analytics as a serviceAll non-weight and non-temperature data, like audio and image data, require analysis before display to beekeepers. Alerts, such as hive tipping, are immediately reported via text message [58]. As sensor system costs decrease and capabilities improve, future colony monitoring systems are expected to become more prescriptive. They will interpret data meaning and recommend beekeeper actions, especially when analyzing data from multiple honeybee colonies for outcomes [25, 39]. Development of decision support systems and specific digital surveillance system-controlled electronic devices will enable new functionalities for precision beekeeping, transitioning from "smart" to "intelligent" hives. Intelligent hives can monitor hive health, suggest improvements in production, pollination, or bee health, and recommend customized best management practices and treatments [39].
6.2.1 Audio AnalysisBees communicate vital information within the colony through acoustic signals, conveying details about food sources, potential dangers, and queen-related matters. Analyzing beehive sound data is crucial for assessing colony health and averting hazards. Sound filtering can be an initial step, followed by extracting numerical features from audio samples for classification, relying on high-quality training data [16]. Vibrational data analysis has successfully predicted swarming events up to a month in advance [49]. Machine learning-driven beehive audio analyses are rapidly advancing, but still rely on the knowledge from experimental studies from the past century [16, 43, 44, 49, 59].
6.2.2 Image AnalysisIn precision beekeeping, image analysis involves pre-processing to remove backgrounds and shadows, isolating individual bees for counting, tracking, and detecting pollen or parasites on their bodies. Classical machine learning and deep learning methods have been explored for pollen-bearing bees and Varroa mite detection [14, 32, 60, 61, 62]. Diverse image-processing techniques combined with object detection algorithms significantly enhance bee mite detection quality [62].
6.2.3 Statistical ForecastingForecasting hive variables like temperature drops or bee activity volume is essential for proactive hive management. Long short-term memory (LSTM) algorithms have been utilized for temperature drop anticipation [63, 64], while time-varying Vector Autoregressive Models (tvVAR) are employed for forecasting internal hive variables [65]. Proposals include predictive models for honeybee activity with alarm systems estimating bee outflows and inflows per hour [7]. Combined data mining from in-hive sensors, weather, and apiary inspections is explored for forecasting honeybee colony health status [37].
Beekeepers’ reluctance to invest in digital solutions highlights the necessity of minimizing the cost of smart hives [4]. To mitigate expenses, only select hives within an apiary may be equipped with sensors, assuming similar conditions across colonies [16]. Mainstream commercial sensors typically focus on monitoring hive weight, temperature, and humidity, with flight activity sensors surprisingly underrepresented in modular PB systems [66]. The prevalent system for hive monitoring carries an average cost of approximately €422 per hive, ranging from €216 to €874 per hive, as deduced from an analysis of 16 out of 32 PB systems available on the market [66]. High purchasing costs of PB systems, unrealistic perception of the apiary status if they applied to some hives only strongly affects the success of commercial PB systems, as they will be measured in terms of return on investment, conditioned especially by the benefits (higher yields, better colonies’ health) that the beekeeper will appraise as a consequence of their use [25, 39, 66]. Companies have the opportunity to distinguish themselves by tailoring their offerings to different segments of the beekeeping market, including backyard beekeepers, small and large honey producers, pollination providers, packaged bee producers, queen breeders, and researchers, each with unique monitoring requirements [39].
While multisensory platforms offer comprehensive data collection, they remain largely within the realm of research due to their higher cost and the need for extensive data analysis [2]. However, innovative methods like quantifying colony size through adult bees weight and conducting image analysis of combs provide promising avenues for colony assessment [8]. Research papers on PB systems should elucidate the rationale behind sensor placement, as well as delineate the constraints that influenced these decisions and justify why alternative options were not chosen. Addressing the needs of beekeepers underscores the necessity for the development of more affordable commercial solutions. There exists a dichotomy between creating a unified solution capable of aggregating data from all beekeepers and constructing AI models, and the economic dynamics of competition [16].
New detecting and predicting sensors and applications are designed or improved. Integrating data collection, machine learning, artificial intelligence (AI), and best management practices into an intelligent apiary management system is crucial for the PB advancement.
8.1 Sensors and systems under developmentDeveloping sensors capable of providing essential information to beekeepers, such as queen presence and fitness and Varroa mite levels, remains a priority. Other parameters are for now in the eyes of beekeepers less important [39]. However, sensors allowing precise feeding, time for honey harvest, presence and levels of Varroa and other diseases / predators, presence of pollutants, interpreting bees pheromone communications, detecting nectar scents and other hive odors and predicting swarm mood needs to be designed or improved [25, 39, 67].
8.1.1 Queen PresenceDespite attempts to detect queen bee presence through acoustic and vibration analysis, no reliable method exists yet. If the hive had no metal except a metallic tag on the queen, the scanner could pick it up [39]. Some approaches rely on frequency domain features [12], while others utilize machine learning algorithms [9, 11, 59]. Fine-grained temperature grids in brood boxes may also hold potential for detecting queen laying activity [13].
8.1.2 Varroa LevelVarroa mites present a significant challenge due to their adaptation mechanisms and concealed reproduction within capped brood cells. Gas sensors have shown limited effectiveness [15], and further research is needed to develop reliable detection methods. Varroa mites and bees are different colors, but as it is dark inside a beehive, even artificial vision can be applied [61]. Video stream analysis supported by deep learning algorithms appears promising for early Varroa detection [17, 68]. BeeScanning, VarroaCounter, Apizoom and other mobile phone applications counts mites using image recognition, but the photos must be uploaded manually.
8.1.3 Swarming PredictionSwarming prediction remains crucial for maintaining colony productivity. While various approaches have been explored, user-friendly solutions are still lacking. Combining measurements of sound, temperature, and humidity may enhance swarming prediction accuracy [47]. Most probably swarming prediction will use mostly remote and automated acoustics-based systems [10, 63, 69]. Integrating low-frequency accelerometers and temperature data into prediction models could improve their effectiveness. Regarding the prediction of swarming, only study of Ramsey et al. [49] seems to be successful in accurately predicting swarming events in honeybee hives. Successful prediction often requires intensive data analysis, highlighting the need for further research [13, 49, 63].
8.1.4 Predator DetectionUsing landing board microphones to analyze hive entrance sounds allows for easy discrimination between flying worker bees, drones, wasps, and hornets [26]. Video surveillance systems can also aid in preventing invasions by animals and pests such as bee-eaters or hornets [16, 56]. Additionally, the ultrahigh vibrational pulses generated by bees working on wax honeycombs support the concept of detecting the presence of Small Hive Beetles (SHB), although distinguishing these pulses from those of wax moths remains a challenge. Artificial noses could potentially detect yeast associated with SHB [26].
8.1.5 Pathogen DetectionAutomated estimation of bee parasite loads, including gut parasites through fecal analyses and ectoparasites or fungi through screens at the bottom board of hives, would provide valuable insights into the impact of these biological agents on bee behavior and colony health [67]. Additionally, artificial noses show promise in detecting specific odors associated with diseases like American Foulbrood - AFB [70].
8.1.6 Comb Cells ClassificationAlves et al. [71] have introduced a method for automatically detecting and categorizing honey bee comb cells through deep learning. This approach utilizes free software capable of distinguishing between cells containing eggs, larvae, capped brood, pollen, nectar, honey, and other materials. However, it requires the application of a wooden tunnel to seal out external light. Future endeavors will concentrate on devising a service that allows users to remotely process images [71].
8.1.7 Honey QualityDetecting nectar scents could inform beekeepers about nectar sources [72]. Sensors for monitoring the nutritional quality of pollen and nectar entering the hive are proposed but require further research [67]. Ripe honey detectors could signal when honey frames are ready for harvesting, potentially based on continuous glucose monitors, although current costs limit their adoption for in-hive monitoring [39].
8.1.8 Pollutant MonitoringMicro sensors for air pollutants can be adapted for use in connected hive systems, and non-invasive samplers have been applied for detecting pesticides, microplastics, heavy metals, and air pollutants through initiatives like Insignia-EU [73], however further laboratory analyses of the samplers are needed. Como et al. [74] showed that hive acoustics could be applied to detect certain atmospheric pollutants. Correlating exposure to electromagnetic fields with colony dynamics will inform about the impact of electromagnetic pollution, including communication systems used for connected hives on bee health and pollination [75]. Additionally, correlating environmental stressors with cognitive scores through automated setups can help identify the effects of specific stressors on bee cognition and create a “cognitive health sensor” [67].
8.1.9 Odor SensingOdors in the hive include bees’ pheromones, foraged nectars, disease odors, and environmental scents. The chemical environment of the hive is perhaps too complex for there to be a pheromone sensor system in the near future [39]. Detailed chemical analysis of honey bee worker brood volatile profile from egg to emergence as a base for future research is summarized by Noël et al. [76]. Odors can be used to detect the ratio between brood and adult bees [76], nectar sources [74] and various diseases, including AFB, SHB and Varroa [26, 70].
8.1.10 Aerial DronesSince satellite communications to the internet are still expensive, UAV (unmanned aerial vehicle) drones can be used to monitor data from hives in areas without cell phone coverage, hives that are widely dispersed, or locate and inventory hives equipped with RFID (Radio Frequency Identification) tags (f.e. locate hives suspected of being stolen). However, colony monitoring product or service for beekeepers using UAV drone technology is not commercially available until now. UAV drones are rather tested for artificial compensatory pollination in facility agriculture [77] or for streams live video used to find honey bee drone congregation areas [78].
8.1.11 RoboticsContainer-type hives equipped with automated systems based on AI, computer vision, and precision robotics are already developed [79]. These systems offer features such as remote monitoring, automated feeding, Varroa treatment, and honey harvesting. Discussion on in-hive thermoregulated environments - heating or/and cooling system implementation into practice is opened [4].
Additionally, research in robotics explores concepts such as ecosystem hacking, where robots interact with honeybee colonies to influence collective behavior and improve their interaction with the surrounding ecosystem [80, 81]. For example, biomimetic waggle dancing robots have been studied to assess their ability to influence swarm-intelligent decision making within honeybee colonies, potentially aiding in tasks such as avoiding dangerous food patches [82].
8.2 Data sharingPooling and sharing colony data among beekeepers is crucial for developing local best practices for honey production and colony health. The development of Bee XML, based on the Extensible Markup Language (XML), aims to establish a standard for storing and transporting bee data, facilitating easier exchange of information between individuals and groups using different colony monitoring systems [39, 83]. By adopting this standard, beekeepers can seamlessly share data about bees and beekeeping practices, regardless of their monitoring system.
To harness the full potential of shared bee data, it’s essential to integrate data collection, machine learning, and best management practices into an Intelligent Apiary Management System [39, 83]. This system would enable beekeepers to make informed decisions based on comprehensive data analysis and insights derived from shared datasets.
Furthermore, researchers can contribute to the pool of bee data by sharing datasets from previous projects, especially if there is a motivation to do so, such as through indexed scientific journals specialized in publishing datasets. Supplementing data from automated systems with surveys, questionnaires, and field-level data collection opens opportunities for citizen science projects like the World Bee Project [84]. These projects can incorporate external drivers such as nectar and pollen sources, weather and climate conditions, and beekeeping management practices to provide valuable insights into colony variables [30].
Examples of existing beekeeping data sharing initiatives include databases like the Bee Informed Partnership [85] in the US and the Bee Hub [86] in the EU, which serve as valuable resources for beekeepers and researchers alike. By embracing standardized data sharing practices and leveraging technological advancements, the beekeeping community can collectively work towards improving honey production and colony health.
The integration of connected hives into beekeeping practices offers numerous benefits, including real-time monitoring that minimizes management costs and reduces stress on bee colonies. Over the past century, manual observations have laid the groundwork for fundamental apiary knowledge, but the advent of IoT systems since around 2010 has led to exponential improvements in data quality and quantity, fueling the growth of apiary research worldwide.
While individual parameters measured by sensors provide valuable insights, simultaneous detection of multiple parameters offers a more comprehensive view of hive health and behavior, enabling the development of complex forecasting models. The future of hive monitoring lies in predictive monitoring, where anticipated future states of hives can be preemptively managed by beekeepers using novel monitoring technologies.
Despite the wide range of sensors and systems available for hive monitoring, the field is still evolving, with few low-cost, reliable, and useful options currently on the market. Future developments may include sensors for monitoring liquid feed levels, honey quality, Varroa presence, and hive ventilation processes, among others.
For PB to be effective, it must address not only apiary productivity but also hive welfare, particularly in managing honeybee pests and parasites. This requires a focus on understanding the complex relationships among food source availability, environmental stressors, bee genetics, and hive pathologies.
The future of PB lies in the integration of efficient, operational AI models and the analysis of energy footprints to enable autonomous solutions. Aggregating data from beekeepers, scientific projects, weather data, and crop data promises to yield new scientific discoveries and insights into bee behavior and conservation biology. Ultimately, PB has the potential to mitigate the negative impacts of climate change on bees and reduce pesticide use, thereby contributing to the survival of bee colonies.