Abstract
Water deprivation activates the renin-angiotensin system. We have hypothesized that the renal expression of (pro)renin receptor ((P)RR), a specific receptor for renin and prorenin, could be changed under dehydration. Moreover, plasma levels of soluble (P)RR (s(P)RR) comprising of the extracellular domain of (P)RR may reflect the renal (P)RR expression. In the present study, we therefore aimed to clarify changes of plasma s(P)RR concentrations and kidney tissue (P)RR levels using rats with dehydration. Male Wister-Kyoto rats were divided into two groups; dehydrated (DH) rats deprived of water for 72 hours with free access to food, and control rats. Plasma s(P)RR concentrations measured by enzyme-linked immunosorbent assay were significantly lower in DH rats (6.94 ± 2.08 ng/mL, mean ± SD, n = 5) than in control (12.54 ± 2.00 ng/mL, n = 5) (p < 0.05). Western blot analysis confirmed lower expression levels of s(P)RR in plasma in DH rats than in control. By contrast, western blot analysis showed higher levels of full-length (P)RR and lower levels of furin (an enzyme responsible for generation of s(P)RR from full-length (P)RR) in the kidney tissues obtained from DH rats compared to control. There was no significant difference in the renal (P)RR mRNA levels between DH rats and control. These findings suggest that water deprivation may elevate the renal full-length (P)RR levels via reducing the expression of furin. Increased full-length (P)RR may contribute to the up-regulation of the renal renin-angiotensin system and the production of concentrated urine under dehydration.
Introduction
(Pro)renin receptor ((P)RR), a specific receptor for renin and prorenin, is a 350-amino acid protein with a single transmembrane domain (Nguyen et al. 2002; Nguyen 2011). The binding of prorenin to (P)RR activates the angiotensin I (Ang I)-generating activity of prorenin, and directly stimulates the intracellular signalling pathways, including extracellular signal-regulated kinase (ERK 1/2) (Nguyen et al. 2002; Nguyen 2011). Soluble (P)RR (s(P)RR) comprising of the extracellular domain of (P)RR, and a truncated form of (P)RR at the C-terminal region (truncated (P)RR) are generated from full-length (P)RR (f(P)RR) by furin (Cousin et al. 2009; Nguyen 2011). The truncated (P)RR is associated with vacuolar H+-ATPase (v-ATPase), an ATP-dependent multi-subunit proton pump (Ludwig et al. 1998). (P)RR is also related to the Wnt/β-signaling pathway (Cruciat et al. 2010).
Soluble (P)RR has been shown to be present in plasma and urine (Cousin et al. 2009; Gonzalez et al 2011; Maruyama et al. 2013). Plasma concentrations of s(P)RR were elevated in patients with chronic kidney disease (Hamada et al. 2013), pregnant women with the development of gestational diabetes mellitus or hypertension later in pregnancy (Watanabe et al. 2012, 2013), and patients with obstructive sleep apnea syndrome (Nishijima et al. 2014, 2016).
Water deprivation is a progressive physiological condition associated with increased plasma osmolality and activation of the renin-angiotensin system (RAS) (Gottlieb et al. 2006). RAS plays an essential role in the regulation of arterial blood pressure and electrolyte balance (Laragh 1967). Because angiotensin activity can correct such disturbances, it is generally accepted that RAS is a homeostatic mechanism that maintains the quantity, composition, and distribution of body fluids.
Immunohistochemical studies showed that (P)RR was diffusely expressed in renal tubular and collecting duct cells of both human and rat kidneys (Hirose et al. 2009, 2010; Takahashi et al. 2010b). Expression levels of (P)RR in the kidney were up-regulated in rats with congestive heart failure or chronic renal failure due to 5/6 nephrectomy (Hirose et al. 2009, 2010). Ramkumar et al. (2015) showed that nephron-specific deletion of the (P)RR caused a urine concentration defect, and suggested that nephron (P)RR can potentially modulate renal water excretion. We have recently reported that high salt intake upregulates (P)RR expression in rat nephron (Rong et al. 2015). Our hypothesis is therefore that (P)RR expression in the kidney could be changed under dehydration and that plasma s(P)RR concentrations may reflect the renal (P)RR expression. The aim of the present study was therefore to clarify changes of plasma s(P)RR concentrations and kidney tissue (P)RR levels in rats with dehydration.
Materials and Methods
Water deprivation experiment
The present study was approved by the Ethics Committee for Animal Experimentation of Tohoku University School of Medicine, and performed in accordance with the guidelines for animal experimentation of Tohoku University.
Male Wister-Kyoto (WKY) rats at 11 weeks of age were obtained from Charles River Japan Ltd. (Yokohama, Japan). Rats were kept in metabolic cages for 7 days for acclimatization before the start of treatments. Rats were housed under controlled humidity (30 ± 10%) and temperature (22 ± 12°C) with a 12-h light/dark cycle, were fed a regular diet, and had free access to tap water. After 7 days, rats were randomly divided into two groups: control (n = 5) and dehydrated (DH) rats (n = 5). For control rats, water and food were supplied ad libitum for 72 h, while DH rats were deprived of water for 72 h with free access to food (Chung et al. 2008; Hindmarch et al. 2011).
Urine samples were collected during the last 24 h of 72-hour water deprivation using a metabolic cage. After 72-hour water deprivation, the rats were anesthetized with pentobarbital sodium (50 mg/kg, injected intraperitoneally), and blood samples were collected from the cannulated abdominal aorta. Kidneys were quickly removed, snap-frozen in liquid nitrogen and stored at −80°C.
Western blot analysis
To prepare the renal fraction, frozen left kidney was pulverized in liquid nitrogen (Heineke et al. 2010). One-third of the powdered sample was used as the whole kidney fraction (Chmela et al. 2001). This fraction was homogenized in 100 mmol/L potassium buffer (pH 7.25) containing 30% glycerol, 1 mmol/L dithiothreitol, and 0.1 mmol/L phenylmethylsulfonyl fluoride. Microsomal and cytosolic fractions were separated from the remaining powdered sample, as described previously (Jorgensen 1974; Chmela et al. 2001).
Western blot analysis was performed as previously reported (Hirose et al., 2009, 2010). The protein extracts of the whole kidney (12.5 µg/lane), microsomal fraction (12.5 µg/lane) and cytosolic fraction (50 µg/lane), and plasma samples (0.5 µl/lane) were loaded onto a 16% sodium dodecyl sulfate polyacrylamide gel and electrophoresed for 1 h at 150 V. The (P)RR antiserum was used at a dilution of 1:10,000 (Hirose et al. 2009, 2010). The (P)RR antiserum recognizes dual bands at 28 kDa and 35 kDa, which are compatible with the predicted sizes for s(P)RR and f(P)RR, respectively.
It was reported that expression of aquaporin 2 (AQP2) rapidly increased in the rat kidney after 1 day of dehydration, with a small further increment on the following day (Rai et al. 1997). AQP2 protein expression was therefore investigated to confirm its elevation by dehydration in the kidney tissue using a rabbit anti-AQP2 antibody (dilution, 1:200; Santa Cruz Biotechnology, California, USA) (Saito et al. 1997). In addition, furin expression was investigated in the renal microsomal fraction using a rabbit anti-furin antibody (dilution, 1:200; Santa Cruz Biotechnology)(Freyer et al. 2007). As an internal control, β-actin expression was studied using anti β-actin monoclonal antibody (1:10,000; Santa Cruz Biotechnology).
The relative intensities of the bands at 35 kDa for f(P)RR, 28 kDa for s(P)RR, and 36-45 kDa and 29 kDa for AQP2 were quantified using Image J software (version 1.40, National Institutes of Health, Bethesda, Maryland, USA).
RNA extraction and competitive, quantitative RT-PCR
Total RNA was extracted from the kidney tissue by the guanidinium isothiocyanate/cesium chloride method, and 4 µg of total RNA were reverse transcribed with 400 units of Moloney Murine Leukemia Virus reverse transcriptase (PrimeScript; TaKaRa, Otsu, Japan) using an oligo(dT) primer, as previously described (Mori et al. 2009; Hirose et al. 2009, 2010). Expression levels of (P)RR mRNA in the kidney were determined using competitive, quantitative RT-PCR method, as previously described (Hirose et al. 2009, 2010). Ribosomal protein L32 (RPL32) mRNA was used as an internal control.
Hormone measurement
Plasma renin activity (PRA) and plasma angiotensin II (Ang II) levels were measured by enzyme immunoassay and radioimmunoassay, respectively (BML inc., Tokyo, Japan). Plasma osmotic pressure, urine creatinine and urine osmotic pressure were measured by a standard autoanalysis technique (BML inc., Tokyo, Japan). Plasma s(P)RR levels were determined using a commercially available enzyme-linked immunosorbent assay (ELISA) kit (Immuno-Biological Laboratories Co, Fujioka, Japan) according to the manufacturer’s instructions (Maruyama et al. 2013).
Statistical analysis
Data are shown as mean ± SD. Data between two groups were compared by unpaired Student’s t-test. Statistical significance was considered at P < 0.05.
Results
Effects of water deprivation on general parameters and AQP2 expression
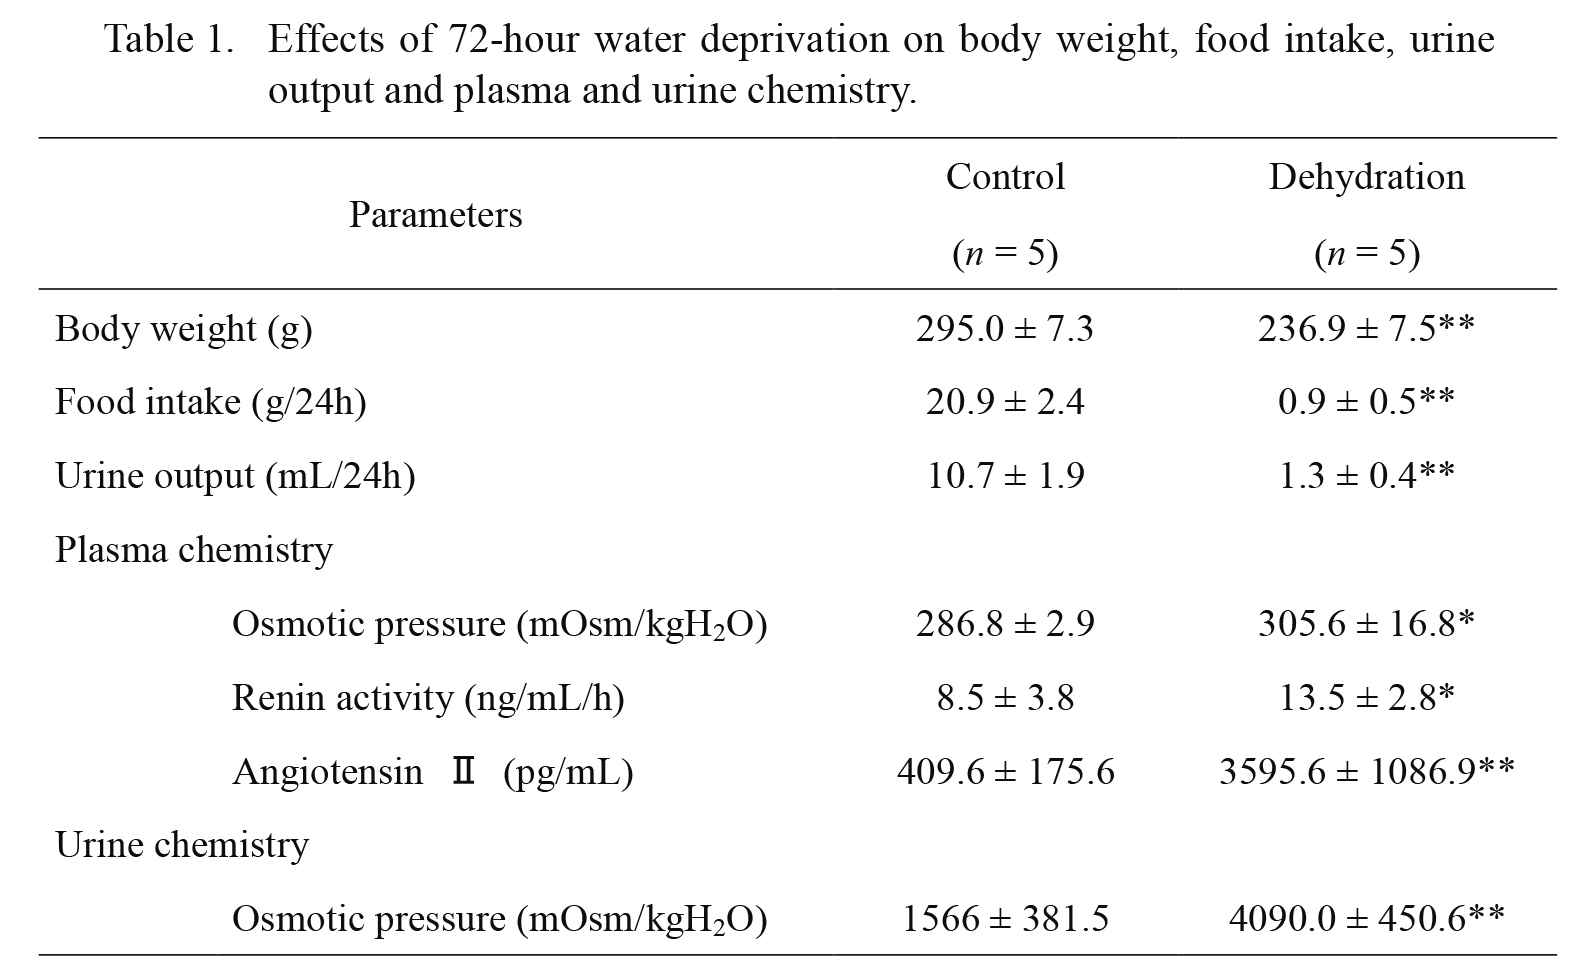
Effects of 72-hour water deprivation on body weight, food intake, urine output and plasma and urine chemistry are shown in Table 1. Before the water deprivation, there was no significant difference in the body weight, food intake, urine output, or urinary osmolality between the two groups (data not shown). Water deprivation for 72 h in WKY rats significantly decreased body weight and food intake. Water deprivation also reduced urine volume, and increased urine and plasma osmolality. Plasma renin activity and plasma Ang II concentrations were significantly elevated in DH rats compared to control rats.
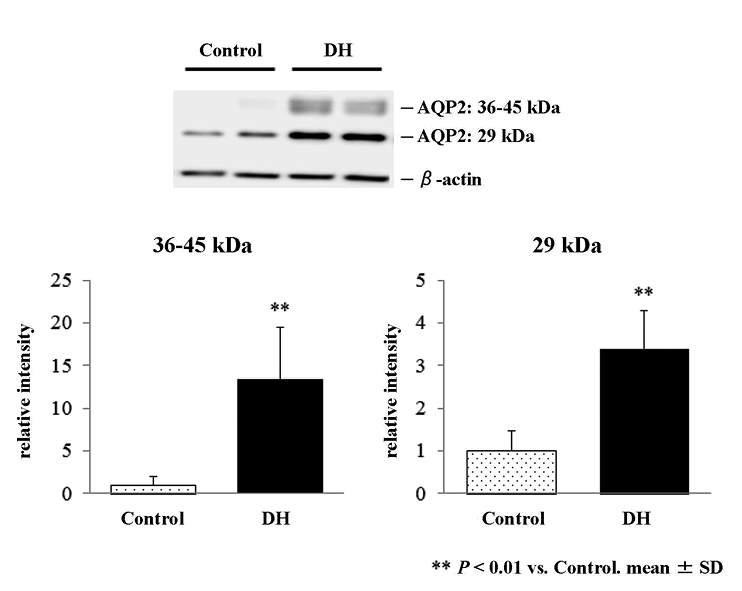
Western blot analysis confirmed that 72-hour water deprivation increased expression of AQP2 proteins in the kidney (Fig. 1, upper panel). The intensity of both bands at 36-45 kDa and 29 kDa representing glycosylated and non-glycosylated AQP2 proteins was significantly increased by 13.3- and 3.4-fold, respectively, in the whole kidney of DH rats as compared to control (Fig. 1, lower panel).
Plasma concentrations of soluble (pro)renin receptor
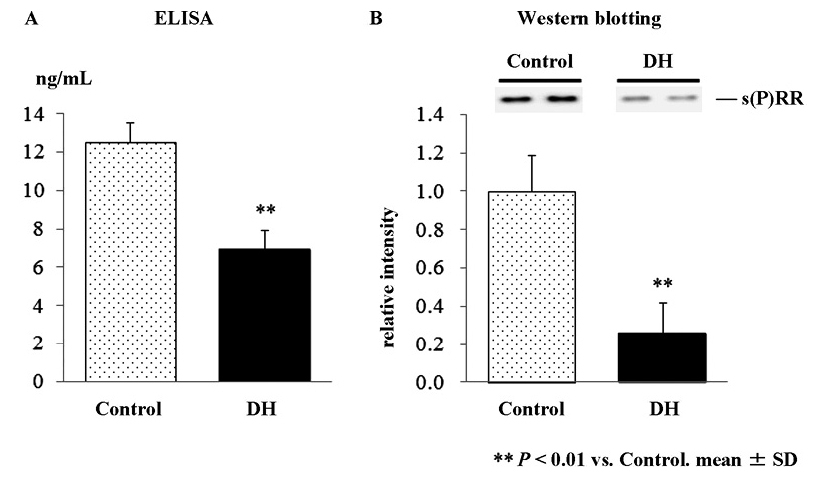
Plasma s(P)RR concentrations measured by ELISA were significantly lower in DH rats (6.94 ± 2.08 ng/mL) than in control (12.54 ± 2.00 ng/mL) (p < 0.05, Fig. 2A). Western blot analysis of plasma showed a band at 28 kDa corresponding to s(P)RR (Fig. 2B). Consistent with the results in the ELISA, the intensity of the band corresponding to s(P)RR was significantly lower in DH rats than in control (26% of control, p < 0.01, Fig. 2B). There was a significant correlation between plasma s(P)RR levels measured by the ELISA, and the relative levels of plasma (P)RR in the western blot analysis (r = 0.72, p < 0.005).
Western blot analysis of (P)RR in the kidney
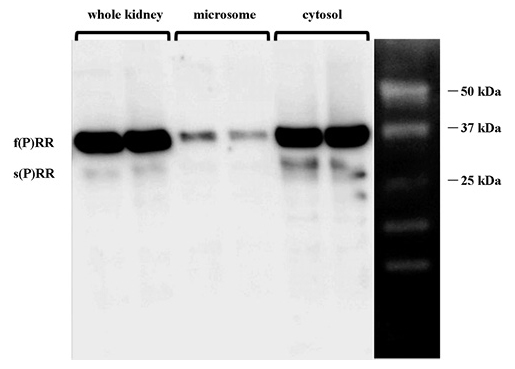
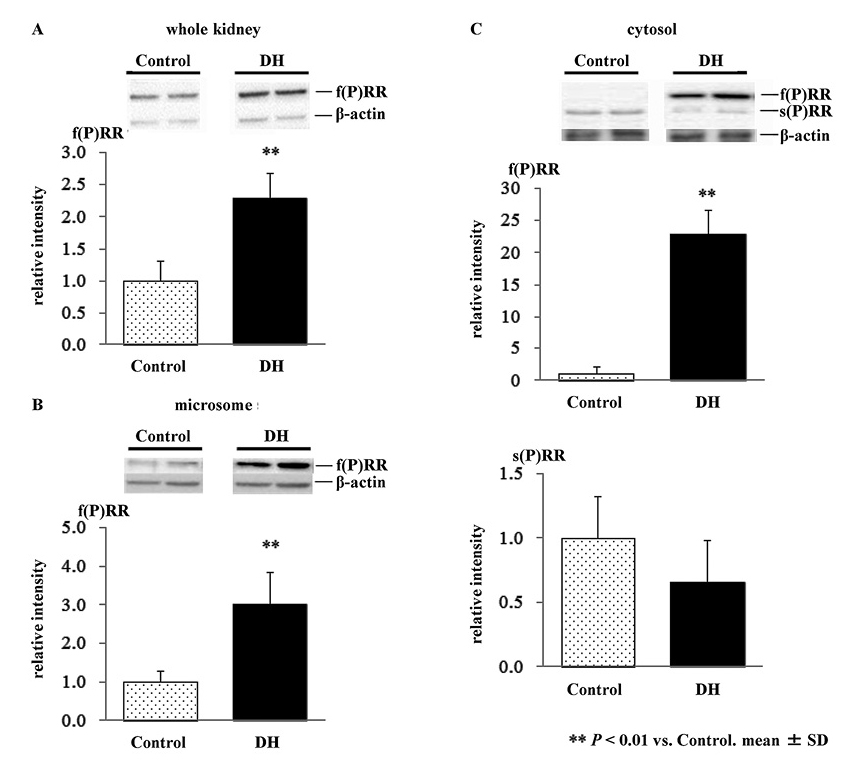
We first determined the levels of 2 forms of (P)RR; f(P)RR and s(P)RR, in microsomal and cytosolic fractions by western blot analysis. As shown in Fig. 3, s(P)RR was detected primarily in the cytosolic fraction, while a lesser proportion was detected in the microsomal fraction. Full-length (P)RR was detected in all samples.
We then examined the effects of 72-hour water deprivation on (P)RR protein expression by western blot analysis. Expression levels of f(P)RR were greater in DH rats compared to control, in whole kidney (2.3-fold, p < 0.01, Fig. 4A), microsome fraction (3.0-fold, p < 0.01, Fig. 4B), and cytosolic fraction (22.9-fold, p < 0.01, Fig. 4C, upper panel), respectively. By contrast, there was no significant difference in the expression levels of s(P)RR in the cytosolic fraction between control and DH rats (Fig. 4C, lower panel).
Competitive, quantitative RT-PCR of (P)RR mRNA
The 72-hour water deprivation had no significant effects on expression levels of (P)RR mRNA in the kidney (control, 0.88 ± 0.13 mol/mol PRL32, n = 5; vs. DH rats 0.83 ± 0.19 mol/mol PRL32, n = 5, p > 0.1)
Western blot analysis of furin in the renal microsomal fraction
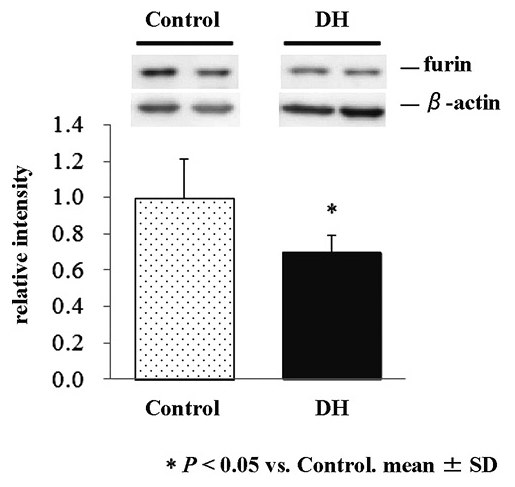
We finally examined the effects of the 72-hour water deprivation on the expression of furin, a protease responsible for the shedding of (P)RR, in the renal microsomal fraction. Expression levels of furin were significantly lower in DH rats than in control rats (70% of control, p < 0.05, Fig. 5).
Discussion
This study has shown increased tissue levels of f(P)RR protein in the kidney by 72-h water deprivation. By contrast, plasma s(P)RR concentrations and expression levels of furin protein in the kidney were decreased by 72-h water deprivation. Because the water deprivation had no significant effect on the expression levels of (P)RR mRNA in the kidney, the increased kidney tissue levels of f(P)RR protein may be due to the decreased cleavage of f(P)RR, possibly by furin. These findings suggested that dehydration by 72-h water deprivation decreased renal expression of furin, which resulted in decreased cleavage of f(P)RR into s(P)RR and truncated (P)RR in the kidney. The mechanism for the suppressed expression of furin in the kidney by dehydration remains to be clarified.
One possible action of increased renal f(P)RR in dehydration may be the contribution to the renal RAS activation, which results in increased Ang II generation. Increased Ang II may stimulate reabsorption of sodium and water in the renal tubules and collecting ducts against dehydration. We confirmed the elevation of PRA and plasma Ang II levels under dehydration as shown in Table 1, although we could not deny the possibility that anesthesia affected these levels (Pettinger et al. 1975; Siragy et al. 1995). Furthermore, dehydration-induced (P)RR may promote the kidney dysfunction via Ang II, and the RAS-independent intracellular signalling pathways, including ERK 1/2 and transforming growth factor-β.
Another possible action of increased f(P)RR in the kidney under dehydration may be mediated by the association with v-ATPase, which plays an essential role in the secretion of H+ into urine in the type A intercalated cells of the collecting duct (Roy et al. 2015). It is now evident that intercalated cells have regulatory roles in the salt and water reabsorption by a mechanism involving v-ATPase (Chambrey et al. 2013; Roy et al. 2015). It should be noted, however, that the cleavage of f(P)RR by furin may be dispensable for the biogenesis of active v-ATPase (Kinouchi et al. 2013). Decreased furin expression may result in decreased truncated (P)RR in the kidney, and decreased v-ATPase activity. Because our (P)RR could not recognise truncated (P)RR, further studies are required to clarify whether the renal v-ATPase activity is decreased or not under dehydration.
The up-regulated f(P)RR expression in rat nephron by high salt intake was reported by us (Rong et al. 2015), and other investigators (Huang et al. 2012). High salt intake suppresses the circulating RAS, whereas water deprivation activates it. It is therefore intriguing that upregulated f(P)RR levels in the kidney were found in both the conditions. Increased plasma osmolarity may be a cause and/or a target of up-regulated renal f(P)RR in both the high salt intake and dehydration. It was reported that dehydration induced a considerable increase in the daily output of sodium in urine (McKinley et al. 1983). Food and sodium intake fell during dehydration, but urinary sodium excretion increased significantly (Thrasher et al. 1984).
(P)RR is expressed, not only in the kidney, but also in various organs including brain (Hirose et al. 2009, 2010; Takahashi et al. 2010a, b; Nguyen 2011). (P)RR was co-localized with vasopressin in the paraventricular and supraoptic neurons of hypothalamus (Takahashi et al. 2010a). Shan et al. (2010) showed that (P)RR overexpression in the supraoptic nucleus stimulated vasopressin secretion and chronic knockdown of (P)RR decreased it in rats, suggesting that (P)RR plays a role in vasopressin secretion in the hypothalamus. Hypothalamic (P)RR may therefore modulate the vasopressin secretion against dehydration. Although the present study studied only plasma and kidney tissues, we could not deny the possibility that the similar alteration in the (P)RR expression levels occurred in other organs including the brain, affecting the decreased plasma concentrations of s(P)RR under dehydration.
Plasma s(P)RR concentrations were significantly decreased by 72-h water deprivation (Fig. 2), whereas the decrease of the renal s(P)RR levels in the cytosolic fraction did not reach the significance (Fig. 4C, lower panel). Newly generated s(P)RR may be secreted soon into blood by exocytosis, and therefore, the plasma levels of s(P)RR may reflect more accurately the amount of the newly-generated s(P)RR from f(P)RR by furin rather than the tissue s(P)RR levels. On the other hand, the physiological roles of s(P)RR in blood have not been clarified. Nguyen et al. (2014) reported that plasma levels of s(P)RR were independent of plasma renin, prorenin, and aldosterone concentrations in man. Moreover, plasma levels of s(P)RR showed no significant correlation with PRA or plasma aldosterone levels in patients with obstructive sleep apnea syndrome (Nishijima et al. 2014, 2016). It has been reported that most soluble receptors act as antagonists and compete with their membrane-associated counterparts for ligands (Rose-John et al. 2006; Tracey et al. 2008). There have been no reports, however, which show that s(P)RR in blood acts as an antagonist against renin. Thus, it remains to be clarified whether decreased plasma s(P)RR concentrations have some pathophysiological significance in dehydration, or just a sequence of increased tissue f(P)RR levels.
In conclusion, the present study has shown that increased tissue levels of f(P)RR protein in the kidney by water deprivation possibly via decreased furin-mediated cleavage. In contrast to the increased renal f(P)RR levels, plasma s(P)RR concentrations were decreased by water deprivation. (P)RR may play an essential role in the up-regulation of the renal RAS and the production of concentrated urine under dehydration.
Acknowledgments
The authors acknowledge the support of the Biomedical Research Core of Tohoku University, Graduate School of Medicine, and the Biomedical Research Unit of Tohoku University Hospital. This work was partly supported by Grants-in-aid for Scientific Research from the Ministry of Education, Culture, Sports, Science and Technology (No. 24300188, No. 25461205).
Conflict of Interest
The authors declare no conflict of interest.
References
-
Chambrey,
R.,
Kurth,
I.,
Peti-Peterdi,
J.,
Houillier,
P.,
Purkerson,
J.M.,
Leviel,
F.,
Hentschke,
M.,
Zdebik,
A.A.,
Schwartz,
G.J.,
Hübner,
C.A. &
Eladari,
D.
(2013) Renal intercalated cells are rather energized by a proton than a sodium pump. Proc. Natl. Acad. Sci. USA, 110, 7928-7933.
-
Chmela,
Z.,
Veselý,
J.,
Lemr,
K.,
Rypka,
M.,
Hanus,
J.,
Havlícek,
L.,
Krystof,
V.,
Michnová,
L.,
Fuksová,
K. &
Lukes,
J.
(2001) In vivo metabolism of 2,6,9-trisubstituted purine-derived cyclin-dependent kinase inhibitor bohemine in mice: glucosidation as the principal metabolic route. Drug Metab. Dispos., 29, 326-334.
-
Chung,
H.J.,
Lee,
I. &
Lee,
M.G.
(2008) Effects of water deprivation for 72 h on the pharmacokinetics of ipriflavone in rats. Res. Vet. Sci., 85, 149-155.
-
Cousin,
C.,
Bracquart,
D.,
Contrepas,
A.,
Corvol,
P.,
Muller,
L. &
Nguyen,
G.
(2009) Soluble form of the (pro)renin receptor generated by intracellular cleavage by furin is secreted in plasma. Hypertension, 53, 1077-1082.
-
Cruciat,
C.M.,
Ohkawara,
B.,
Acebron,
S.P.,
Karaulanov,
E.,
Reinhard,
C.,
Ingelfinger,
D.,
Boutros,
M. &
Niehrs,
C.
(2010) Requirement of prorenin receptor and vacuolar H+-ATPase-mediated acidification for Wnt signaling. Science, 327, 459-463.
-
Freyer,
C.,
Kilpatrick,
L.M.,
Salamonsen,
L.A. &
Nie,
G.
(2007) Pro-protein convertases (PCs) other than PC6 are not tightly regulated for implantation in the human endometrium. Reproduction, 133, 1189-1197.
-
Gonzalez,
A.A.,
Lara,
L.S.,
Luffman,
C.,
Seth,
D.M. &
Prieto,
M.C.
(2011) Soluble form of the (pro)renin receptor is augmented in the collecting duct and urine of chronic angiotensin II-dependent hypertensive rats. Hypertension, 57, 859-864.
-
Gottlieb,
H.B.,
Ji,
L.L.,
Jones,
H.,
Penny,
M.L.,
Fleming,
T. &
Cunningham,
J.T.
(2006) Differential effects of water and saline intake on water deprivation-induced c-Fos staining in the rat. Am. J. Physiol. Regul. Integr. Comp. Physiol., 290, R1251-R1261.
-
Hamada,
K.,
Taniguchi,
Y.,
Shimamura,
Y.,
Inoue,
K.,
Ogata,
K.,
Ishihara,
M.,
Horino,
T.,
Fujimoto,
S.,
Ohguro,
T.,
Yoshimoto,
Y.,
Ikebe,
M.,
Yuasa,
K.,
Hoshino,
E.,
Iiyama,
T.,
Ichihara,
A. &
Terada,
Y.
(2013) Serum level of soluble (pro)renin receptor is modulated in chronic kidney disease. Clin. Exp. Nephrol., 17, 848-856.
-
Heineke,
J.,
Auger-Messier,
M.,
Xu,
J.,
Sargent,
M.,
York,
A.,
Welle,
S. &
Molkentin,
J.D.
(2010) Genetic deletion of myostatin from the heart prevents skeletal muscle atrophy in heart failure. Circulation, 121, 419-425.
-
Hindmarch,
C.C.,
Fry,
M.,
Smith,
P.M.,
Yao,
S.T.,
Hazell,
G.G.,
Lolait,
S.J.,
Paton,
J.F.,
Ferguson,
A.V. &
Murphy,
D.
(2011) The transcriptome of the medullary area postrema: the thirsty rat, the hungry rat and the hypertensive rat. Exp. Physiol., 96, 495-504.
-
Hirose,
T.,
Mori,
N.,
Totsune,
K.,
Morimoto,
R.,
Maejima,
T.,
Kawamura,
T.,
Metoki,
H.,
Asayama,
K.,
Kikuya,
M.,
Ohkubo,
T.,
Kohzuki,
M.,
Takahashi,
K. &
Imai,
Y.
(2009) Gene expression of (pro)renin receptor is upregulated in hearts and kidneys of rats with congestive heart failure. Peptides, 30, 2316-2322.
-
Hirose,
T.,
Mori,
N.,
Totsune,
K.,
Morimoto,
R.,
Maejima,
T.,
Kawamura,
T.,
Metoki,
H.,
Asayama,
K.,
Kikuya,
M.,
Ohkubo,
T.,
Kohzuki,
M.,
Takahashi,
K. &
Imai,
Y.
(2010) Increased expression of (pro)renin receptor in the remnant kidneys of 5/6 nephrectomized rats. Regul. Pept., 159, 93-99.
-
Huang,
Y.,
Yamamoto,
T.,
Misaki,
T.,
Suzuki,
H.,
Togawa,
A.,
Ohashi,
N.,
Fukasawa,
H.,
Fujigaki,
Y.,
Ichihara,
A.,
Nishiyama,
A.,
Senbonmatsu,
T.,
Ikegaya,
N. &
Hishida,
A.
(2012) Enhanced intrarenal receptor-mediated prorenin activation in chronic progressive anti-thymocyte serum nephritis rats on high salt intake. Am. J. Physiol. Renal. Physiol., 303, F130-F138.
-
Jorgensen,
P.L.
(1974) Isolation of (Na+ plus K+)-ATPase. Methods Enzymol., 32, 277-290.
-
Kinouchi,
K.,
Ichihara,
A.,
Sano,
M.,
Sun-Wada,
G.H.,
Wada,
Y.,
Ochi,
H.,
Fukuda,
T.,
Bokuda,
K.,
Kurosawa,
H.,
Yoshida,
N.,
Takeda,
S.,
Fukuda,
K. &
Itoh,
H.
(2013) The role of individual domains and the significance of shedding of ATP6AP2/(pro)renin receptor in vacuolar H(+)-ATPase biogenesis. PLoS One, 8, e78603.
-
Laragh,
J.H.
(1967) Renin, angiotensin, aldosterone and hormonal regulation of arterial pressure and salt balance. Introductory remarks. Fed. Proc., 26, 39-41.
-
Ludwig,
J.,
Kerscher,
S.,
Brandt,
U.,
Pfeiffer,
K.,
Getlawi,
F.,
Apps,
D.K. &
Schägger,
H.
(1998) Identification and characterization of a novel 9.2-kDa membrane sector-associated protein of vacuolar proton-ATPase from chromaffin granules. J. Biol. Chem., 273, 10939-10947.
-
Maruyama,
N.,
Segawa,
T.,
Kinoshita,
N. &
Ichihara,
A.
(2013) Novel sandwich ELISA for detecting the human soluble (pro)renin receptor. Front. Biosci. (Elite Ed.), 5, 583-590.
-
McKinley,
M.J.,
Denton,
D.A.,
Nelson,
J.F. &
Weisinger,
R.S.
(1983) Dehydration induces sodium depletion in rats, rabbits, and sheep. Am. J. Physiol., 245, R287-R292.
-
Mori,
N.,
Hirose,
T.,
Nakayama,
T.,
Ito,
O.,
Kanazawa,
M.,
Imai,
Y.,
Kohzuki,
M.,
Takahashi,
K. &
Totsune,
K.
(2009) Increased expression of urotensin II-related peptide and its receptor in kidney with hypertension or renal failure. Peptides, 30, 400-408.
-
Nguyen,
G.
(2011) Renin, (pro)renin and receptor: an update. Clin. Sci. (Lond.), 120, 169-178.
-
Nguyen,
G.,
Blanchard,
A.,
Curis,
E.,
Bergerot,
D.,
Chambon,
Y.,
Hirose,
T.,
Caumont-Prim,
A.,
Tabard,
S.B.,
Baron,
S.,
Frank,
M.,
Totsune,
K. &
Azizi,
M.
(2014) Plasma Soluble (pro)renin receptor is independent of plasma renin, prorenin, and aldosterone concentrations but is affected by ethnicity. Hypertension, 63, 297-302.
-
Nguyen,
G.,
Delarue,
F.,
Burcklé,
C.,
Bouzhir,
L.,
Giller,
T. &
Sraer,
J.D.
(2002) Pivotal role of the renin/prorenin receptor in angiotensin II production and cellular responses to renin. J. Clin. Invest., 109, 1417-1427.
-
Nishijima,
T.,
Tajima,
K.,
Takahashi,
K. &
Sakurai,
S.
(2014) Elevated plasma levels of soluble (pro)renin receptor in patients with obstructive sleep apnea syndrome: association with polysomnographic parameters. Peptides, 56, 14-21.
-
Nishijima,
T.,
Tajima,
K.,
Yamashiro,
Y.,
Hosokawa,
K.,
Suwabe,
A.,
Takahashi,
K. &
Sakurai,
S.
(2016) Elevated plasma levels of soluble (pro)renin receptor in patients with obstructive sleep apnea syndrome in parallel with the disease severity. Tohoku J. Exp. Med., 238, 325-338.
-
Pettinger,
W.A.,
Tanaka,
K.,
Keeton,
K.,
Campbell,
W.B. &
Brooks,
S.N.
(1975) Renin release, an artifact of anesthesia and its implications in rats. Proc. Soc. Exp. Biol. Med., 148, 625-630.
-
Rai,
T.,
Sekine,
K.,
Kanno,
K.,
Hata,
K.,
Miura,
M.,
Mizushima,
A.,
Marumo,
F. &
Sasaki,
S.
(1997) Urinary excretion of aquaporin-2 water channel protein in human and rat. J. Am. Soc. Nephrol., 8, 1357-1362.
-
Ramkumar,
N.,
Stuart,
D.,
Calquin,
M.,
Quadri,
S.,
Wang,
S.,
Van Hoek,
A.N.,
Siragy,
H.M.,
Ichihara,
A. &
Kohan,
D.E.
(2015) Nephron-specific deletion of the prorenin receptor causes a urine concentration defect. Am. J. Physiol. Renal Physiol., 309, F48-F56.
-
Rong,
R.,
Ito,
O.,
Mori,
N.,
Muroya,
Y.,
Tamura,
Y.,
Mori,
T.,
Ito,
S.,
Takahashi,
K.,
Totsune,
K. &
Kohzuki,
M.
(2015) Expression of (pro)renin receptor and its upregulation by high salt intake in the rat nephron. Peptides, 63, 156-162.
-
Rose-John,
S.,
Scheller,
J.,
Elson,
G. &
Jones,
S.A.
(2006) Interleukin-6 biology is coordinated by membrane-bound and soluble receptors: role in inflammation and cancer. J. Leukoc. Biol., 80, 227-236.
-
Roy,
A.,
Al-bataineh,
M.M. &
Pastor-Soler,
N.M.
(2015) Collecting duct intercalated cell function and regulation. Clin. J. Am. Soc. Nephrol., 10, 305-324.
-
Saito,
T.,
Ishikawa,
S.E.,
Sasaki,
S.,
Fujita,
N.,
Fushimi,
K.,
Okada,
K.,
Takeuchi,
K.,
Sakamoto,
A.,
Ookawara,
S.,
Kaneko,
T.,
Marumo,
F. &
Saito,
T.
(1997) Alteration in water channel AQP-2 by removal of AVP stimulation in collecting duct cells of dehydrated rats. Am. J. Physiol., 272, F183-F191.
-
Shan,
Z.,
Shi,
P.,
Cuadra,
A.E.,
Dong,
Y.,
Lamont,
G.J.,
Li,
Q.,
Seth,
D.M.,
Navar,
L.G.,
Katovich,
M.J.,
Sumners,
C. &
Raizada,
M.K.
(2010) Involvement of the brain (pro)renin receptor in cardiovascular homeostasis. Circ. Res., 107, 934-938.
-
Siragy,
H.M.,
Howell,
N.L.,
Ragsdale,
N.V. &
Carey,
R.M.
(1995) Renal interstitial fluid angiotensin. Modulation by anesthesia, epinephrine, sodium depletion, and renin inhibition. Hypertension, 25, 1021-1024.
-
Takahashi,
K.,
Hiraishi,
K.,
Hirose,
T.,
Kato,
I.,
Yamamoto,
H.,
Shoji,
I.,
Shibasaki,
A.,
Kaneko,
K.,
Satoh,
F. &
Totsune,
K.
(2010a) Expression of (pro)renin receptor in the human brain and pituitary, and co-localisation with arginine vasopressin and oxytocin in the hypothalamus. J. Neuroendocrinol., 22, 453-459.
-
Takahashi,
K.,
Yamamoto,
H.,
Hirose,
T.,
Hiraishi,
K.,
Shoji,
I.,
Shibasaki,
A.,
Kato,
I.,
Kaneko,
K.,
Sasano,
H.,
Satoh,
F. &
Totsune,
K.
(2010b) Expression of (pro)renin receptor in human kidneys with end-stage kidney disease due to diabetic nephropathy. Peptides, 31, 1405-1408.
-
Thrasher,
T.N.,
Wade,
C.E.,
Keil,
L.C. &
Ramsay,
D.J.
(1984) Sodium balance and aldosterone during dehydration and rehydration in the dog. Am. J. Physiol., 247, R76-R83.
-
Tracey,
D.,
Klareskog,
L.,
Sasso,
E.H.,
Salfeld,
J.G. &
Tak,
P.P.
(2008) Tumor necrosis factor antagonist mechanisms of action: a comprehensive review. Pharmacol. Ther., 117, 244-279.
-
Watanabe,
N.,
Bokuda,
K.,
Fujiwara,
T.,
Suzuki,
T.,
Mito,
A.,
Morimoto,
S.,
Jwa,
S.C.,
Egawa,
M.,
Arai,
Y.,
Suzuki,
F.,
Sago,
H. &
Ichihara,
A.
(2012) Soluble (pro)renin receptor and blood pressure during pregnancy: a prospective cohort study. Hypertension, 60, 1250-1256.
-
Watanabe,
N.,
Morimoto,
S.,
Fujiwara,
T.,
Suzuki,
T.,
Taniguchi,
K.,
Mori,
F.,
Ando,
T.,
Watanabe,
D.,
Kimura,
T.,
Sago,
H. &
Ichihara,
A.
(2013) Prediction of gestational diabetes mellitus by soluble (pro)renin receptor during the first trimester. J. Clin. Endocrinol. Metab., 98, 2528-2535.